Showing posts with label LOLA. Show all posts

Saturday, February 21, 2015

The search for transient frost using laser altimetry

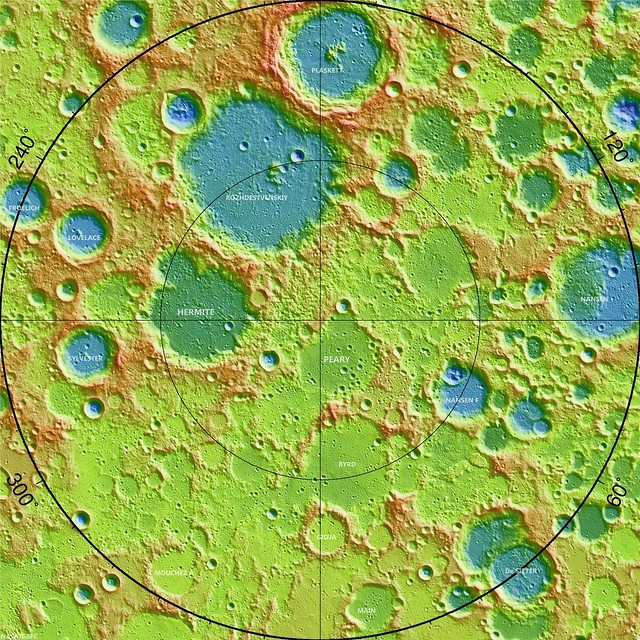
Laser altimetry map of the Moon's northern polar region, north of 80° at 20 meters resolution. The crater Lovelace (57.06 km; 82.08°N, 250.49°E), referenced below, is southwest of Hermite, where the lowest temperatures yet recorded in the Solar System have been measured on the pole-facing walls, in permanent shadow [NASA/GSFC].

A SEARCH FOR TRANSIENT WATER FROST
AT THE LUNAR POLES
USING THE LUNAR ORBITER LASER ALTIMETER

M. Lemelin, et.al.
University of Hawaii at Manoa


Introduction: The possibility of lunar polar ice was suggested by Harold Urey in the 1950's [1], and has likely been directly detected at the North Pole of Mercury by MESSENGER. That detection was based on the presence of reflectance anomalies seen by the Mercury Laser Altimeter (MLA) that occurred only where models of the surface temperature allow long-duration preservation of surface water ice against sublimation [2,3].

Anomalous reflectance is also seen at the lunar poles, revealed by laser measurements. The reflectance of permanently shadowed regions is systematically higher than nearby areas that receive at least some illumination [2,3,4] (Fig. 1). Models suggest that if the higher reflectance is due to the presence of water ice; up to 14 wt.% could be present depending on the distribution of frost within or on the regolith.

Figure 1. DIVINER maximum temperature (left) and LOLA reflectance (right) for the north polar crater Lovelace. The blue patch in the temperature image shows the location of a permanently shadowed region. The corresponding location in the reflectance image clearly show higher reflectance than the surroundings
Results of lunar observations by the Deep Impact High-Resolution Instrument – Infrared spectrometer (HRI-IR) in the 3 μm region and by the Lunar Reconnaissance Orbiter (LRO) Lyman Alpha mapping project (LAMP) in the far-UV region both show that spectral features consistent with hydration of the surface are diurnally variable. This indicates that water is pos-sibly mobile on the lunar surface [5,6]. Because the lifetime of water molecules in the lunar atmosphere is short against dissociation (~20 hours) compared to the lunar diurnal cycle, water must be continuously pro-duced to account for the observations. Mobile water will trap on cold surfaces during the lunar night and be released when surfaces are illuminated during the day.

In this study, we seek evidence for transient water frost on the polar surfaces using reflectance data from the Lunar Orbiter Laser Altimeter (LOLA), and temperature data from the DIVINER radiometer, both onboard the LRO. We aim to search for areas that may “load” with surface frost during the night causing in-creased reflectance, and unload during the day reducing the reflectance. Detection of transient surface frost constrains the rate of input into the lunar volatile system.

Methods and datasets: LOLA measures the backscattered energy of the returning altimetric laser pulse at 1064 nm. This data is used to map the reflectivity of the Moon at zero-phase angle with a photo-metrically uniform data set. The zero-phase geometry is insensitive to lunar topography and enables the characterization of subtle variations in lunar albedo, even at high latitudes where such measurements are not possible with the Sun as the illumination source. The DIVINER radiometer simultaneously measures the bolometric temperature of the lunar surface.

To find evidence of transient surface frost, we examined locations where reflectance data from LOLA exists at both low (less than 156 K, a loss of 100 μm of frost per month or less, sufficiently cold for ice to persist during a single lunar night [7,8]) and high temperatures (greater than 201 K, a loss of 1 mm of frost per month or more, no possibility of retaining surface ice [7,8]) using the DIVINER radiometer data, seeking changes in albedo with temperature. We search the LOLA reflectance dataset for locations that have reflectances measured at both low and high temperatures using DIVINER tem-perature measurements obtained simultaneously with LOLA data. For this initial search, we examined both polar regions at a spatial resolution of 2 pixels per degree (~15 km per pixel), within ±50-90º latitude.

Initial Results: For both polar regions (±50-90º latitude), we find that most of the pixels outside permanently shadowed regions are subject to both low (less than 156 K) and high (greater than 201 K) temperatures. Figure 2 shows the LOLA reflectance data for both poles when the temperature of a given pixel is either greater than 156 K (Fig. 2 left) or greater than 201 K (Fig. 2, right).

Methods and datasets: LOLA measures the backscattered energy of the returning altimetric laser pulse at 1064 nm. This data is used to map the reflectivity of the Moon at zero-phase angle with a photo-metrically uniform data set. The zero-phase geometry is insensitive to lunar topography and enables the characterization of subtle variations in lunar albedo, even at high latitudes where such measurements are not possible with the Sun as the illumination source. The DIVINER radiometer simultaneously measures the bolometric temperature of the lunar surface.

By subtracting the 1064 nm reflectance when the temperature is high (greater than 201 K) from the reflectance when the temperature is low (below 156 K), we find that the global difference in reflectance averages near 0 for both polar regions (Fig. 3). Therefore, we do not detect a general temperature dependent reflectance variation.

Figure 2. LOLA 1064 nm reflectance for (A) the North Pole and (B) the South Pole. The reflectance when the temperature is low (less than 156°K) is shown on the left and the reflectance when the temperature is high (greater than 201°K) is shown on the right.
Figure 3. LOLA 1064 nm reflectance difference between the reflectance when the temperature is high (greater than 201° K) and when the temperature is low (less than 156° K), for (A) the North Pole and (B) the South Pole.
Discussion and future work: We did not detect a general temperature dependent reflectance variation in our study for either polar region with a detection precision of about 1%. Using a simple model of a nonabsorbing layer over an absorbing substrate, a very small optical depth is required to raise the reflectance by 1%, only 0.045 ([9] Section 9.D.2). This corresponds to ~30 μg/cm2, a layer thickness of about 300 nm. In comparison, the observations of [5,6] require a layer thickness of at least 10's of nanometer to account for the observed band depths. This suggests that our current measurements are at the edge of detection of the source implied by the spacecraft observations. In contrast to the implications of the reported measurements, the solar wind can provide far less water; concentrated in a single layer, calculations by [10] suggest only 0.01 nm globally averaged per month.

Our current analysis did not take into account how long each surface element has been subject to cold temperatures (i.e., if it had time to accumulate frost). For example, based on a Monte Carlo model, Schorghofer (2014) [11] showed that a continuous source of water molecules arriving on the lunar surface (regardless of the source) would significantly accumulate near the morning terminator. Additional calculations show that the morning terminator should feature about 30 times the concentration of the average nightside abundance, improving prospects for detection. 

Future work includes reanalyzing existing data to include the time of exposure at low temperatures, and conducting targeted observations with LOLA to observe night time polar surfaces near the morning terminator in order to improve the upper limits of detection on transient water frost.

References: [1] Urey H. C. (1952) The Planets: Their Origin and Development. Yale University Press, New Haven, CT, 245 pp. [2] Paige D. A. et al. (2013) Science, 339, 300-303. [3] Neumann G. A. et al. (2013) Science, 339, 296-299. [4] Zuber M. T. et al. (2012) Nature, 486, 378-382. [5] Sunshine J. M. et al. (2009) Science, 326, 565-568. [6] Hendrix A. R. et al. (2012) JGR Planets, 117, E12001. [7] Zhang J. A. and Paige D. A. (2009) GRL, 36, L16203. [8] Zhang J. A. and Paige D. A. (2010) GRL, 37, L03203. [9] Hapke B. (1993) Theory of reflectance and emittance spectroscopy, Cambridge. [10] Hurley D. M. and Farrell W. M. (2013) LPSC 44, abstract #2015. [11] Schorghofer N. (2014) GRL, 41, 4888–4893.

Acknowledgments: This work is supported in part by the LRO LOLA experiment (David Smith PI), the LRO Diviner experiment (David Paige PI), and the Natural Science and Engineering Council of Canada (NSERC).

Wednesday, February 4, 2015

Hydrogen retention on pole-facing slopes

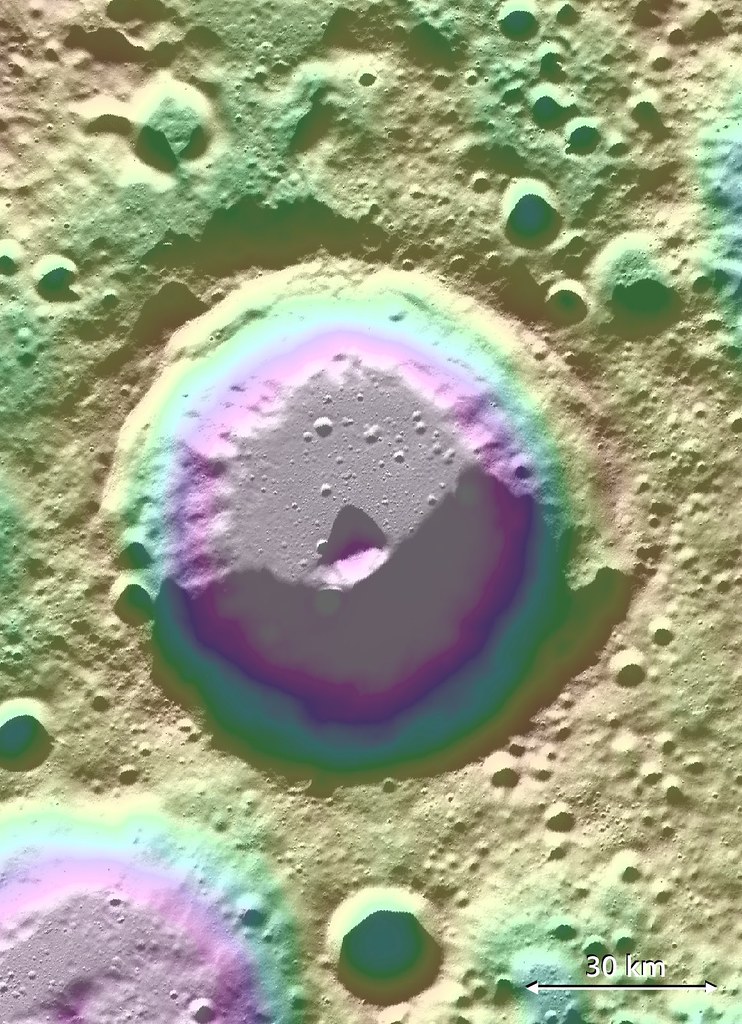
Lovelace (57.06 km; 82.08°N, 250.49°E) crater, of the Moon's far north, hosts a signature of volatiles within permanently shadowed regions (PSR) on the inside slope of its south wall. Long-term studies of the Moon's reserves of hydrogen and other volatiles, made possible by the extended science missions of the Lunar Reconnaissance Orbiter (LRO), show a diurnal cycle of hydrogen retention on pole-facing slopes, perhaps a result of neutral hydrogen from the Sun. [NASA/GSFC/ASU/LOLA/PDS].
Bill Steigerwald
Goddard Space Flight Center

Space travel is difficult and expensive – it would cost thousands of dollars to launch a bottle of water to the moon. The recent discovery of hydrogen-bearing molecules, possibly including water, on the Moon has explorers excited because these deposits could be mined if they are sufficiently abundant, sparing the considerable expense of bringing water from Earth.

Karnik
Lunar water could be used for drinking or its components – hydrogen and oxygen – could be used to manufacture important products on the surface that future visitors to the moon will need, like rocket fuel and breathable air.

Recent observations by NASA's Lunar Reconnaissance Orbiter (LRO) spacecraft indicate these deposits may be slightly more abundant on crater slopes in the southern hemisphere that face the lunar South Pole.

"There’s an average of about 23 parts-per-million-by-weight (ppmw) more hydrogen on Pole-Facing Slopes (PFS) than on Equator-Facing Slopes (EFS)," said Timothy McClanahan of NASA's Goddard Space Flight Center.

This is the first time a widespread geochemical difference in hydrogen abundance between PFS and EFS on the moon has been detected. It is equal to a one-percent difference in the neutron signal detected by LRO's Lunar Exploration Neutron Detector (LEND) instrument. McClanahan is lead author of a paper about this research published online October 19 in the journal Icarus.

The hydrogen-bearing material is volatile (easily vaporized), and may be in the form of water molecules (two hydrogen atoms bound to an oxygen atom) or hydroxyl molecules (an oxygen bound to a hydrogen) that are loosely bound to the lunar surface. The cause of the discrepancy between PFS and EFS may be similar to how the Sun mobilizes or redistributes frozen water from warmer to colder places on the surface of the Earth, according to McClanahan.

"Here in the northern hemisphere, if you go outside on a sunny day after a snowfall, you'll notice that there's more snow on north-facing slopes because they lose water at slower rates than the more sunlit south-facing slopes" said McClanahan. "We think a similar phenomenon is happening with the volatiles on the moon – PFS don't get as much sunlight as EFS, so this easily vaporized material stays longer and possibly accumulates to a greater extent on PFS."

The team observed the greater hydrogen abundance on PFS in the topography of the moon's southern hemisphere, beginning at between 50 and 60 degrees south latitude.

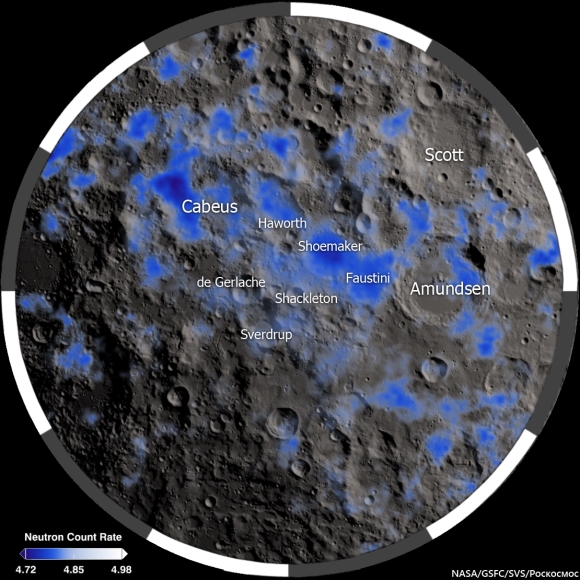
The Moon's polar south and its neutron suppression zpmes, indicative of the presence of hydrogen (inside and outside permanent shadow) mapped from data collected from the LRO LEND instrument over two and a half years [NASA/GSFC/SVS/Pockocmoc].
Slopes closer to the South Pole show a larger hydrogen concentration difference. Also, hydrogen was detected in greater concentrations on the larger PFS, about 45 ppmw near the poles. Spatially broader slopes provide more detectable signals than smaller slopes. The result indicates that PFS have greater hydrogen concentrations than their surrounding regions. Also, the LEND measurements over the larger EFS don't contrast with their surrounding regions, which indicates EFS have hydrogen concentrations that are equal to their surroundings, according to McClanahan. The team thinks more hydrogen may be found on PFS in northern hemisphere craters as well, but they are still gathering and analyzing LEND data for this region.

There are different possible sources for the hydrogen on the moon. Comets and some asteroids contain large amounts of water, and impacts by these objects may bring hydrogen to the moon. Hydrogen-bearing molecules could also be created on the lunar surface by interaction with the solar wind. The solar wind is a thin stream of gas that's constantly blown off the Sun. Most of it is hydrogen, and this hydrogen may interact with oxygen in silicate rock and dust on the moon to form hydroxyl and possibly water molecules. After these molecules arrive at the moon, it is thought they get energized by sunlight and then bounce across the lunar surface; and they get stuck, at least temporarily, in colder and more shadowy areas.

Since the 1960's scientists thought that only in permanently shadowed areas in craters near the lunar poles was it cold enough to accumulate this volatile material, but recent observations by a number of spacecraft, including LRO, suggest that hydrogen on the moon is more widespread.

It's uncertain if the hydrogen is abundant enough to economically mine. "The amounts we are detecting are still drier than the driest desert on Earth," said McClanahan. However, the resolution of the LEND instrument is greater than the size of most PFS, so smaller PFS slopes, perhaps approaching yards in size, may have significantly higher abundances, and indications are that the greatest hydrogen concentrations are within the permanently shaded regions, according to McClanahan.

The team made the observations using LRO's LEND instrument, which detects hydrogen by counting the number of subatomic particles called neutrons flying off the lunar surface. The neutrons are produced when the lunar surface gets bombarded by cosmic rays. Space is permeated by cosmic rays, which are high-speed particles produced by powerful events like flares on the Sun or exploding stars in deep space. Cosmic rays shatter atoms in material near the lunar surface, generating neutrons that bounce from atom to atom like a billiard ball. Some neutrons happen to bounce back into space where they can be counted by neutron detectors.

Neutrons from cosmic ray collisions have a wide range of speeds, and hydrogen atoms are most efficient at stopping neutrons in their medium speed range, called epithermal neutrons. Collisions with hydrogen atoms in the lunar regolith reduce the numbers of epithermal neutrons that fly into space. The more hydrogen present, the fewer epithermal neutrons the LEND detector will count.

Neutron suppression information in the Moon's polar north is, as yet, less granular than data mapped in greater detail over the far South. Here neutron suppression is overlaid on a LROC WAC mosaic with permanently shadowed regions (PSRs) outlined in black. Again, the occurrence of hydrogen is related to sunlight but not necessarily tied to its total absence.
The team interpreted a widespread decrease in the number of epithermal neutrons detected by LEND as a signal that hydrogen is present on PFS. They combined data from LEND with lunar topography and illumination maps derived from LRO's LOLA instrument (Lunar Orbiter Laser Altimeter), and temperature maps from LRO's Diviner instrument (Diviner Lunar Radiometer Experiment) to discover the greater hydrogen abundance and associated surface conditions on PFS.

In addition to seeing if the same pattern exists in the moon's northern hemisphere, the team wants to see if the hydrogen abundance changes with the transition from day to night. If so, it would substantiate existing evidence of a very active production and cycling of hydrogen on the lunar surface, according to McClanahan.

The research was funded by NASA's LRO mission. LEND was supplied by the Russian Federal Space Agency Roscosmos. Launched on June 18, 2009, LRO has collected a treasure trove of data with its seven powerful instruments, making an invaluable contribution to our knowledge about the moon. LRO is managed by NASA's Goddard Space Flight Center in Greenbelt, Maryland, for the Science Mission Directorate at NASA Headquarters in Washington.

Monday, February 2, 2015

LRO could remain in present orbit 7 or more years

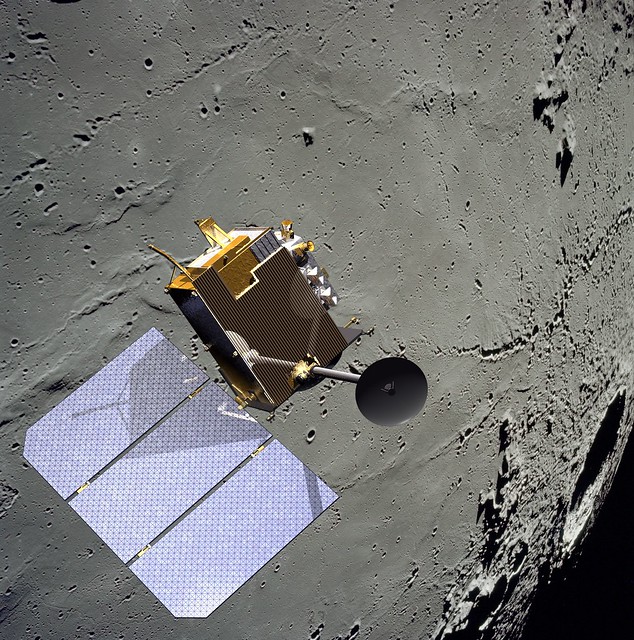
Because the Moon is lumpy and uneven, it's possible nothing has ever been in close-orbit around our companion planet as long as the Lunar Reconnaissance Orbiter. Certainly nothing built by humans. Few deep space missions have delivered as much return on their investment. The sheer volume of data returned by LRO exceeds all deep space missions ever launched combined, several times over [NASA/GSFC/SVS].


THE SECOND EXTENDED SCIENCE MISSION
FOR THE LUNAR RECONNAISSANCE ORBITER:
STATUS, SCIENCE GOALS, AND DATA DELIVERIES

Noah E. Petro and John W. Keller
NASA Goddard Space Flight Center
Solar System Exploration Division

The Lunar Reconnaissance Orbiter (LRO) has been orbiting the Moon for over five years. In that time, data from the seven instruments onboard the spacecraft have made significant advances in our understanding of the Moon and its environment. In September 2014 LRO completed its first Extended Science Mission (ESM) and began a second ESM (ESM2). 

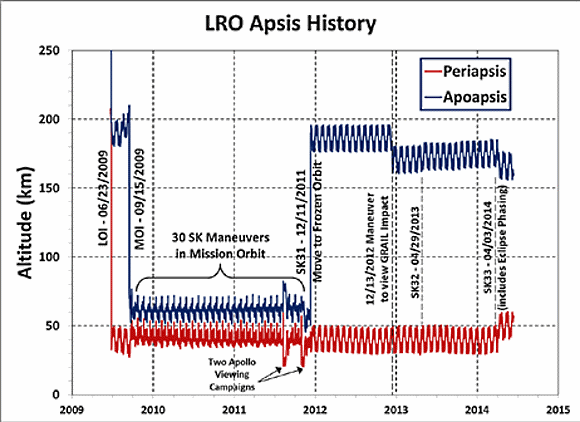
During the both ESM and ESM2, LRO has been in a quasi-stable, eccentric orbit of ~40 x 180 km with a periapse near the South Pole (Figure 1). This orbit enables high resolution measurements around the South Pole. 

The LRO Project is considering a maneuver in early 2015 to lower the periapse in order to further improve measurements over the South Pole, particularly by the LOLA instrument. Based on the current annual consumption of fuel, the spacecraft could remain in its current orbit for at least 7 more years.

FIGURE 1. Orbital history of LRO since arriving at the Moon in 2009. LRO now employs yearly station keeping (SK) maneuvers in order to maintain its orbit. There are also periodic momentum unload burns that use small quantities of fuel.
LRO Operations: As part of the approval for continued operations, LRO was directed by NASA HQ to terminate operations of the Mini-RF instrument. All of LRO’s remaining six instruments are operating nominally, and have experienced no significant degradation since beginning the ESM over two years ago.

During extended operations the LRO spacecraft has performed exceptionally well, with 98.4% uptime during the life of the mission. LRO retains sufficient fuel quantities so that its current orbit could be maintained for at least 8 years, if not longer.

LRO Science In ESM2: An overarching theme of ESM2 for LRO is that of change. A number of measurements have shown changes to the lunar surface and to its environment. LRO will focus on the five following themes that each build on prior observations from LRO, LADEE, GRAIL, and the Moon Mineralogy Mapper. Each theme has numerous questions that are address, an example few are given here.
  1. Transport of Volatiles. How are volatile elements and compounds distributed, transported, and sequestered?
  2. Contemporary Surface Change. What causes changes in the flux and intensities of meteoroid impacts onto terrestrial planets.
  3. Regolith Evolution. Characterize planetary surfaces to understand how they are modified by geologic processes.
  4. Probing the Interior from Observations of the Surface. Characterize planetary interiors to understand how they differentiate and evolve from their initial state
  5. Interactions with the Space Environment.  How is surface material modified exogenically? How do exospheres form, evolve, and interact with the space environment?
LRO Data: The LRO instrument teams will continue to deliver data to the PDS every three months. As of the beginning of 2015 over 575 Tb of data have been placed into the PDS [1]. This data volume contains a range of products, including higher level maps, mosaics, and derived products. The PDS has made available the Lunar Orbital Data Explorer [2], a mapbased tool to search for finding and downloading PDS science data of LRO as well as other recent lunar missions.

In addition to the PDS holdings, several of the LRO instrument teams have additional products and tools available on their websites (Table 1).

Several global map products have recently been added to the PDS, here we highlight a few that are new in the last year. The Mini-RF team has assembled a global mosaic of their monostatic measurements [3].

For the first time we have global radar data for the Moon, data that clearly shows variations in rock abundance and surface texture over both the near and farside (Figure 2).

FIGURE 2. Mini-RF global mosaic of the Circular Polarization Ratio (CPR), one of the number of Mini-RF mosaic products now available online.
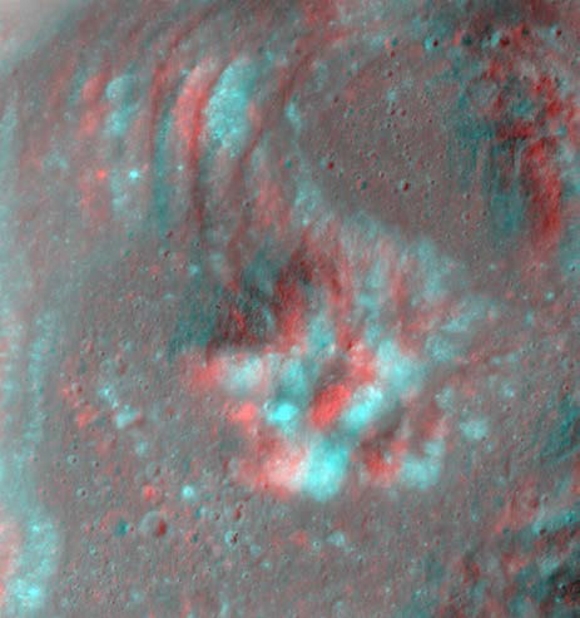
The LROC team regularly adds new products to the PDS via the team webpage (Table 1), including shapefiles, global mosaics, NAC-derived DEM’s, and NAC mosaics of selected targets. Recently the LROC team has made available a number of anaglyphs (Figure 3) showcasing the ability of the LRO spacecraft and the LROC team to precisely target the NACs.

FIGURE 3. Red-Blue anaglyph of the central peak of Euler crater.  The LROC team has made a number of anaglyphs available on their website (Table 1).
The LAMP team has a number of polar products available, including FUV ratio maps of both poles (Figure 4). These following maps are available at a resolution of 240 meters per pixel; Lyman-α (119.57–125.57 nm), Long (130–190 nm), On-band (130–155 nm), Off-band (155–190 nm), H2O Absorption Feature Depth Maps made by a Ratio map of on/off band.

FIGURE 4. LAMP Lyman-α map of the South Pole. LRO has focused on volatiles at the South Pole since arriving at the Moon 5+ years ago.
Table 1. LRO teams and their websites

LRO Project

Outreach

CRaTER

Diviner

LAMP

LEND

LOLA

LROC

Mini-RF

Use LRO Data!

The LRO Project has begun holding a series of data users workshops with the goal of helping the community work with the large volume of LRO data. Presentations given at the workshops are archived at the LRO website [4]. Questions regarding the access and use of LRO data can be directed to the authors of this abstract.

References:  [1] LRO PDS Archive, (http://pdsgeosciences.wustl.edu/missions/lro/).
[2] Lunar Orbital Data Explorer, (http://ode.rsl.wustl.edu/moon/).
[3] Cahill, J. T. S., et al., (2014) Icarus, 243, 173-190.
[4] LRO Data Resources, (http://lunar.gsfc.nasa.gov/resources.html).

Thursday, August 7, 2014

Dark Halo "Patch" west of Neper D

A roughly 470 meter wide, 560 meter long, unusually large and cohesive fan of dark halo ejecta from an unnamed but freshly prominent crater in the Neper group, southwest of Mare Marginis. 1020 meter-wide field of view from LROC NAC observation M1136029635L, LRO orbit 19510, October 10, 2013; 32.5° incidence, resolution 1.17 meters from 116.96 km over 8.73°N, 79.36°E [NASA/GSFC/Arizona State University].
Hiroyuki Sato
LROC News System

Today's Featured Image highlights an odd shape, or texture in impact ejecta. An unnamed, approximately 600 meter-wide fresh crater on a relatively high, far older crater rim, between Mare Marginis and Mare Undarum (9.5122°N, 79.40242°E) hosts teardrop-shaped low reflectance patches in its ejecta, northwest of the crater,

The larger teardrop patch in the opening picture has a sharp boundary along its western edge, perhaps implying a partially elevated surface relative to the surrounding high-reflectance ejecta.

4 km-wide field of view from LROC NAC observation M1136029635L, October 10, 2013 [NASA/GSFC/Arizona State University].
Note the faint high-reflectance ray overlying this patch, indicating that the low reflectance patch was emplaced before the completion of the impact event. Similar dark patches that are smaller and less pronounced are found at the top of the opening image.

How were these peculiar dark patches formed? If these patches are elevated, they could represent preexisting flat dark mounds that were swept by the saltating ejecta materials. Or the excavation of low-reflectance materials by the impact could have been thrown out in one direction and resulting in this unusual patch of ground. If, on the other hand, the patches are topographic lows rather than elevated, these depressions could have simply been shielded as the ejecta passed overhead. It is also possible that the topography of the rim controlled the direction of the outthrown ejecta such that there were "no ejecta" zones that resulted in the dark patches.

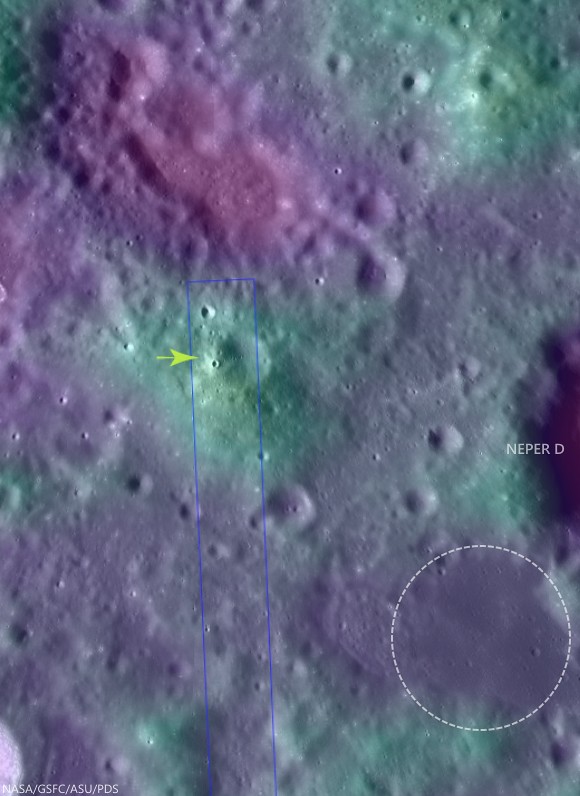
Fifty kilometer-wide field of view of the complex terrain southwest of Mare Marginis, west of Neper and Neper D. The unusually cohesive "fan" of apparent dark halo material from the unnamed relatively fresh 600 meter crater is marked at 9.5122°N, 79.40242°E (arrow) and may indicate the presence of now-buried optically mature material widely distributed in the area. The circle southwest of Neper D is a patch of isolated mare material bright in Clementine iron oxide surveys, often indicative of cryptomare.  Crater counts might eventually determine whether its age and whether or not this area is consistent with Mare Marginis or ejecta from the Crisium impact, or something much older. LROC WAC global 100 meter mosaic over LOLA laser altimetry [NASA/GSFC/ASU/USGS].
High resolution topography would really help unravel this mystery! NAC to the rescue! The LROC targeted this area for upcoming NAC stereo pairs from which meter-scale topography will be extracted. In a few months, we will post the topography and will see if we solved the mystery!

Explore this peculiar dark patch and surrounding terrain in the following full NAC frame, HERE.

Related Posts:

Tuesday, March 18, 2014

681 Gigapixel LROC mosaic

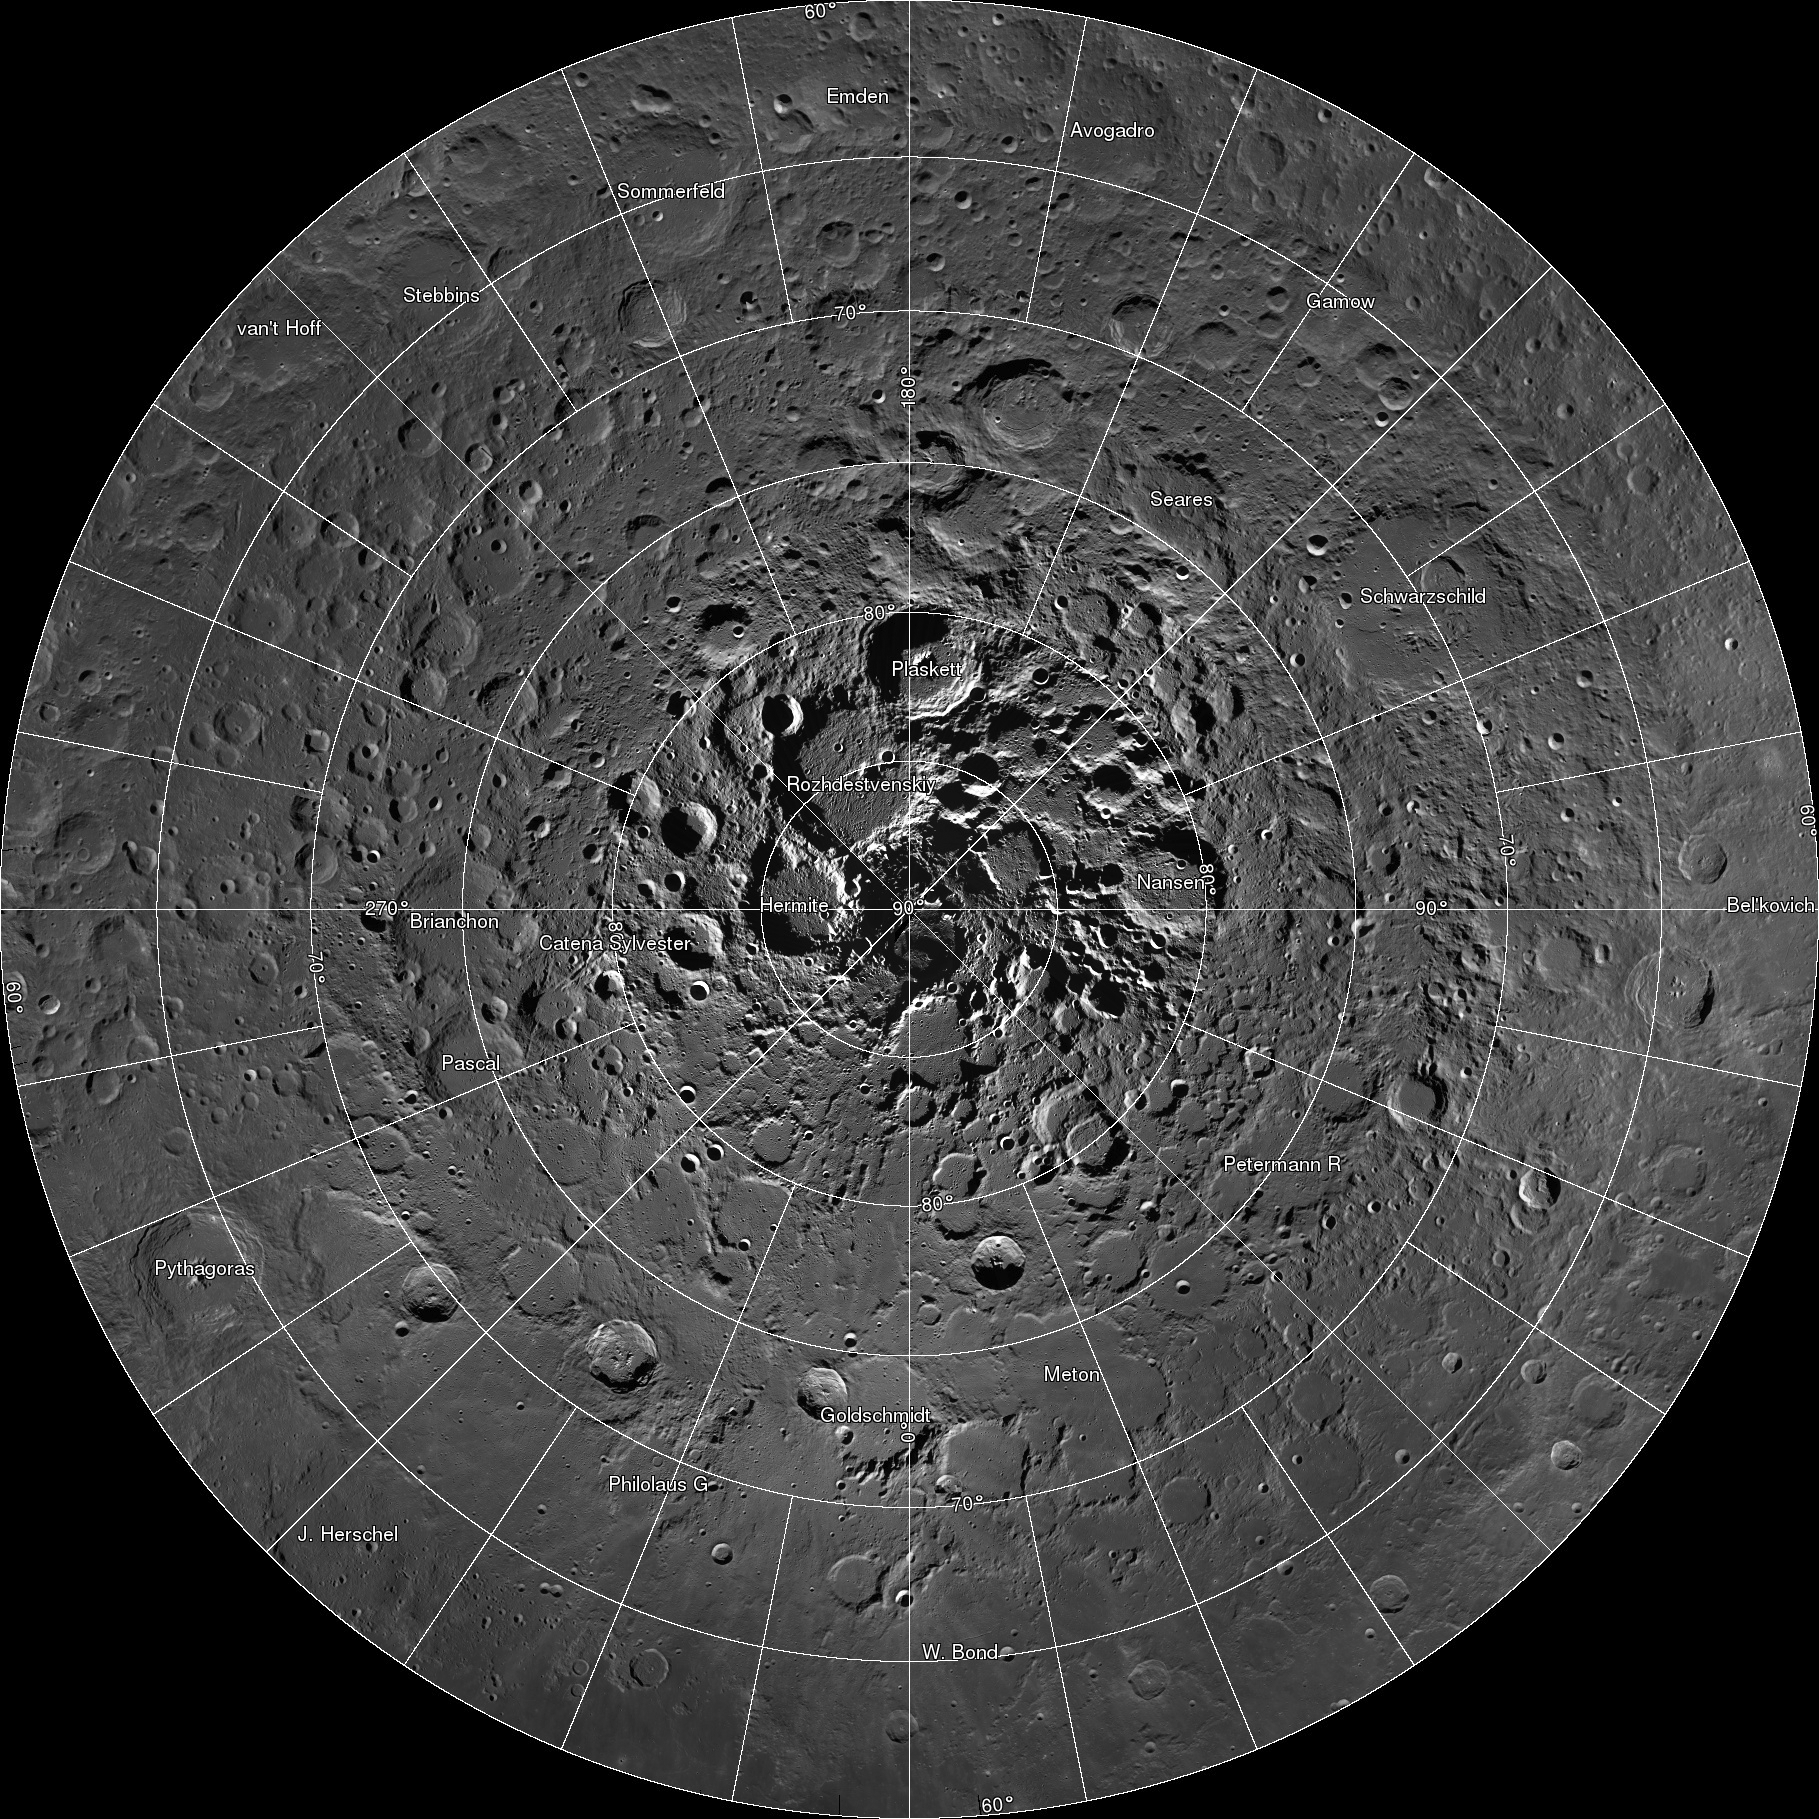
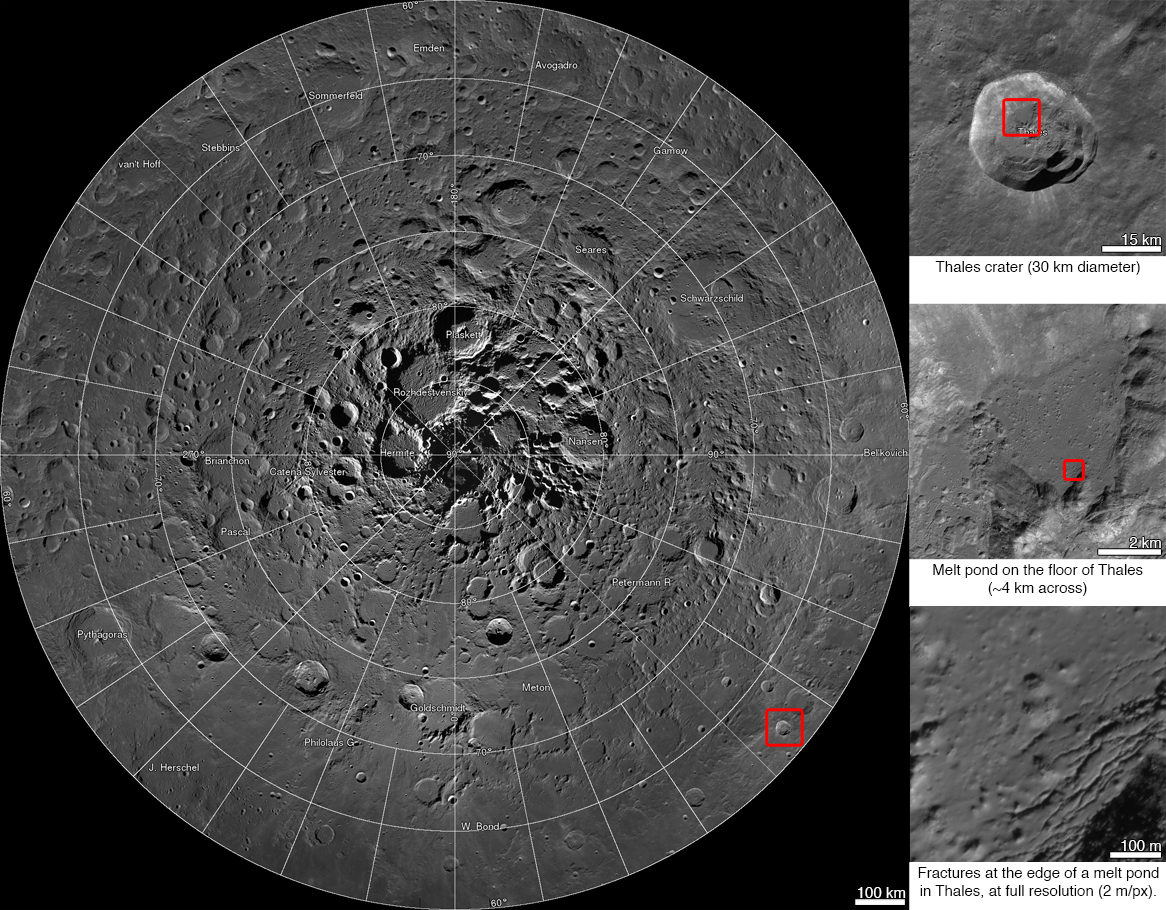
Spectacular LROC Northern Polar Mosaic (LNPM) allows exploration from 60°N up to the pole at the astounding pixel scale of 2 meters [NASA/GSFC/Arizona State University].
Mark Robinson
Principal Investigator
Lunar Reconnaissance Orbiter Camera
Arizona State University

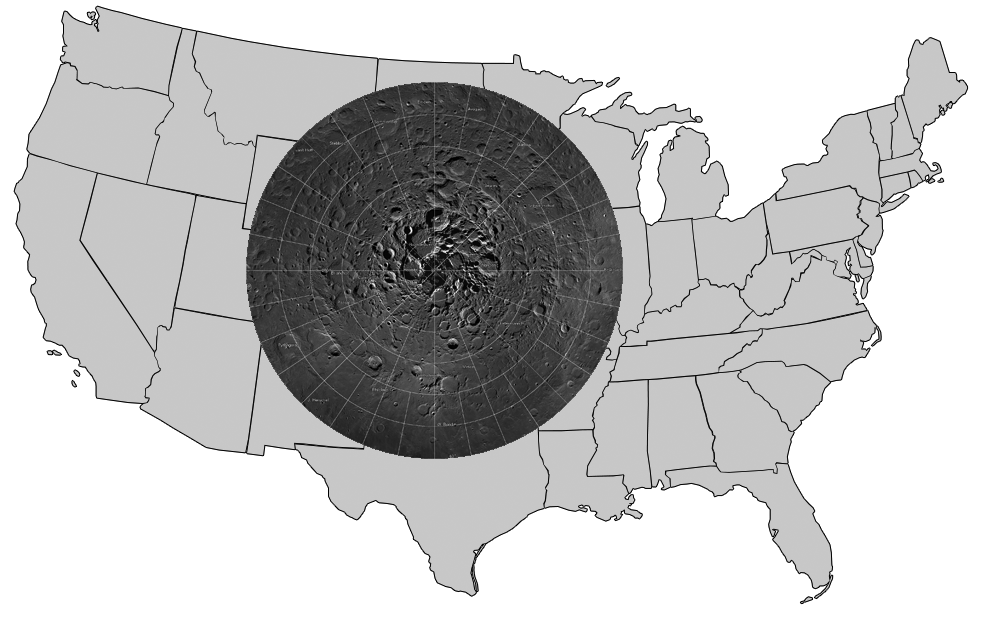
The LROC team assembled 10,581 NAC images, collected over 4 years, into a spectacular northern polar mosaic. The LROC Northern Polar Mosaic (LNPM) is likely one of the world’s largest image mosaics in existence, or at least publicly available on the web, with over 680 gigapixels of valid image data covering a region (2.54 million km2, 0.98 million miles2) slightly larger than the combined area of Alaska (1.72 million km2) and Texas (0.70 million km2) -- at a resolution of 2 meters per pixel! To create the mosaic, each LROC NAC image was map projected on a 30 m/pixel Lunar Orbiter Laser Altimeter (LOLA) derived Digital Terrain Model (DTM) using a software package called the Integrated Software for Imagers and Spectrometers (ISIS).

Figure 1. LNPM superposed on map of the United States.
A polar stereographic projection was used in order to limit mapping distortions when creating the 2-D map. In addition, the LROC team used improved ephemeris provide by the LOLA and GRAIL teams and an improved camera pointing model to enable accurate projection of each image in the mosaic to within 20 meters. Almost exactly 3 years ago the LROC team released a Wide Angle Camera (WAC) mosaic of the same north polar region, the pixel scale was 100 meters.

The new NAC mosaic is 50x higher resolution!

LNPM with three levels of zoom down into Thales crater [NASA/GSFC/Arizona State University].
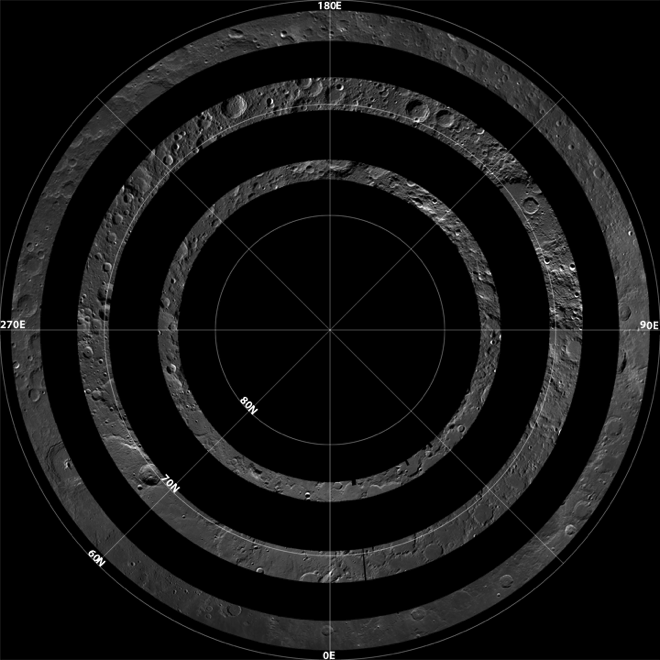
The LNPM was assembled from individual "collar" mosaics. Each collar mosaic was acquired by imaging the same latitude once every two-hour orbit for a month during which time the rotation of the Moon steadily brought every longitude into view. Each collar mosaic has very similar lighting from start to end and covers 1° to 3° of latitude.

Three collar mosaics illustrating how the images were acquired over time to build the LNPM [NASA/GSFC/Arizona State University].
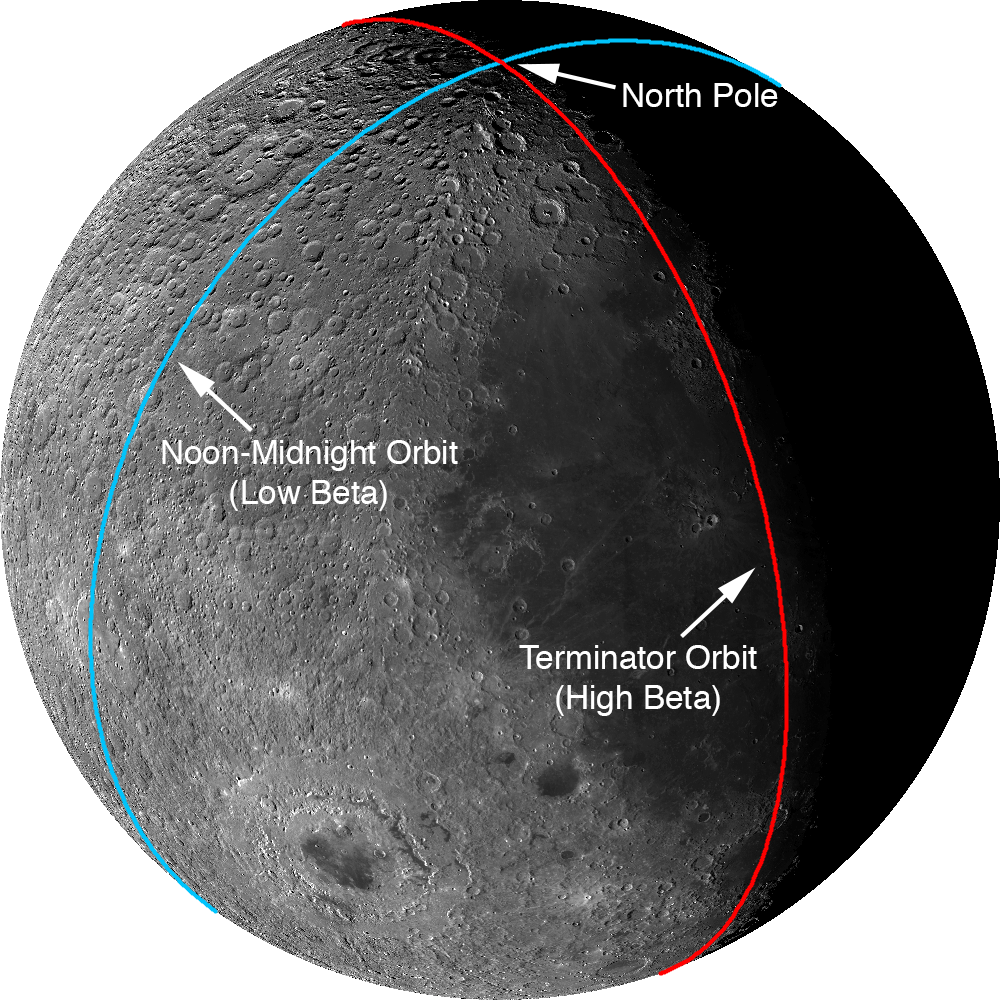
The Moon does have subtle seasons and the LRO orbit cycles between noon-midnight and terminator orbits (measured as the angle between the spacecraft orbit plane and the sub-solar longitude; known as the beta angle). Lighting at the poles is best during northern summer and when the spacecraft is in noon-midnight orbits (low beta). There are a few gaps in the collar sequences due to spacecraft anomalies and special slewed observations that point the cameras off into space. These gaps were filled with images acquired at other times in the mission. These gap-filling images sometimes have the Sun from the opposite direction of the surrounding collar, resulting in noticeable boundaries.

Two types of orbit that LRO experiences through a six-month cycle. Images acquired during terminator orbits have long shadows from the equator to the pole. For noon-midnight orbits the Sun is overhead (no shadows) at the equator and shadows, though still large, are minimized at the poles.
The LNPM was originally assembled as 841 large tiles due to the sheer volume of data: if the mosaic was processed as a single file it would have been approximately 3.3 terabytes in size! Part of the large size is due to the incredible dynamic range of the NACs. The raw images are recorded as 12-bit data (4096 grey levels) then processed to normalized reflectance (a quantitative measure of the percentage of light reflected from each spot on the ground). To preserve the subtle shading gradations of the raw images during processing the NAC images are stored as 32-bit floating-point values (millions of grey levels). The 32-bit values are four times the disk size of the finalized 8-bit (255 grey levels) representation most computers use to display greyscale images. The conversion process from 32-bit to 8-bit pixels results in saturation (group of pixels all with the maximum value of 255) in the brightest areas.

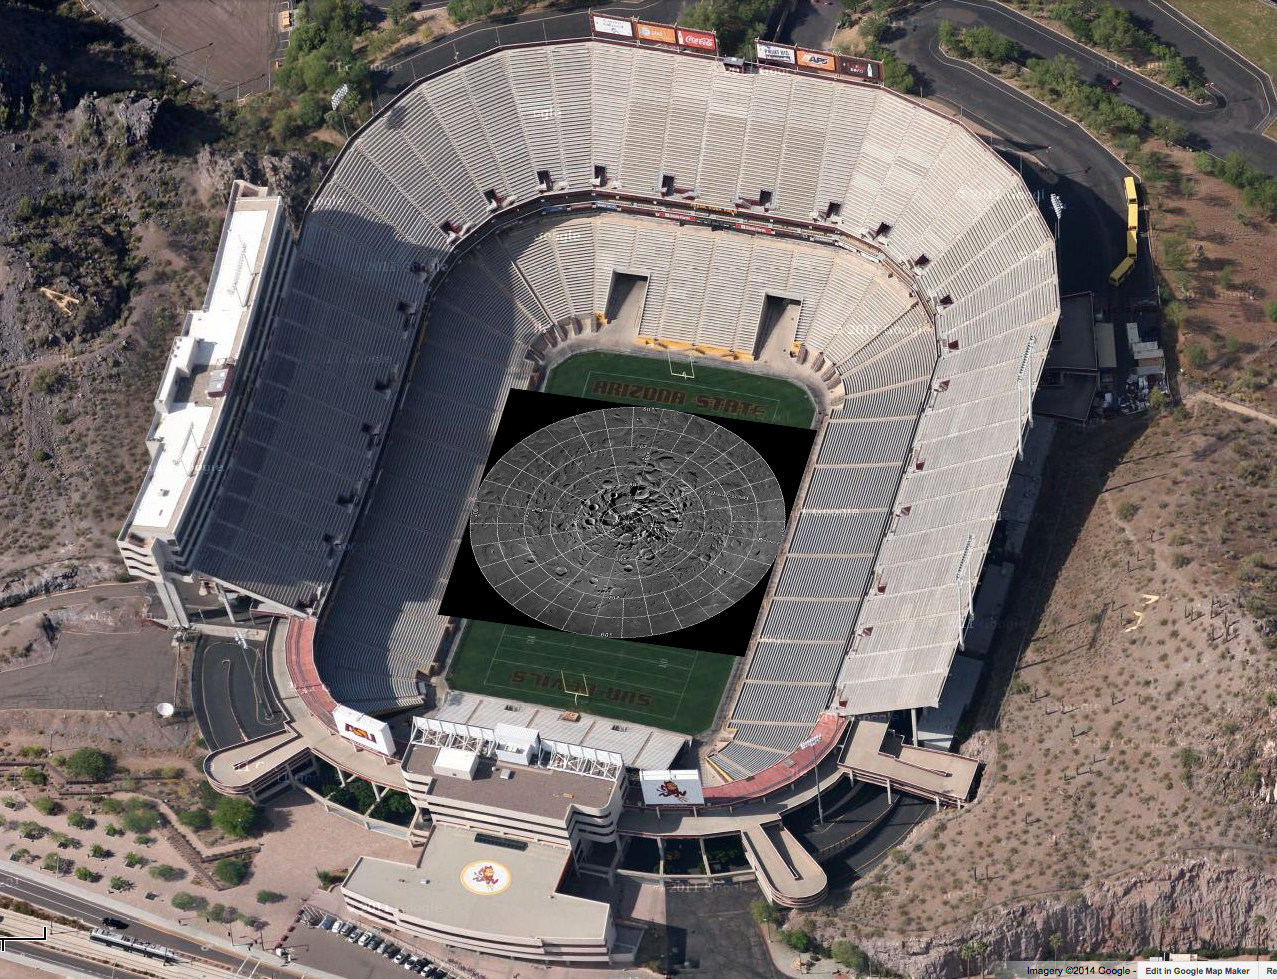
Printed at 300dpi (a high-quality printing resolution that requires you to peer very closely to distinguish pixels), the LNPM would be larger than a football field.
Even with the conversion, the compressed JPEG images that make up the final product take up almost a terabyte of disk space. To create the zooming and panning Gigapan version, multiple versions of each large tile (32,768 pixels square) were made at varying pixel scales. Next, appropriate labels and grid lines were added for each zoom level in hopes of keeping the user oriented – no sense in getting lost on the Moon! Finally these larger tiles were split into 256-pixel square images, allowing a web browser on an average network to keep up with the amazing detail (only a few tens of kilobytes are needed to see any given location at full resolution). In total the LROC NAC northern polar mosaic required 17,641,035 small tiles to produce the final product.

Dive right in HERE, and explore each of the 681 Gigapixels.

LNPM by the numbers:

Square image: 931,070 pixels across and down
Total pixels: 866,891,344,900  (867 billion)
Pixels with image data: 680,808,991,627 (681 billion)
NAC images: 10,581
Image tiles (256x256): 17,641,035 (18 million)
Mass storage of tiles: 950 Gigabytes

Acknowledgments: The LOLA team provided the high resolution topography used to map project the NAC images and improved spacecraft ephemeris that allowed accurate placement of the images on the lunar latitude longitude grid. Gigapan provided mass storage and a web interface. The United States Geological Survey Astrogeology Science Center provided the ISIS image processing software. The NASA LRO project collected the data and funded the processing effort. The LROC imaging suite was developed and built by Malin Space Science Systems (MSSS).

Tuesday, December 10, 2013

2014 lunar phase and libration video


NASA Goddard (SVS) - The Lunar Reconnaissance Orbiter (LRO) has been in orbit around the Moon since the summer of 2009. Its laser altimeter (LOLA) and camera (LROC) are recording the rugged, airless lunar terrain in exceptional detail, making it possible to visualize the Moon with unprecedented fidelity. This is especially evident in the long shadows cast near the terminator, or day-night line. The pummeled, craggy landscape thrown into high relief at the terminator would be impossible to recreate in the computer without global terrain maps like those from LRO.

The Moon always keeps the same face to us, but not exactly the same face. Because of the tilt and shape of its orbit, we see the Moon from slightly different angles over the course of a month. When a month is compressed into 24 seconds, as it is in this animation, our changing view of the Moon makes it look like it's wobbling. This wobble is called libration.

The word comes from the Latin for "balance scale" (as does the name of the zodiac constellation Libra) and refers to the way such a scale tips up and down on alternating sides. The sub-Earth point gives the amount of libration in longitude and latitude. The sub-Earth point is also the apparent center of the Moon's disk and the location on the Moon where the Earth is directly overhead.

The Moon is subject to other motions as well. It appears to roll back and forth around the sub-Earth point. The roll angle is given by the position angle of the axis, which is the angle of the Moon's north pole relative to celestial north. The Moon also approaches and recedes from us, appearing to grow and shrink. The two extremes, called perigee (near) and apogee (far), differ by more than 10%.

The most noticed monthly variation in the Moon's appearance is the cycle of phases, caused by the changing angle of the Sun as the Moon orbits the Earth. The cycle begins with the waxing (growing) crescent Moon visible in the west just after sunset. By first quarter, the Moon is high in the sky at sunset and sets around midnight. The full Moon rises at sunset and is high in the sky at midnight. The third quarter Moon is often surprisingly conspicuous in the daylit western sky long after sunrise.

Celestial north is up in these images, corresponding to the view from the northern hemisphere. The descriptions of the print resolution stills also assume a northern hemisphere orientation.

This video is public domain and can be downloaded at: http://svs.gsfc.nasa.gov/goto?4118

Wednesday, April 10, 2013

John Moore's "Watered Moon"


John Moore has a new video quite different than what we've posted of his work previously. About the video above he recommends:
"Several theories abound as to the Moon's formation. One in particular is 'The Giant Impact Theory', which suggests a Mars-sized object struck our proto-Earth, and ejected vast amounts of material that later accreted to form the Moon. The two worlds developed quite differently over time -- one sustaining [life as we know it], the other a barren landscape completely indifferent to our natural needs. Central to formation of life on Earth was water, which fueled the diversity of life at every level. For the Moon, however, it wasn't to be so. But what if the conditions were just right, and water could sustain on the lunar surface, what then would have been the outcome? Let's see..."
Without unnecessary delay, we'll include the following additional work by John, though it deserves its own post with explanatory illustrations. It deserves its own Poster. As it is, we include links to earlier related posts since these two extremities of lunar elevation, first identified by Japan's Kaguya investigators and refined by American teams using data from LRO, have been of particular interest here.


Related Posts:
Oblique views of the Moon's highest and lowest places (October 3, 2012)
View from Vavilov (January 31, 2012)
DLR: Flying over the three-dimensional Moon (December 1, 2011)
LROC's new Global Lunar Topography (November 16, 2011)
LOLA's deep Antoniadi (April 16, 2011)
LRO's unprecedented topography of the Moon (December 17, 2010)
Highest point on the Moon (October 26, 2010)
The deepest spot on the Moon nearly wasn't (September 17, 2010)
Lunar superlatives from LROC WAC (September 6, 2010)
The Moon's lowest of the  low (November 24, 2009)
Accurate topographic map of the Moon (June 13, 2009)
Spectacular refinements to Kaguya laser altimetry (May 28, 2009)
Best lunar topography derived from Kaguya (February 12, 2009)

Thursday, March 7, 2013

The Moon's Permanently Shadowed Regions


New video presentation from NASA-Space Visualization Studio (SVS) at Goddard Space Flight Center (GSFC) combines data from instruments on-board Lunar Reconnaissance Orbiter (LRO) to demonstrate the dynamics of the Moon's permanently shadowed regions (PSRs).

Details: LRO peers into Permanent Shadows (SVS)

Wednesday, February 6, 2013

Future Moon: 'Working the Crater"


Another excellent, very useful and imaginative virtual diorama by John Moore, created using the Lunar Reconnaissance Orbiter laser altimeter (LOLA) digital elevation model (DTM) and both LROC NAC and WAC photography.

Having impacted upon the eastern rim of lunar crater Virtanen (15.66°N, 176.72°E) - a Constellation program 'Region Of Interest' - a possible site for further exploration of the Moon), this small, unnamed 12-kilometre-sized crater holds some wonderful geological features for scientists and geologists to explore.

Some of these features are still not well understood, so setting up bases in and around such craters will lead to profound discoveries regarding how they formed and developed over time - from initial impact to final settlement.

Directly Related:
Lunar Landslides! (October 15, 2011)


John Moore: Exaggerating the elevation (October 17, 2012)
LROC: The Rays of Messier A (April 6, 2012) John Moore DTM-based survey included.

Saturday, September 1, 2012

Mini-RF adds to evidence of ice on Shackleton walls

LRO Mini-RF instrument radar data indicate the walls of Shackleton crater may, indeed, hold ice, confirming exacting measurements of laser altimeter (LOLA) point brightness studies revealed in June. Actual observations (CPR) are compared to calculated radar values for 0.5% to 10% ice [NASA ].
Scientists using the Mini-RF radar on NASA's Lunar Reconnaissance Orbiter (LRO) have estimated the maximum amount of ice likely to be found inside a permanently shadowed lunar crater located near the moon's South Pole. As much as five to ten percent of material, by weight, could be patchy ice, according to the team of researchers led by Bradley Thomson at Boston University's Center for Remote Sensing, in Mass.

"These terrific results from the Mini-RF team contribute to the evolving story of water on the moon," says LRO's deputy project scientist, John Keller of NASA's Goddard Space Flight Center in Greenbelt, Md. "Several of the instruments on LRO have made unique contributions to this story, but only the radar penetrates beneath the surface to look for signatures of blocky ice deposits."

These are the first orbital radar measurements of Shackleton crater, a high-priority target for future exploration. The observations indicate an enhanced radar polarization signature, which is consistent with the presence of small amounts of ice in the rough inner wall slopes of the crater. Thomson and his colleagues reported the findings in a paper recently published in the journal Geophysical Research Letters.

"The interior of this crater lies in permanent shadow and is a 'cold trap'—a place cold enough to permit ice to accumulate," says Mini-RF's principal investigator, Ben Bussey of the Johns Hopkins University Applied Physics Laboratory in Laurel, Md. "The radar results are consistent with the interior of Shackleton containing a few percent ice mixed into the dry lunar soil."

Ice Station Zebra - an otherwise unofficially named small crater with a permanently shadowed interior not far from the Moon's north pole, within the crater Rozhdestvenskiy. Circular Polarization Ratio (CPR) values mapped using the Mini-RF radar instrument released in 2010 all but confirmed the presence of vast hectares of water ice, together with confirmation of a hydrogen signature at Goldschmidt, a lower center [NASA].
These findings support the long-recognized possibility that areas of permanent shadow inside polar impact craters are sites of the potential accumulation of water. Numerous lines of evidence from recent spacecraft observations have revised the view that the lunar surface is a completely dry, inhospitable landscape. Thin films of water and hydroxyl have been detected across the lunar surface using several space-borne near-infrared spectrometers. Additionally, orbital neutron measurements indicate elevated levels of near‐surface hydrogen in the polar regions; if in the form of water, this hydrogen would represent an average ice concentration of about 1.5% by weight in the polar regions.

The Shackleton findings are also consistent with those of the recent LCROSS spacecraft's controlled collision with a nearby permanently shadowed polar region near the lunar South Pole, which revealed evidence for water in the plume kicked up by its impact. A radar instrument flown on India's Chandrayaan-1 spacecraft in 2009 found evidence for ice deposits in craters at the lunar North Pole. Measurements of the albedo (surface reflectance) inside Shackleton crater using LRO's laser altimeter and far‐ultraviolet detector are also consistent with the presence of a small amount of ice.

"Inside the crater, we don't see evidence for glaciers like on Earth," says Thomson. "Glacial ice has a whopping radar signal, and these measurements reveal a much weaker signal consistent with rugged terrain and limited ice."

The radar measurements of Shackleton crater were made during three separate observations between December 2009 and June 2010. Radar illuminates shadowed regions and can detect deposits of water or ice, which have a distinctive radar polarization signature compared to the surrounding material. In addition, radar penetrates the terrain to depths of a meter or two and can measure water or ice buried beneath the surface. Radar measurements of Shackleton crater place an upper bound on the ice content of the uppermost meter of loose material of the crater's walls at between five and ten percent ice by weight.

"We are following up these tantalizing results with additional observations," says Bussey. "Mini-RF is currently acquiring new bistatic radar images of the moon using a signal transmitted by the Arecibo radio telescope in Puerto Rico. These bistatic images will help us distinguish between surface roughness and ice, providing further unique insights into the locations of volatile deposits."

LROC Wide Angle Camera (WAC) Digital Terrain Model (DTM) of the Moon's southern polar region. It's long been hoped that Shackleton, at lower center, might harbor water ice because of its location under every pass by spacecraft in a polar orbit. A strong safety concern for astronaut crews in emergency situation [NASA/DLR/GSFC/Arizona State University].
Related Posts:
Shackleton harbors ice after all (June 12, 2012)
1000 Day Anniversary of LROC Imaging (March 27, 2012)
Shackleton on a Summer's Day (March 26, 2012)
Shadowed fluffy lunar frost detected in starlight (January 14, 2012)
Shackleton: Out of the Shadows (September 17, 2009)


The Mini-RF instrument, operated at the Johns Hopkins Applied Physics Laboratory in Laurel, Md., is one of seven instruments on board NASA's LRO spacecraft. NASA Goddard developed and manages the LRO mission. LRO's current Science Mission is implemented for NASA's Science Mission Directorate. NASA's Exploration Systems Mission Directorate sponsored LRO's initial one-year Exploration Mission that concluded in September 2010.

Friday, August 31, 2012

"From the Earth to the Moon"

Still capture from "From the Earth to the Moon," produced by David Kring, CLSE, NLSI, LPSI.
I have often argued that the Moon is the best and most accessible place in the solar system for robotic and human assets to address fundamentally important scientific questions while simultaneously providing an opportunity to expand our technological capabilities. 

To remind ourselves of the opportunities on the Moon, the Center for Lunar Science and Exploration team has created a brief (3 minute) video with scenes so dramatic you may find yourself reaching out to pick up a rock and becoming restless for a chance to walk among lunar peaks.

The video and soundtrack "From the Earth to the Moon"
(http://www.lpi.usra.edu/nlsi/moonVideo/)

*       Provides an inspirational view of the lunar surface, which humans have not visited since 1972, despite being the best and most accessible place in the solar system to explore the fundamental principles of our origins;
*       Highlights vast portions of the lunar surface that have yet to be explored; and
*       Demonstrates how new images are revealing dramatic details of future landing sites suitable for both robotic and human missions.

I encourage you to download the HD version of the video (from the bottom of that website - cross-linked at the bottom of this post) to fully marvel at this tour of the lunar surface.  I also note that we have intentionally produced a few scenes with a patchwork of images of different resolutions to illustrate the additional detail that LRO has provided.

David A. Kring, Ph.D.
Center for Lunar Science & Exploration

Options for download

Downloads can be streamed by clicking on the options below.  For best viewing, however, you may want to right click, save the link to your own computer, and then play the file from your computer
Quicktime (HD 1080p)
Windows Media
(HD 720p)
iPhone 3gs/iPod video

iPhone 4/iPad

Thursday, June 21, 2012

Shackleton harbors ice after all

Spoke too soon! When JAXA released this Kaguya Terrain Camera image, showing the deep interior of Shackleton crater for the first time in 2008, scientists claimed it disappointingly showed no indication of ice, though no one yet can say how a slurry of lunar volatiles might appear. Now, however, researchers analyzing laser altimetry returned by the LOLA instrument on-board the Lunar Reconnaissance Orbiter (LRO) cite strong evidence of ice content in the permanently shadowed interior.  The Moon's south pole is serendipitously situated on Shackleton's rim, directly under all of LRO's nearly twenty thousand polar orbits since 2009, affording extraordinary study [JAXA/SELENE]..
Jennifer Chu

If humans are ever to inhabit the moon, the lunar poles may well be the location of choice: Because of the small tilt of the lunar spin axis, the poles contain regions of near-permanent sunlight, needed for power, and regions of near-permanent darkness containing ice — both of which would be essential resources for any lunar colony.

The area around the moon’s Shackleton crater could be a prime site. Scientists have long thought that the crater — whose interior is a permanently sunless abyss — may contain reservoirs of frozen water. But inconsistent observations over the decades have cast doubt on whether ice might indeed exist in the shadowy depths of the crater, which sits at the moon’s south pole.

Now scientists from MIT, Brown University, NASA’s Goddard Space Flight Center and other institutions have mapped Shackleton crater with unprecedented detail, finding possible evidence for small amounts of ice on the crater’s floor. Using (the LOLA) laser altimeter on the Lunar Reconnaissance Orbiter (LRO) spacecraft, the team essentially illuminated the crater’s interior with laser light, measuring its albedo, or natural reflectance. The scientists found that the crater’s floor is in fact brighter than that of other nearby craters — an observation consistent with the presence of ice, which the team calculates may make up 22 percent of the material within a micron-thick layer on the crater’s floor.
 

The group published its findings today in the journal Nature.

In addition to the possible evidence of ice, the group’s map of Shackleton reveals a “remarkably preserved” crater that has remained relatively unscathed since its formation more than three billion years ago. The crater’s floor is itself pocked with several smaller craters, which may have formed as part of the collision that created Shackleton.

The crater, named after the Antarctic explorer Ernest Shackleton, is more than 12 miles wide and two miles deep — about as deep as Earth’s oceans. Maria Zuber, the team’s lead investigator and the E.A. Griswold Professor of Geophysics in MIT’s Department of Earth, Atmospheric and Planetary Sciences, describes the crater’s interior as “extremely rugged … It would not be easy to crawl around in there.”

Mapping the dark. Slipping past the Moon's south pole on the brightly lit rim of Shackleton crater, the dark of the permanently shadowed interior of the crater quickly overtakes a very steep crater wall, like the terrestrial oceans. LRO has skipped through thousands of polar orbits eventually carrying the vehicle over every area on the Moon's surface and over Shackleton, high at the top of everyone's list of priority targets, during every orbit,   LROC Narrow Angle Camera (NAC) M142464150L, LRO orbit 6128, October 23, 2010, 89.21° angle of incidence, 0.87 meters resolution from 41.91 kilometers [NASA/GSFC/Arizona State University].
The group was able to map the crater’s elevations and brightness in extreme detail, thanks in part to the LRO’s path: The spacecraft orbits the moon from pole to pole as the moon rotates underneath. With each orbit, the LRO’s laser altimeter maps a different slice of the moon, with each slice containing measurements of both poles. The upshot is that any terrain at the poles — Shackleton crater in particular — is densely recorded. Zuber and her colleagues took advantage of the spacecraft’s orbit to obtain more than 5 million measurements of the polar crater from more than 5,000 orbital tracks.

“We decided we would study the living daylights out of this crater,” Zuber says. “From the incredible density of observations we were able to make an extremely detailed topographic map.”

The team used the (LOLA) to map the crater’s elevations based on the time it took for laser light to bounce back from the moon’s surface: The longer it took, the lower the terrain’s elevation. Through these measurements, the group mapped the crater’s floor and the slope of its walls.

A quaking theory.The researchers also used the laser altimeter to measure the crater’s brightness, sending out pulses of infrared light at a specific wavelength. The crater’s surface absorbed some light based on its own natural albedo, reflecting the rest back to the spacecraft. The researchers calculated the difference, and mapped the relative brightness throughout the crater’s floor and walls.

While the crater’s floor was relatively bright, Zuber and her colleagues observed that its walls were even brighter. The finding was at first puzzling: Scientists had thought that if ice were anywhere in a crater, it would be on the floor, where very little sunlight penetrates. The upper walls of Shackleton crater, in comparison, are occasionally illuminated, which could evaporate any ice that accumulates.

How to explain the bright walls? The team studied the measurements, and came up with a theory: Every once in a while, the moon experiences seismic shaking brought on by collisions, or gravitational tides from Earth. Such “moonquakes” may have caused Shackleton’s walls to slough off older, darker soil, revealing newer, brighter soil underneath.
Until very recently luna incongnita, the permanently shadowed 10.3 km-wide interior of Shackleton, shouldering the Moon's south pole (blue arrow), today seems much like hundreds of other lunar craters of similar age and dimension. Its ink-black interior has steadily been brightly unveiled in a steady build-up of laser data points collected over the course of three years in polar orbit by the LOLA instrument on LRO. As it is on Earth, however, in Real Estate, "location is everything" [NASA/GSFC/LOLA].

Zuber says there may be multiple explanations for the observed brightness throughout the crater: For example, newer material may be exposed along its walls, while ice may be mixed in with its floor. Her team’s ultra-high-resolution map, she says, provides strong evidence for both.

Ben Bussey, staff scientist at Johns Hopkins University’s Applied Physics Laboratory, says the group’s evidence for ice in Shackleton crater may help determine the course for future lunar missions.

“Ice in the polar regions has been sort of an enigmatic thing for some time … I think this is another piece of evidence for the possibility of ice,” Bussey says. “To truly answer the question, we’ll have to send a lunar lander, and these results will help us select where to send a lander.”

Zuber adds that the group’s topographic map will help researchers understand crater formation and study other uncharted areas of the moon.

“I will never get over the thrill when I see a new terrain for the first time,” Zuber says. “It’s that sort of motivation that causes people to explore to begin with. Of course, we’re not risking our lives like the early explorers did, but there is a great personal investment in all of this for a lot of people.”

The research was supported by the Lunar Reconnaissance Orbiter Mission under the auspices of NASA’s Exploration Systems Mission Directorate and Science Mission Directorate.

Japan's scientists may have leaped to conclusions when they over-confidently announced there was no ice inside Shackleton (upper left), after releasing the first image of the crater's interior a few years ago, but their iconic high-definition image of an orbital Earthrise from November 2007 still takes the breath away [JAXA/NHK/SELENE].

Wednesday, June 13, 2012

Second Conference on the Lunar Highlands

First Results: from Figure 2, "Preliminary results on the structure of lunar highland crust from GRAIL and LOLA altimetry," Zuber & Smith, et al, (#9015, Second Conference on the Lunar Highlands Crust, 2012) Preliminary GRAIL gravity field for the 86-km-diameter Tycho crater. Tycho is the prominent structure at upper left. In this GRAIL map reds correspond to mass excesses and blues to mass deficits. GRAIL gravity has a spatial resolution of 18 kilometers [NASA/JPL/MIT].
Clive Neal
Notre Dame

The first conference on the Lunar Highlands Crust was held in 1979. Since that seminal meeting, our knowledge of the lunar highlands has advanced enormously. Unimagined new data have become available, notably in orbital remote sensing of mineralogy, chemistry, topography, and gravity; geochronology; and geochemistry, especially isotopic constraints and the abundances and natures of lunar volatiles. These new data are paralleled by new concepts of solar system science, including the importance and timing of impact events (including the one that formed the Moon) and the nature of the early solar system disk and its dynamical instabilities. 

In light of these advances in the last 34 years, the time seems right for a synoptic reexamination of the lunar highlands crust. The Second Conference on the Lunar Highlands Crust is intended to bring members of the planetary science community together to share their specialized insights into the lunar highlands crust, exchange ideas freely, and perhaps develop new cross-disciplinary ideas and tests of those ideas.

A field trip to the Stillwater Mine will be held on Thursday, July 12, and a field trip to Picket Pin Mountain will be held on Monday, July 16 (departing Bozemanon Sunday, July 15, following the conclusion of the final oral session). More details about the field trips, along with information about registration, accommodations, transportation, and much more, are available in the final announcement.

For more information, visit the conference website, HERE.

"Preliminary results on the structure of lunar highland crust from GRAIL and LOLA altimetry," Zuber & Smith, et al, (#9015, Second Conference on the Lunar Highlands Crust, 2012)

Related: Lunar Picture of the Day (LPOD), "First Results," June 13, 2012, Charles Wood