Showing posts with label LPSCXLVI. Show all posts

Saturday, February 21, 2015

The search for transient frost using laser altimetry

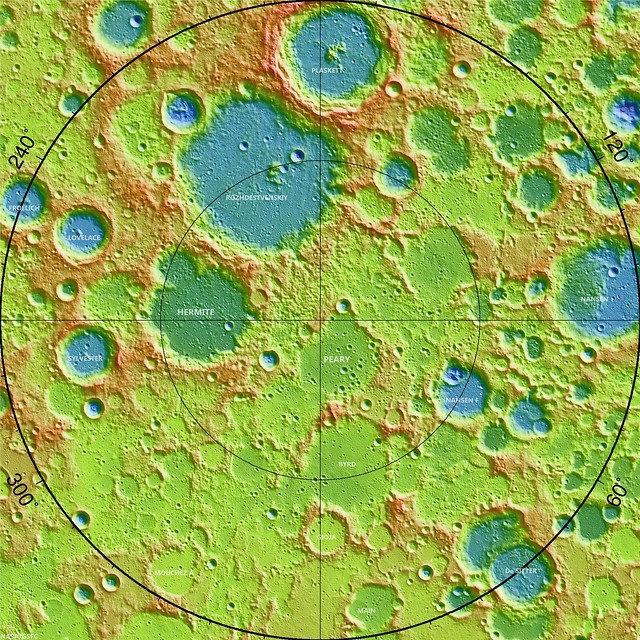
Laser altimetry map of the Moon's northern polar region, north of 80° at 20 meters resolution. The crater Lovelace (57.06 km; 82.08°N, 250.49°E), referenced below, is southwest of Hermite, where the lowest temperatures yet recorded in the Solar System have been measured on the pole-facing walls, in permanent shadow [NASA/GSFC].

A SEARCH FOR TRANSIENT WATER FROST
AT THE LUNAR POLES
USING THE LUNAR ORBITER LASER ALTIMETER

M. Lemelin, et.al.
University of Hawaii at Manoa


Introduction: The possibility of lunar polar ice was suggested by Harold Urey in the 1950's [1], and has likely been directly detected at the North Pole of Mercury by MESSENGER. That detection was based on the presence of reflectance anomalies seen by the Mercury Laser Altimeter (MLA) that occurred only where models of the surface temperature allow long-duration preservation of surface water ice against sublimation [2,3].

Anomalous reflectance is also seen at the lunar poles, revealed by laser measurements. The reflectance of permanently shadowed regions is systematically higher than nearby areas that receive at least some illumination [2,3,4] (Fig. 1). Models suggest that if the higher reflectance is due to the presence of water ice; up to 14 wt.% could be present depending on the distribution of frost within or on the regolith.

Figure 1. DIVINER maximum temperature (left) and LOLA reflectance (right) for the north polar crater Lovelace. The blue patch in the temperature image shows the location of a permanently shadowed region. The corresponding location in the reflectance image clearly show higher reflectance than the surroundings
Results of lunar observations by the Deep Impact High-Resolution Instrument – Infrared spectrometer (HRI-IR) in the 3 μm region and by the Lunar Reconnaissance Orbiter (LRO) Lyman Alpha mapping project (LAMP) in the far-UV region both show that spectral features consistent with hydration of the surface are diurnally variable. This indicates that water is pos-sibly mobile on the lunar surface [5,6]. Because the lifetime of water molecules in the lunar atmosphere is short against dissociation (~20 hours) compared to the lunar diurnal cycle, water must be continuously pro-duced to account for the observations. Mobile water will trap on cold surfaces during the lunar night and be released when surfaces are illuminated during the day.

In this study, we seek evidence for transient water frost on the polar surfaces using reflectance data from the Lunar Orbiter Laser Altimeter (LOLA), and temperature data from the DIVINER radiometer, both onboard the LRO. We aim to search for areas that may “load” with surface frost during the night causing in-creased reflectance, and unload during the day reducing the reflectance. Detection of transient surface frost constrains the rate of input into the lunar volatile system.

Methods and datasets: LOLA measures the backscattered energy of the returning altimetric laser pulse at 1064 nm. This data is used to map the reflectivity of the Moon at zero-phase angle with a photo-metrically uniform data set. The zero-phase geometry is insensitive to lunar topography and enables the characterization of subtle variations in lunar albedo, even at high latitudes where such measurements are not possible with the Sun as the illumination source. The DIVINER radiometer simultaneously measures the bolometric temperature of the lunar surface.

To find evidence of transient surface frost, we examined locations where reflectance data from LOLA exists at both low (less than 156 K, a loss of 100 μm of frost per month or less, sufficiently cold for ice to persist during a single lunar night [7,8]) and high temperatures (greater than 201 K, a loss of 1 mm of frost per month or more, no possibility of retaining surface ice [7,8]) using the DIVINER radiometer data, seeking changes in albedo with temperature. We search the LOLA reflectance dataset for locations that have reflectances measured at both low and high temperatures using DIVINER tem-perature measurements obtained simultaneously with LOLA data. For this initial search, we examined both polar regions at a spatial resolution of 2 pixels per degree (~15 km per pixel), within ±50-90º latitude.

Initial Results: For both polar regions (±50-90º latitude), we find that most of the pixels outside permanently shadowed regions are subject to both low (less than 156 K) and high (greater than 201 K) temperatures. Figure 2 shows the LOLA reflectance data for both poles when the temperature of a given pixel is either greater than 156 K (Fig. 2 left) or greater than 201 K (Fig. 2, right).

Methods and datasets: LOLA measures the backscattered energy of the returning altimetric laser pulse at 1064 nm. This data is used to map the reflectivity of the Moon at zero-phase angle with a photo-metrically uniform data set. The zero-phase geometry is insensitive to lunar topography and enables the characterization of subtle variations in lunar albedo, even at high latitudes where such measurements are not possible with the Sun as the illumination source. The DIVINER radiometer simultaneously measures the bolometric temperature of the lunar surface.

By subtracting the 1064 nm reflectance when the temperature is high (greater than 201 K) from the reflectance when the temperature is low (below 156 K), we find that the global difference in reflectance averages near 0 for both polar regions (Fig. 3). Therefore, we do not detect a general temperature dependent reflectance variation.

Figure 2. LOLA 1064 nm reflectance for (A) the North Pole and (B) the South Pole. The reflectance when the temperature is low (less than 156°K) is shown on the left and the reflectance when the temperature is high (greater than 201°K) is shown on the right.
Figure 3. LOLA 1064 nm reflectance difference between the reflectance when the temperature is high (greater than 201° K) and when the temperature is low (less than 156° K), for (A) the North Pole and (B) the South Pole.
Discussion and future work: We did not detect a general temperature dependent reflectance variation in our study for either polar region with a detection precision of about 1%. Using a simple model of a nonabsorbing layer over an absorbing substrate, a very small optical depth is required to raise the reflectance by 1%, only 0.045 ([9] Section 9.D.2). This corresponds to ~30 μg/cm2, a layer thickness of about 300 nm. In comparison, the observations of [5,6] require a layer thickness of at least 10's of nanometer to account for the observed band depths. This suggests that our current measurements are at the edge of detection of the source implied by the spacecraft observations. In contrast to the implications of the reported measurements, the solar wind can provide far less water; concentrated in a single layer, calculations by [10] suggest only 0.01 nm globally averaged per month.

Our current analysis did not take into account how long each surface element has been subject to cold temperatures (i.e., if it had time to accumulate frost). For example, based on a Monte Carlo model, Schorghofer (2014) [11] showed that a continuous source of water molecules arriving on the lunar surface (regardless of the source) would significantly accumulate near the morning terminator. Additional calculations show that the morning terminator should feature about 30 times the concentration of the average nightside abundance, improving prospects for detection. 

Future work includes reanalyzing existing data to include the time of exposure at low temperatures, and conducting targeted observations with LOLA to observe night time polar surfaces near the morning terminator in order to improve the upper limits of detection on transient water frost.

References: [1] Urey H. C. (1952) The Planets: Their Origin and Development. Yale University Press, New Haven, CT, 245 pp. [2] Paige D. A. et al. (2013) Science, 339, 300-303. [3] Neumann G. A. et al. (2013) Science, 339, 296-299. [4] Zuber M. T. et al. (2012) Nature, 486, 378-382. [5] Sunshine J. M. et al. (2009) Science, 326, 565-568. [6] Hendrix A. R. et al. (2012) JGR Planets, 117, E12001. [7] Zhang J. A. and Paige D. A. (2009) GRL, 36, L16203. [8] Zhang J. A. and Paige D. A. (2010) GRL, 37, L03203. [9] Hapke B. (1993) Theory of reflectance and emittance spectroscopy, Cambridge. [10] Hurley D. M. and Farrell W. M. (2013) LPSC 44, abstract #2015. [11] Schorghofer N. (2014) GRL, 41, 4888–4893.

Acknowledgments: This work is supported in part by the LRO LOLA experiment (David Smith PI), the LRO Diviner experiment (David Paige PI), and the Natural Science and Engineering Council of Canada (NSERC).

CRaTER: Lunar Proton Albedo Anomalies

Figure 1. Top: Lunar albedo proton yield map (cylindrical projection) with anomalous yield regions labeled “A” through “E”. Regions A (Mare Serenitatis) and B (Oceanus Procellarum) are both centered near the boundaries of mare regions. Regions C, D and E are all in the highlands on the far side of the Moon. Bottom: Visible global composite image from the Lunar Reconnaissance Orbiter Camera (LROC).

LUNAR PROTON ALBEDO ANOMALIES:
SOIL, SURVEYORS, AND STATISTICS

J.K. Wilson, N. Schwadron and H. E. Spence, et al.
Space Science Center
University of New Hampshire, Durham

Introduction: Since the launch of the Lunar Reconnaissance Orbiter (LRO) in 2009, the Cosmic Ray Telescope for the Effects of Radiation (CRaTER) has been mapping albedo protons (~100 MeV) coming from the Moon [1,2].

These protons are produced by nuclear spallation, a consequence of galactic cosmic ray (GCR) bombardment of the lunar regolith. Just as spalled neutrons and gamma rays reveal elemental abundances in the lunar regolith [3-6], albedo protons may be a complimentary method for mapping compositional variations across the Moon’s surface.

Albedo Proton Yield: The CRaTER instrument simultaneously detects albedo protons from the Moon and GCRs arriving from the zenith direction. We divide the number of albedo protons observed over each point on the Moon by the number of GCRs detected over the same location to produce a map of the yield of albedo protons.

We presently find that the lunar maria have an average proton yield which is 0.9% ± 0.3% higher than the average yield in the highlands; this is consistent with some neutron data that shows a similar yield dichotomy due to differences in the average atomic weight between mare regolith and highland regolith [7].

Map Features: There are cases where two or more adjacent pixels (15° × 15°) in the map have significantly anomalous yields above or below the mean.

These include two high-yielding regions in the maria, and three low-yielding regions in the far-side highlands. Some of the regions could be artifacts of Poisson noise, but for completeness we consider possible effects from compositional anomalies in the lunar regolith, including pyroclastic flows, antipodes of fresh craters, and so-called "red spots" which are associated with volcanic domes. We also consider man-made landers and crash sites that may have brought elements not normally found in the lunar regolith.

References: [1] Wilson, J. K. et al. (2012) JGR, 117, E00H23. [2] Spence, H. E. et al. (2012) Space Weather, 11, 643-650. [3] Feldman W. C. et al. (1998) Science, 281, 1496-1500. [4] Gasnault, O. et al. (2001) GRL, 28, 3797-3800. [5] Maurice, S. et al. (2004) JGR, 109, E07S04. [6] Mitrofanov, I. G. et al. (2010) Science, 330, 483-486. [7] Litvak, M. L. et al. (2012) JGR, 117, E00H22.

Sunday, February 1, 2015

LROC detects 26000 changes to lunar surface since '09

Close look at south wall of the Copernican age crater Fetchner T (14.33 km; 58.74°S, 122.82°E), a 2.3 km-wide field of view from LROC NAC observation M113148900R, LRO orbit 1808, November 18, 2009; incidence 67.98° at 64 cm resolution, from 61.71 km above 58.84°S, 122.02°E. Polar orbital tracks converge nearer together, allowing more frequent re-imaging  and opportunities to detect changes to the landscape [NASA/GSFC/Arizona State University]. 
DYNAMIC MOON REVEALED WITH HIGH RESOLUTION TEMPORAL IMAGING

46th Lunar and Planetary Science Conference, #2325
Speyerer and Robinson, Povilaitis and Wagner
School of Earth and Space Exploration
Arizona State University

Introduction: The Lunar Reconnaissance Orbiter Camera (LROC) began systematically mapping the Moon in the summer of 2009 with the goal of acquiring an image dataset to facilitate future exploration [1]. With the aid of the extended science mission, we have discovered hundreds of new impact craters, thousands of smaller probable secondaries, and evidence of recent crater modification using repeat observations with the high resolution Narrow Angle Camera (NAC) and a custom change detection program.

Temporal Dataset: As of 1 January 2015, LROC has acquired nearly a million NAC images of illuminated terrain. From this total, nearly 10,000 are images acquired of regions of the Moon where previous NAC observations with similar lighting and observational geometry exist (i.e. incidence angle difference more than 3°, incidence angle greater than 50°, and nadir pointing).

These before and after image pairs, called temporal pairs, enable the search for a range of surface changes, including new impact craters, formed between the time the first and second image were acquired; individual temporal pairs currently span between 176 to 1241 Earth days.

Change Detection: Since a single NAC temporal pair can contain up to 1.09 billion pixels, manual scanning of thousands of temporal pairs is impractical. However, 131 images were manually scanned and 657 surface changes were identified [2] providing a baseline for the automated change detection algorithm.

We developed an automated change detection program that identifies and crops out suspected changes from each temporal pair. Thumbnails of these candidate areas are extracted and manually classified using a custom web interface. Of the 46,057 automatically identified surface changes recorded to date, manual inspection confirmed that over half (56%) are indeed changes to the surface.

This semi-automated procedure reduces the human time required to inspect a temporal pair by over a factor of 200.

New Impact Craters and Secondaries: From the temporal pairs scanned to date (1 January 2015), we identified 225 new resolved impact craters (e.g. Fig. 1). These craters range in diameter from 1.5 meters to 43 meters and are distributed across the surface over a variety of terrain types (Fig. 2; red dots). In addition, targeted NAC observations imaged 18 and 34 meter diameter craters where impact flashes were observed on 17 March 2013 and 11 September 2013 respectively (Fig. 2; blue dots).

Fig. 1: Before (left) and after (right) images of a new 18 meter impact crater discovered by automatically scanning NAC temporal pairs.
We also identified nearly 26,000 other surface changes that do not exhibit visible crater rims but only a change in surface reflectance. These include high reflectance changes (i.e. increase in surface reflectance), low reflectance changes, as well as mixed reflectance changes (Fig. 3).

Fig. 2: Location of new impact craters overlaid on a LROC Wide Angle Camera basemap (Latitude Range: 55°N to 55°S, Longitude Range 180°E to 180°E). The red dots indicate the location of the 225 new impact craters discovered to date with NAC temporal pairs and the blue dots show the location of the two craters located with the help of Earthbased impact flash observations [3,4].
These changes are thought to be the result of small primary events in which the resulting impact crater is smaller than the resolution limit of the temporal pair or by a secondary disturbance caused by a nearby primary event. In several cases, these surface changes show clear directional indicators pointing back to a larger primary crater [3] confirming their origin as secondary craters.

Fig. 3: Example of low (left column) and high (right column) reflectance changes identified with NAC temporal pairs. The top row consists of a pair of before images, the middle row is a pair of after images, and the bottom row is a ratio of the after/before observation. Each image field of view is 250 meters across.
Crater Modification: Temporal pairs also revealed seven new landslide events inside Copernican age impact craters (Fig. 4). Several of these landslides are the result of small impact events occurring on steep (slopes over 30°) crater walls.

These landslides typically show boulder trails extending from the new impact crater and tracing a path toward the crater floor and occasionally growing in width as a result of the falling block dislodging material along the steep surface. One such event caused material to travel over 4 km to the floor of the larger parent crater.

In addition, we discovered new landslides that lack any indicator of emanating from a new impact crater. These landslides exhibit a much broader surface change (greater than 100 meters wide flows instead of narrow boulder tracks witnessed with the previously described landslides). We speculate that these may be the result of a seismic event such as a Moonquake or a large distant meteor impact disrupting regolith poised near the angle of repose and causing the loosened regolith to cascade down to the crater floor.

Fig. 4: Example of two temporal ratio images (after/before) showing recent landslide events. The image on the left shows a 250 meter-wide field of view, boulder trails extending down slope from a new impact crater. At right is 600 meter-wide view showing a larger landslide with no indication it results from an impact on the wall of the parent crater. In each example, the elevation depicted decreases from the top to the bottom.
Summary: As of 1 January 2015, we have scanned and classified changes in 8300 NAC temporal pairs using our automated change detection tool leading to the discovery of 225 impact craters ranging in size from 1.5 to 43 m. In addition, we also identified thousands of other surface changes, including:

- 23,458 low reflectance changes
- 1,911 high reflectance changes
- 468 mixed reflectance changes
- 1 Chinese lander/rover

Throughout the second extended science mission, the LROC team will continue to acquire and scan high resolution temporal pairs. From this new dataset we plan to refine estimates on the flux of small (less than 0.5 meter) bolides in the inner solar system as well as quantify secondary impact-related hazards on the Moon, which is not only an important scientific finding but a key engineering design concern for future long duration surface assets.

References: [1] Robinson M.S. et al. Space Science Reviews, 150, 1-4, 81-124 (2010); [2] Thompson S.D. et al., Recent impacts on the Moon, 45th Lunar and Planetary Science Conference (2014), #2769; [3] New crater on the Moon and a field of secondaries, Robinson M.S. et al. 45th LPSC, (2014) #2164; [4] http://lroc.sese.asu.edu/posts/810.