
 |
| Full hemisphere example of the newly released Lunar Reconnaissance Orbiter Camera (LROC) Wide Angle Camera (WAC) color-shaded relief of the lunar farside, derived from their global Digital Terrain Model. View the larger image accompanying their November 16 announcement, HERE [NASA/GSFC/DLR/Arizona State University]. |
Principal Investigator
Lunar Reconnaissance Orbiter Camera (LROC)
Arizona State University
Global topography -- a boon to lunar scientists and explorers around the world! Today the LROC team releases Version 1 of the Wide Angle Camera (WAC) topographic map of the Moon. This amazing map shows you the ups and downs over nearly the entire Moon, at a scale of 100 meters across the surface, and 20 meters or better vertically. Despite the diminutive size of the WAC (it fits in the palm of one's hand), it images nearly the entire Moon every month. Every month? Yes! Redundant data? No! Each month the Moon's lighting changes, so the WAC methodically builds up a record of how different rocks reflect light under different conditions, and adds to the LROC library of stereo observations. The WAC really is the little camera that could! It was built by Malin Space Science Systems (MSSS) in San Diego CA, and is very similar to another MSSS camera (MARCI) now in orbit around Mars.
 |
| Left: LROC Wide Angle Camera attached to a test setup shortly before mounting on the spacecraft. Right: WAC being handed up to engineers for integration with LRO. View the released image HERE (photos M. Robinson). |
The WAC has a pixel scale of about 75 meters, and with an average altitude of 50 km, a WAC image swath is 70 km wide across the ground-track. Because the equatorial distance between orbits is about 30 km, there is nearly complete orbit-to-orbit stereo overlap all the way around the Moon, every month. Using digital photogrammetric techniques, a terrain model was computed from this stereo overlap. The new topographic model was constructed from 69,000 WAC stereo models. Due to persistent shadows near the poles it is not possible to create a complete WAC stereo map at the very highest latitudes. Fortunately, the LRO Lunar Orbiter Laser Altimeter (LOLA) excels at characterizing the topography of the poles. Since the LRO orbits converge at the poles and LOLA ranges to the surface with its own lasers, LOLA provides a very high resolution topographic model of the poles. This LOLA map can fill in the WAC "hole at the pole".
 |
| Detail from WAC topography model, shades of gray represent elevation. Darker values are lower terrain and brighter values are higher points. (Image center is near 19.1°N, 175.3°E) View the much larger demonstration image HERE [NASA/GSFC/DLR/Arizona State University]. |
How is a digital topographic map created from stereo images? The WAC stereo images were compared one against another by pattern-matching a moving box of pixels until the best fit was found between two images with different viewing angles. Best fit pixel positions are combined with the LRO orbit position and the WAC viewing angles to define two 3D rays (lines of sight). The intersection point of these rays defines the location and the elevation of the point on the surface. Since the correlation box is bigger than 100 meters, surface details at the 100-meter scale are not fully resolved in a single stereo pair. However, each 100 meter square has an average of 26 stereo points within it (for a planet-wide total of 100 billion points), which helps to sharpen the elevation estimate. The resolution, in a formal sense, is probably close to 300 meters, and the accuracy of the elevations is estimated to be about 10 to 20 meters. This new map is called the Global Lunar DTM 100 m topographic model, or “GLD100”, and covers 79°S to 79°N latitudes, 98.2% of the entire lunar surface. The WAC topography was produced by LROC team members at the German Aerospace Center (DLR).
 |
| Color-shaded relief detail of the same region in the figure above. View the spectacularly detailed and larger release image HERE [NASA/GSFC/DLR/Arizona State University]. |
Shaded relief images can be created from the GLD100 by illuminating the surface from a given Sun direction and elevation above the horizon, and to convey an absolute sense of height the resulting grayscale pixels are painted with colors that represent the altitude. Visualizations like these allow scientists to view the surface from very different perspectives, providing a powerful tool for interpreting the geologic processes that have shaped the Moon
. |
| And the LROC WAC Global monochrome mosaic also corresponding to same area, with the accompanying larger and more detailed release image available HERE [NASA/GSFC/DLR/Arizona State University]. |
The large irregularly shaped Buys-Ballot crater, seen in the three images above, is about 47 km by 62 km. The WAC topography shows the flat floor to lie some 3100 meters below the western rim and 4600 m below the eastern rim. The central peak rises about 800 m above the floor. For comparison the width and depth of this crater are larger than those of the Grand Canyon, AZ.

Topographic profile (highly exaggerated) across Buys-Ballot crater, note the flat floor [NASA/GSFC/DLR/Arizona State University].
Why is the floor of the crater so flat? The WAC mosaic holds an important clue -- note how dark the floor is. On the Moon, dark (low albedo) material is typically basalt, which is dark because it is relatively rich in iron (mafic minerals). On the Moon, basalts are erupted as very hot lavas, making them very fluid, thus they tend to spread out and flood local topographic lows. From the topography and WAC image data, one can make a confident interpretation that the floor of this unusual crater is most likely flooded with basalt. But why such a small eruption? Most flood basalts on the nearside cover vast expanses of lunar terrain, but why not on the farside? Another mystery for future lunar explorers to unravel!
The area shown here is only a tiny portion of the Moon: see if you can find Buys-Ballot in the full resolution hemispheric view.
What improvements can be made over this first release of the LROC WAC GLD100? The current model incorporates the first year of stereo imaging, and there is another year of data that can be added to the solution. These additional stereo images will not only improve the sharpness (resolution) of the model but also fill in very small gaps that exist in the current map. The LROC team has made small improvements to the camera distortion model, and the LOLA team has improved our knowledge of the spacecraft position over time. These next generation steps will further improve the accuracy of Version 2 of the LROC GLD100 topographic model of the Moon.
Explore the new LROC GLD100!
And here are Direct links to color shaded relief visualizations (relatively large *.tif image files*):

Orthographic projection centered at 0° longitude and 0° latitude.
Orthographic projection centered at 60° longitude and 0° latitude.
Orthographic projection centered at 120° longitude and 0° latitude.
Orthographic projection centered at 180° longitude and 0° latitude.
Orthographic projection centered at 240° longitude and 0° latitude.
Orthographic projection centered at 300° longitude and 0° latitude.
Orthographic projection centered at 0° longitude and 90° latitude.
Orthographic projection centered at 0° longitude and -90° latitude.
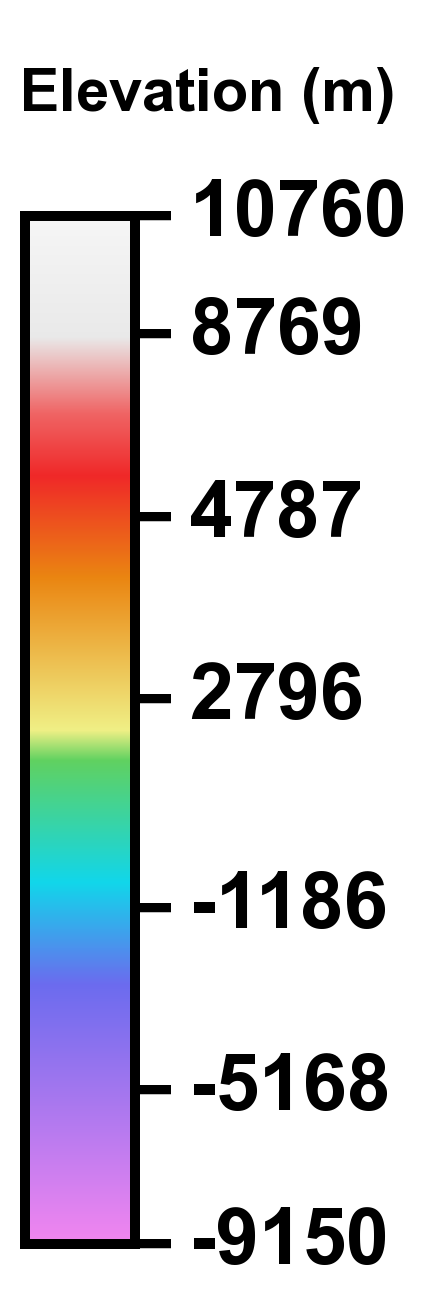
Color scale legend for LROC Color Shaded Relief. View the full size graphic, HERE [NASA/ GSFC/ DLR/ Arizona State University].
*NOTE: OS X (and many other) users may prefer opening these large TIFF files directly within a browser. Please select and "Save" to local storage media, allowing the option of opening these files in an image viewer or editing program.
No comments:
Post a Comment