Showing posts with label SVS. Show all posts

Tuesday, December 9, 2014

Tuesday, August 5, 2014

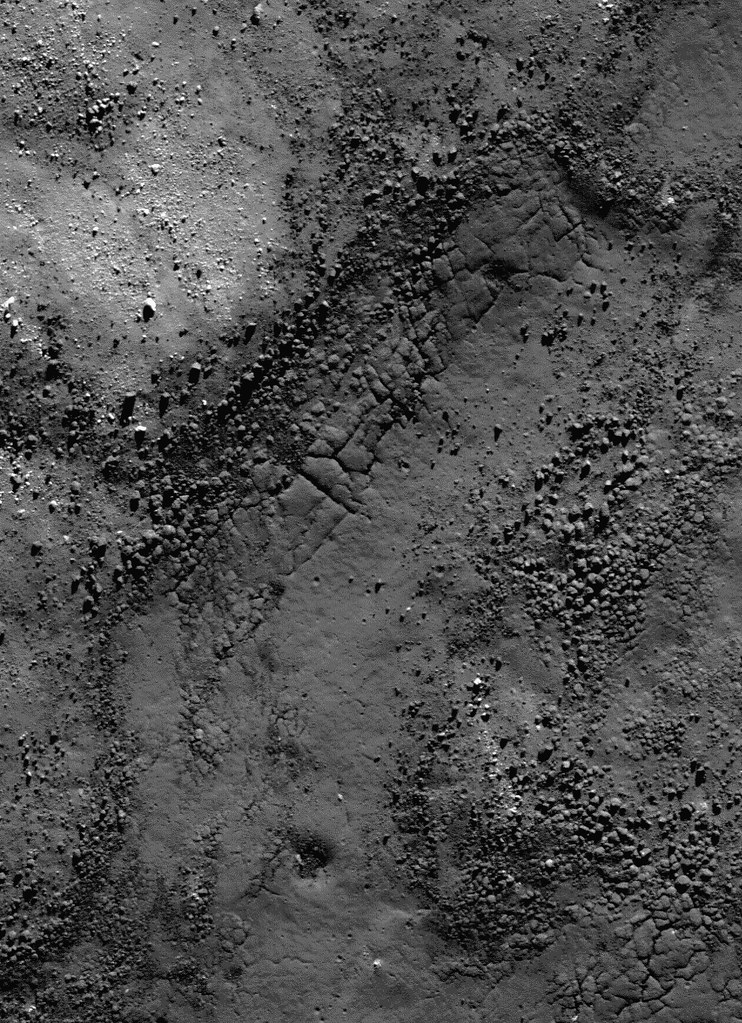
Fractures and boulders on the floor of De Forest

Fractured impact melt left the interior of De Forest crater (56.25 km; 76.94°S, 196.67°E) lined with boulders. 665 meter-wide field of view from LROC NAC observation M125650563L, 665 meter-wide field of view from LRO orbit 3650, April 11, 2010; 78.87° incidence angle, resolution 57 cm from 55.16 km over 77.1°S, 197.94°E [NASA/GSFC/Arizona State University].
Hiroyuki Sato
LROC News System

Today's Featured Image highlights a portion of the interior of De Forest crater (56.25 km; 76.94°S, 196.67°E), which is located inside the South Pole–Aitken basin.

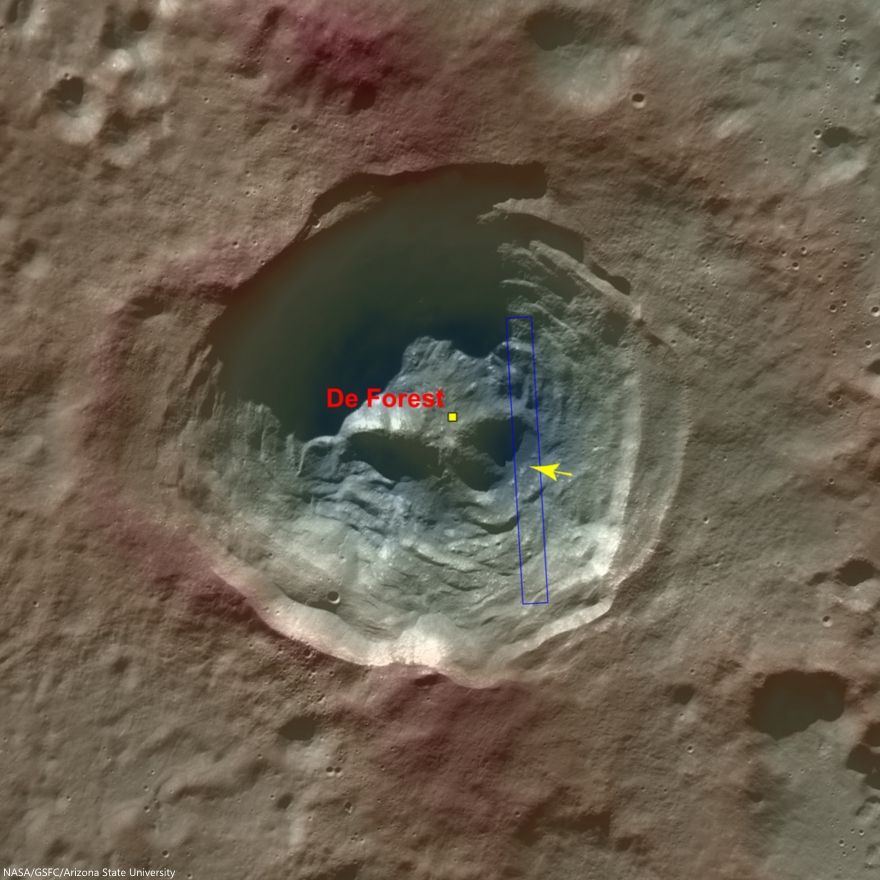
The cavity of De Forest crater exhibits prominent terraces of collapsed materials surrounding the central peak (see context imagery following).

The topographic low, east of the central peak, was largely coated with hot impact melt which formed a hard crust as it cooled; a portion of this melt is seen in the opening image. 

Context view of De Forest crater (56.25 km; 76.94°S, 196.67°E) consisting of LROC WAC monochrome mosaic (100 m/pix) overlain with colorized WAC stereo DTM (GLD100, Scholten et al., 2012). View centered on 76.92°S, 197.51°E. Footprint of LROC NAC observation M125650563L, April 11, 2010, outlined in blue, source of high-resolution view of the area designated with a yellow arrow (LROC Featured Image released August 5, 2014) [NASA/GSFC/Arizona State University]. 
Much of the area of the opening image is covered by numerous boulders, some of which are up to approximately 15 meters across.

The smooth surface extending in lower-left to upper-right is impact melt that cooled to form solid rock, and is now fractured in regular patterns along the edge. Impact melt that was splashed on the crater's walls and its central peak formed a coating that quickly cooled to solid rock.

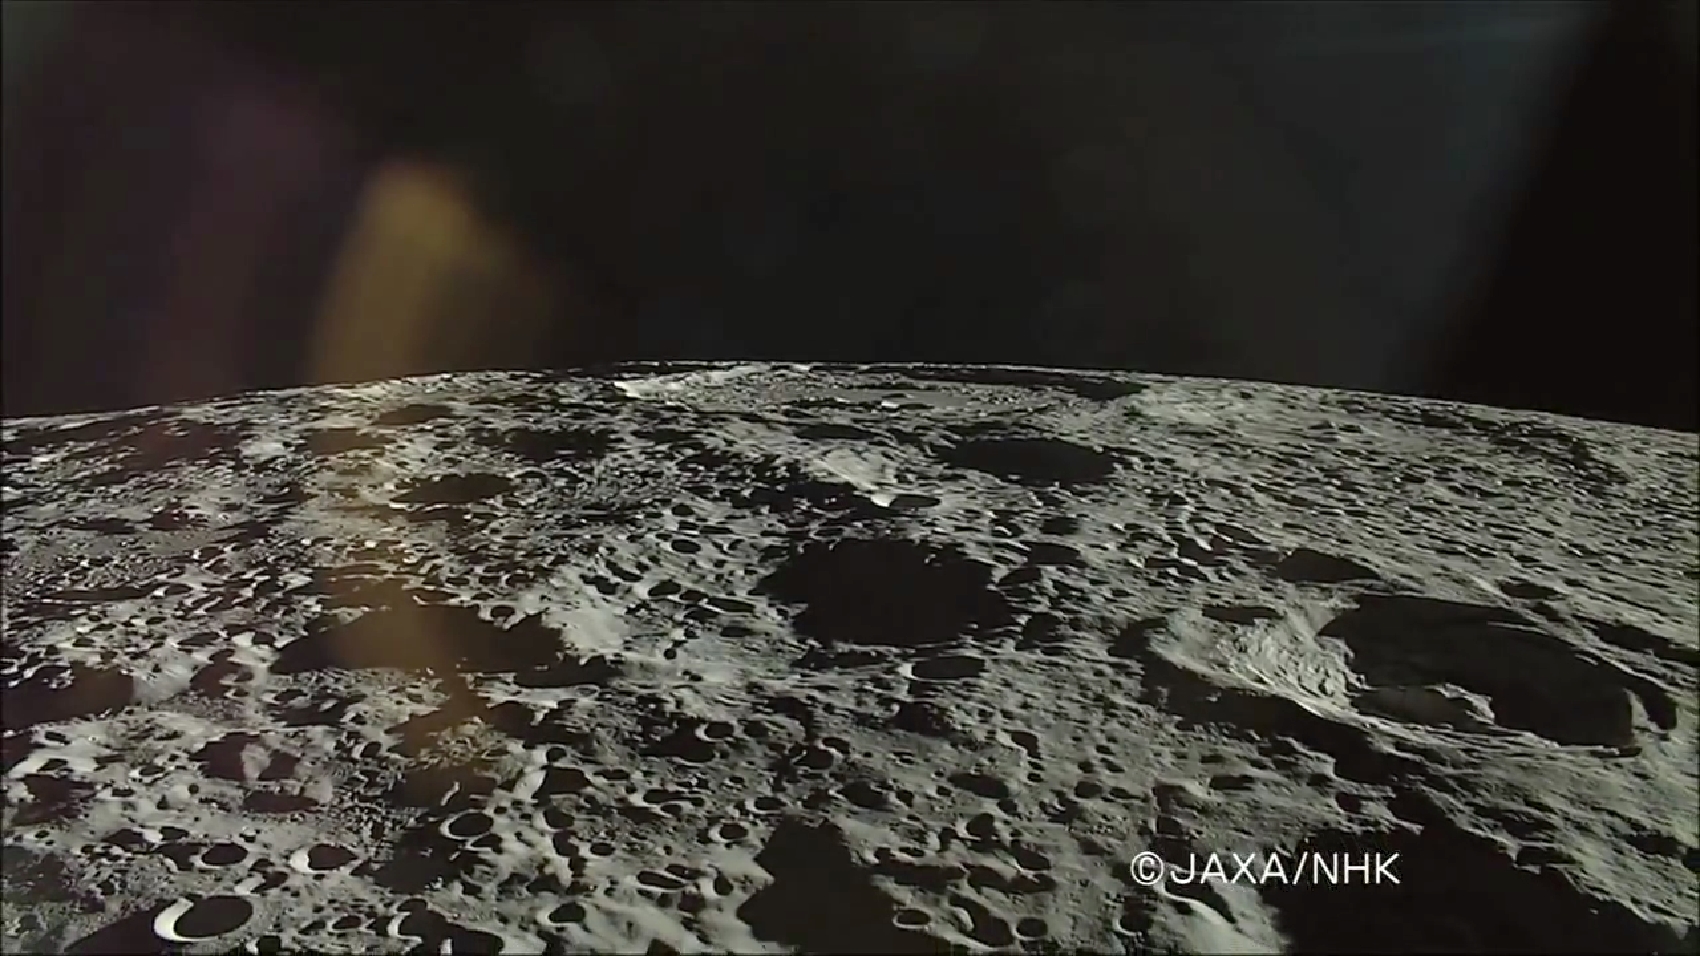
On the true "backside" of the Moon, De Forest (right) is situated well inside South Pole-Aitken impact basin, between Antoniadi (upper left, near horizon), host of the Moon's lowest elevation (-9094 meters) and Shackleton (not pictured), host of the Moon's south pole. HDTV still from Japan's lunar orbiter Kaguya (SELENE-1) in 2008 [JAXA/NHK/SELENE].
Later, it is likely that nearby moonquakes caused these brittle rock coatings to fracture, providing the source of boulders we now see on the lower reaches of the crater floor.

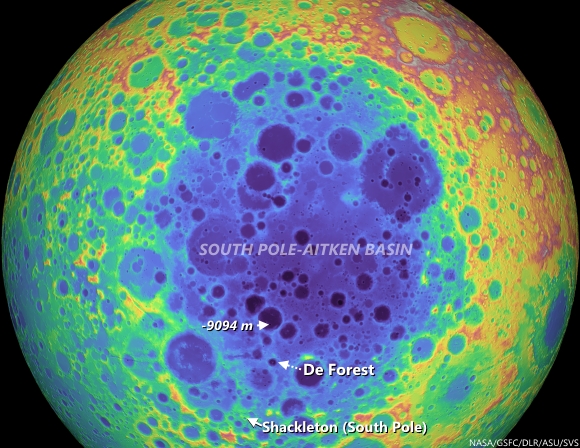
De Forest's position in the far south Farside is an area hosting Permanently Shadowed Regions (PSR's). The neutron detection experiment on-board LRO (LEND) has built up signatures consistent with cold-trapped volatiles, like water ice, in the vicinity. Image from Science Visualization Studio tour of SPA, larger image HERE [NASA/GSFC/Arizona State University/DLR/SVS]. 
As you can see in the following full NAC frame, an enormous number of similar boulders are found along the smooth melt deposits on the floor of De Forest crater. 

Explore this boulder-rich crater in the full NAC frame, HERE.

Related Posts:

Tuesday, December 10, 2013

2014 lunar phase and libration video


NASA Goddard (SVS) - The Lunar Reconnaissance Orbiter (LRO) has been in orbit around the Moon since the summer of 2009. Its laser altimeter (LOLA) and camera (LROC) are recording the rugged, airless lunar terrain in exceptional detail, making it possible to visualize the Moon with unprecedented fidelity. This is especially evident in the long shadows cast near the terminator, or day-night line. The pummeled, craggy landscape thrown into high relief at the terminator would be impossible to recreate in the computer without global terrain maps like those from LRO.

The Moon always keeps the same face to us, but not exactly the same face. Because of the tilt and shape of its orbit, we see the Moon from slightly different angles over the course of a month. When a month is compressed into 24 seconds, as it is in this animation, our changing view of the Moon makes it look like it's wobbling. This wobble is called libration.

The word comes from the Latin for "balance scale" (as does the name of the zodiac constellation Libra) and refers to the way such a scale tips up and down on alternating sides. The sub-Earth point gives the amount of libration in longitude and latitude. The sub-Earth point is also the apparent center of the Moon's disk and the location on the Moon where the Earth is directly overhead.

The Moon is subject to other motions as well. It appears to roll back and forth around the sub-Earth point. The roll angle is given by the position angle of the axis, which is the angle of the Moon's north pole relative to celestial north. The Moon also approaches and recedes from us, appearing to grow and shrink. The two extremes, called perigee (near) and apogee (far), differ by more than 10%.

The most noticed monthly variation in the Moon's appearance is the cycle of phases, caused by the changing angle of the Sun as the Moon orbits the Earth. The cycle begins with the waxing (growing) crescent Moon visible in the west just after sunset. By first quarter, the Moon is high in the sky at sunset and sets around midnight. The full Moon rises at sunset and is high in the sky at midnight. The third quarter Moon is often surprisingly conspicuous in the daylit western sky long after sunrise.

Celestial north is up in these images, corresponding to the view from the northern hemisphere. The descriptions of the print resolution stills also assume a northern hemisphere orientation.

This video is public domain and can be downloaded at: http://svs.gsfc.nasa.gov/goto?4118

Tuesday, May 28, 2013

Coalescing Secondaries

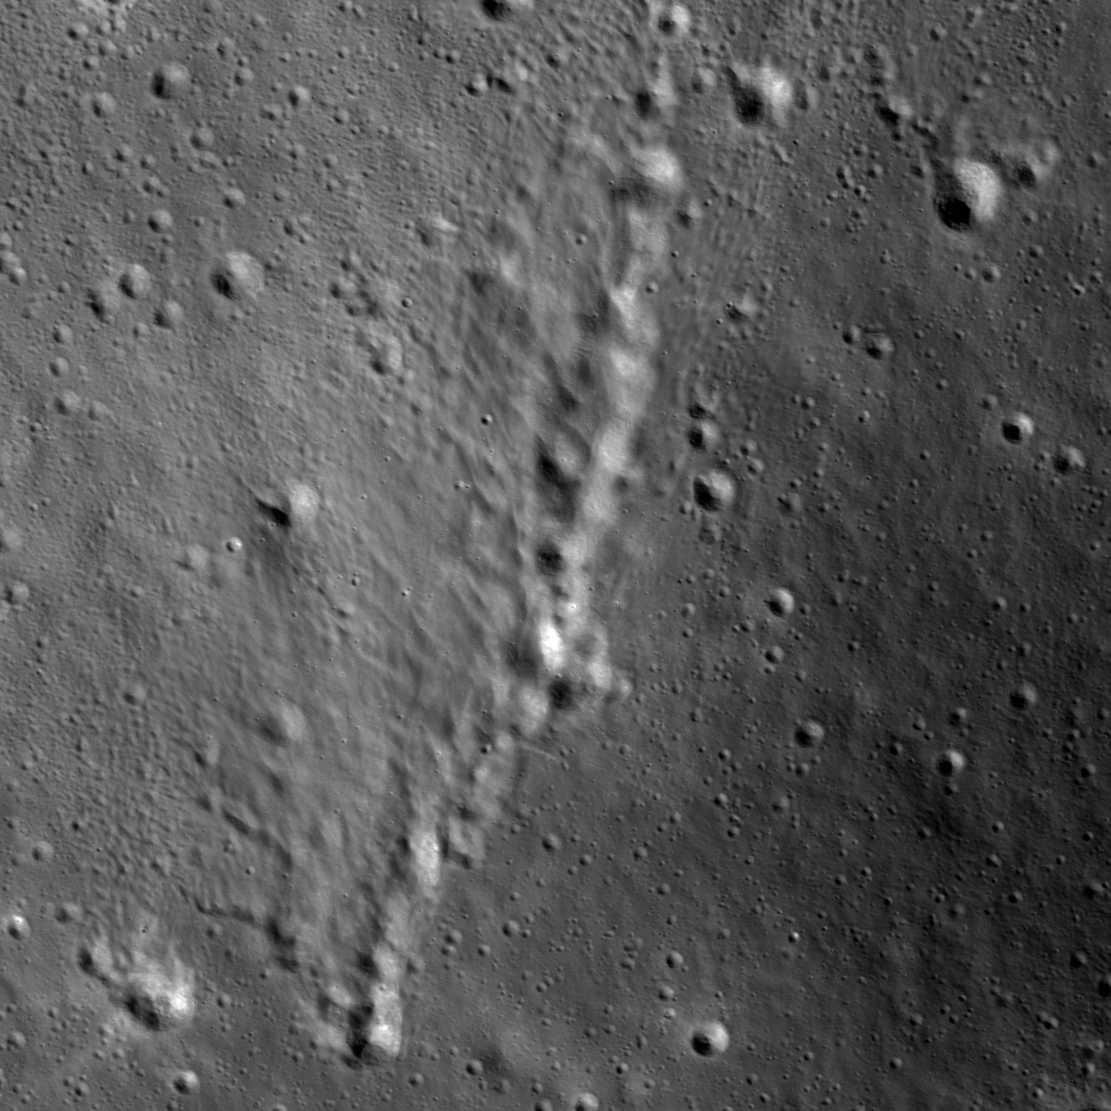
A chain of impact features provides a picturesque tableau (48.659°N; 103.299°E). LROC Narrow Angle Camera (NAC) frame M18286833R, LRO orbit 12051, February 3, 2012; illumination is from the southwest (angle of incidence 63.07°), north is up, image field of view approximately 2 km across [NASA/GSFC/Arizona State University].
James Ashley
LROC News System

Today's Feature Image exhibits a chain of impact features that are so closely spaced as to lose their distinction as separate landforms, producing one continuous feature instead.

An asymmetry in the ejecta pattern can also be seen in the form of filamentary tendrils extending to the north.

Based on this ejecta distribution, the secondary bolides likely came from a southerly or southeasterly direction.

Another, earlier look at the same field of view, at slightly higher resolution. LROC NAC M123901314R, orbit 3393, March 22, 2010; angle of incidence 47.54° at 0.56 meters resolution from 53.96 km [NASA/GSFC/Arizona State University].
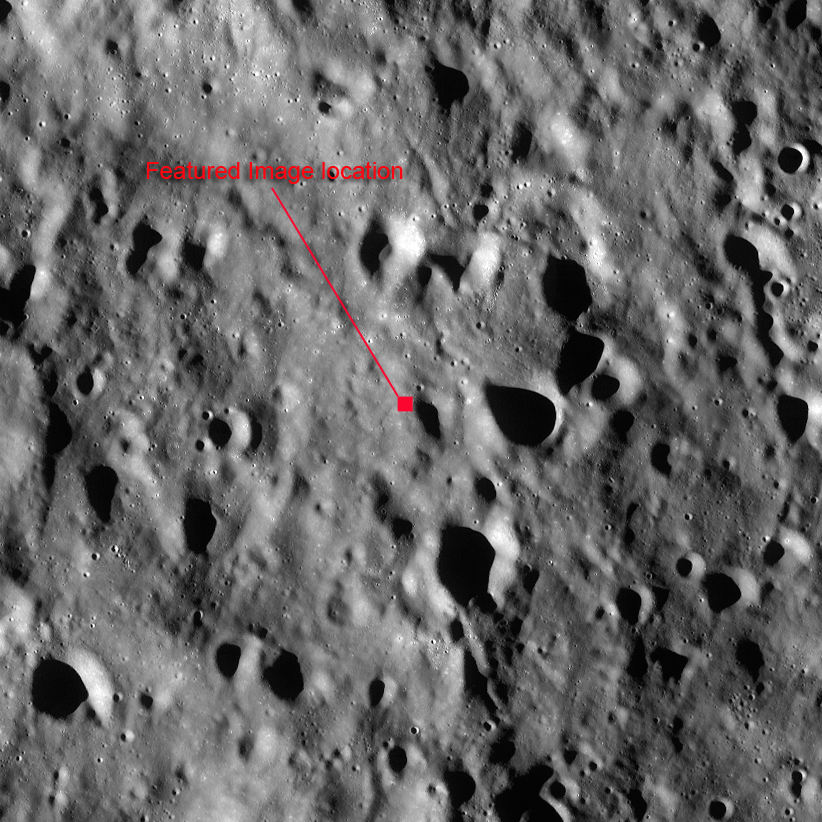
The WAC mosaic context image is approximately 83 km wide [NASA/GSFC/Arizona State University].
Zooming out to learn what this source might have been produces no obvious candidates, however. None of the medium-sized craters within 40 km of the featured crater chain appear to be particularly young -- a condition required to explain the chain's fresh appearance. Not until we expand our view even further do likely candidates crop up.

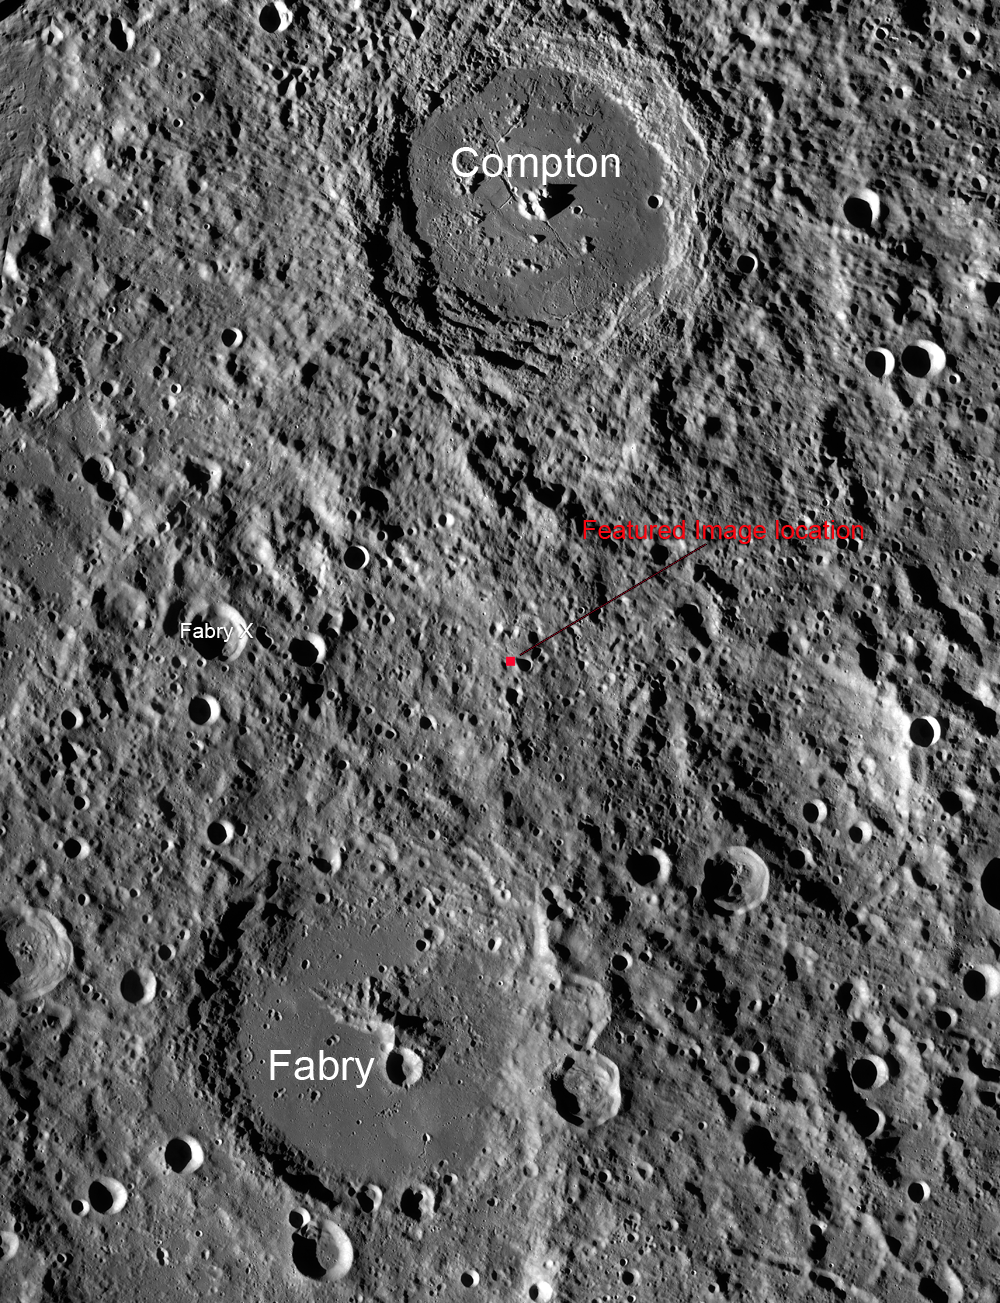
This larger scale WAC mosaic context image is just about 470 km wide [NASA/GSFC/Arizona State University].
But even here nothing unambiguous catches the eye. The secondary impacts could have resulted from one of any number of craters, or perhaps from an impact located even further away. A detailed surface study would be necessary before a definitive link could be made tying this ejecta with its crater of origin. Explore the full NAC frame HERE.

Other examples of ejecta interactions with the lunar surface can be found in Crater Chain near Rima T Mayer, Four of a Kind in Catena Davy, and Four Leaf Clover.

Bonus Context: The location of the field of view shown at high resolution in the LROC Featured Image, released May 29, 2013 in the north farside highlands. The terrain is representative of one of the four recognized lunar material groups, the farside anorthositic highland terrain, or FaHT [NASA/GSFC/SVS].

Thursday, March 7, 2013

The Moon's Permanently Shadowed Regions


New video presentation from NASA-Space Visualization Studio (SVS) at Goddard Space Flight Center (GSFC) combines data from instruments on-board Lunar Reconnaissance Orbiter (LRO) to demonstrate the dynamics of the Moon's permanently shadowed regions (PSRs).

Details: LRO peers into Permanent Shadows (SVS)