Showing posts with label DTM. Show all posts

Wednesday, June 11, 2014

The original interplanetary mountaineers

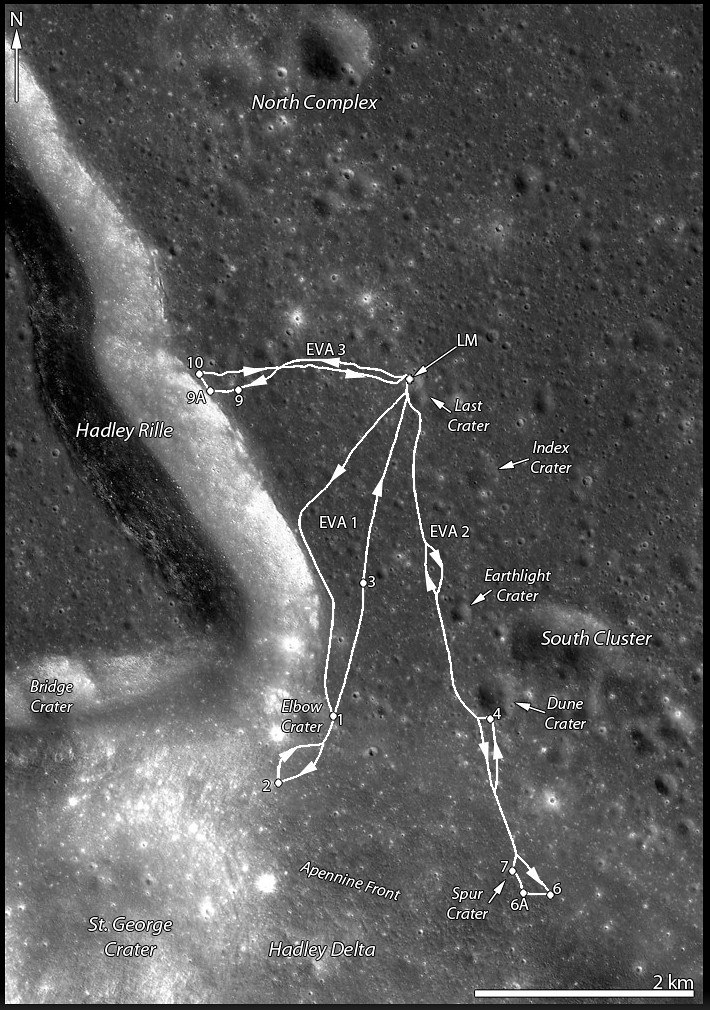
Traverse plots of Apollo 15 EVA 1 & 2 (August 1 and 2, respectively), the routes astronauts Dave Scott and Jim Irwin drove south to the lower slope of Mons Hadley Delta (from the "Elbow" bend in Rima Hadley, southward, toward the left). Elevations above that of the landing site (LM). For scale, the dogleg distance the astronauts travelled from the LM to Elbow crater along the edge of Hadley Rille over EVA 1 is roughly 4.5 km. Oblique LROC NAC mosaic M1123519889RL, LRO orbit 17751, May 18, 2013; spacecraft and camera slew 55.21° from orbital nadir, 76.87° angle of incidence, resolution 2.87 meters from 130.27 km over 26.11°N, 11.15°E  [NASA/GSFC/Arizona State University].
J. Stopar
LROC News System

The lofty Apennine Mountain Range has two prominent peaks near the Apollo 15 landing site: Mons) Hadley (relative height 4 km) to the northeast and Mons Hadley Delta (3.5 km) toward the south.

Between these two peaks lies the "Swann Range," named for Apollo 15 Geology Team Leader Gordon Swann.

The Apennine Mountain Range contains some of the largest peaks on the Moon Mons Hadley rivals the prominences of notable terrestrial mountains like Mt. Rainier and Mt. Fuji, and Mt. Erebus in Antarctica when measured from base to summit.
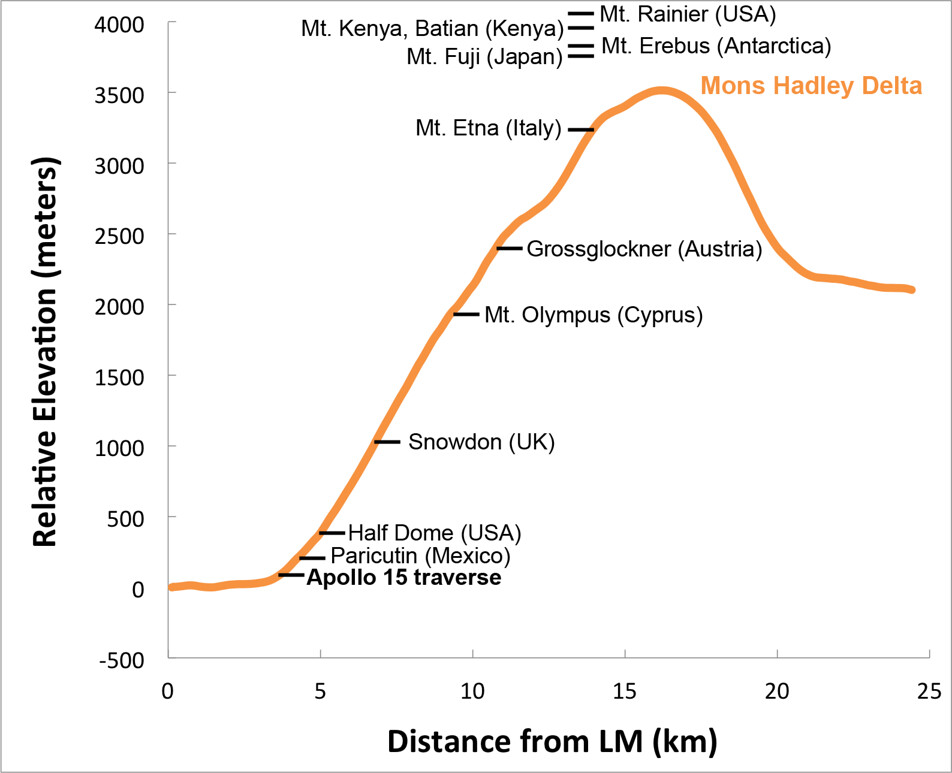
Elevation profile of Mons Hadley Delta, measured from the Apollo 15 landing site (left) through the peak (right); data from the LROC WAC-derived GLD100 Digital Terrain Model (DTM), with relative heights of notable terrestrial mountains shown for scale. Mons Hadley Delta is not the largest peak in the Apennines, and Scott and Irwin scaled only a small portion of the mountain's contact zone with the Hadley Delta plain [NASA/GSFC/Arizona State University].
The first Apollo 15 EVA took astronauts David Scott and James Irving southward along the edge of Hadley Rille and to the base of Mt. Hadley Delta near St. George crater. This traverse took them to a height of just over 65 meters above the landing site on the mare plain. At this height, much of the surface material of the mountain comprises debris that, over eons, slid down the upper slopes through mass-wasting. Materials collected in this area primarily consist of regolith, as there are very few surface boulders.

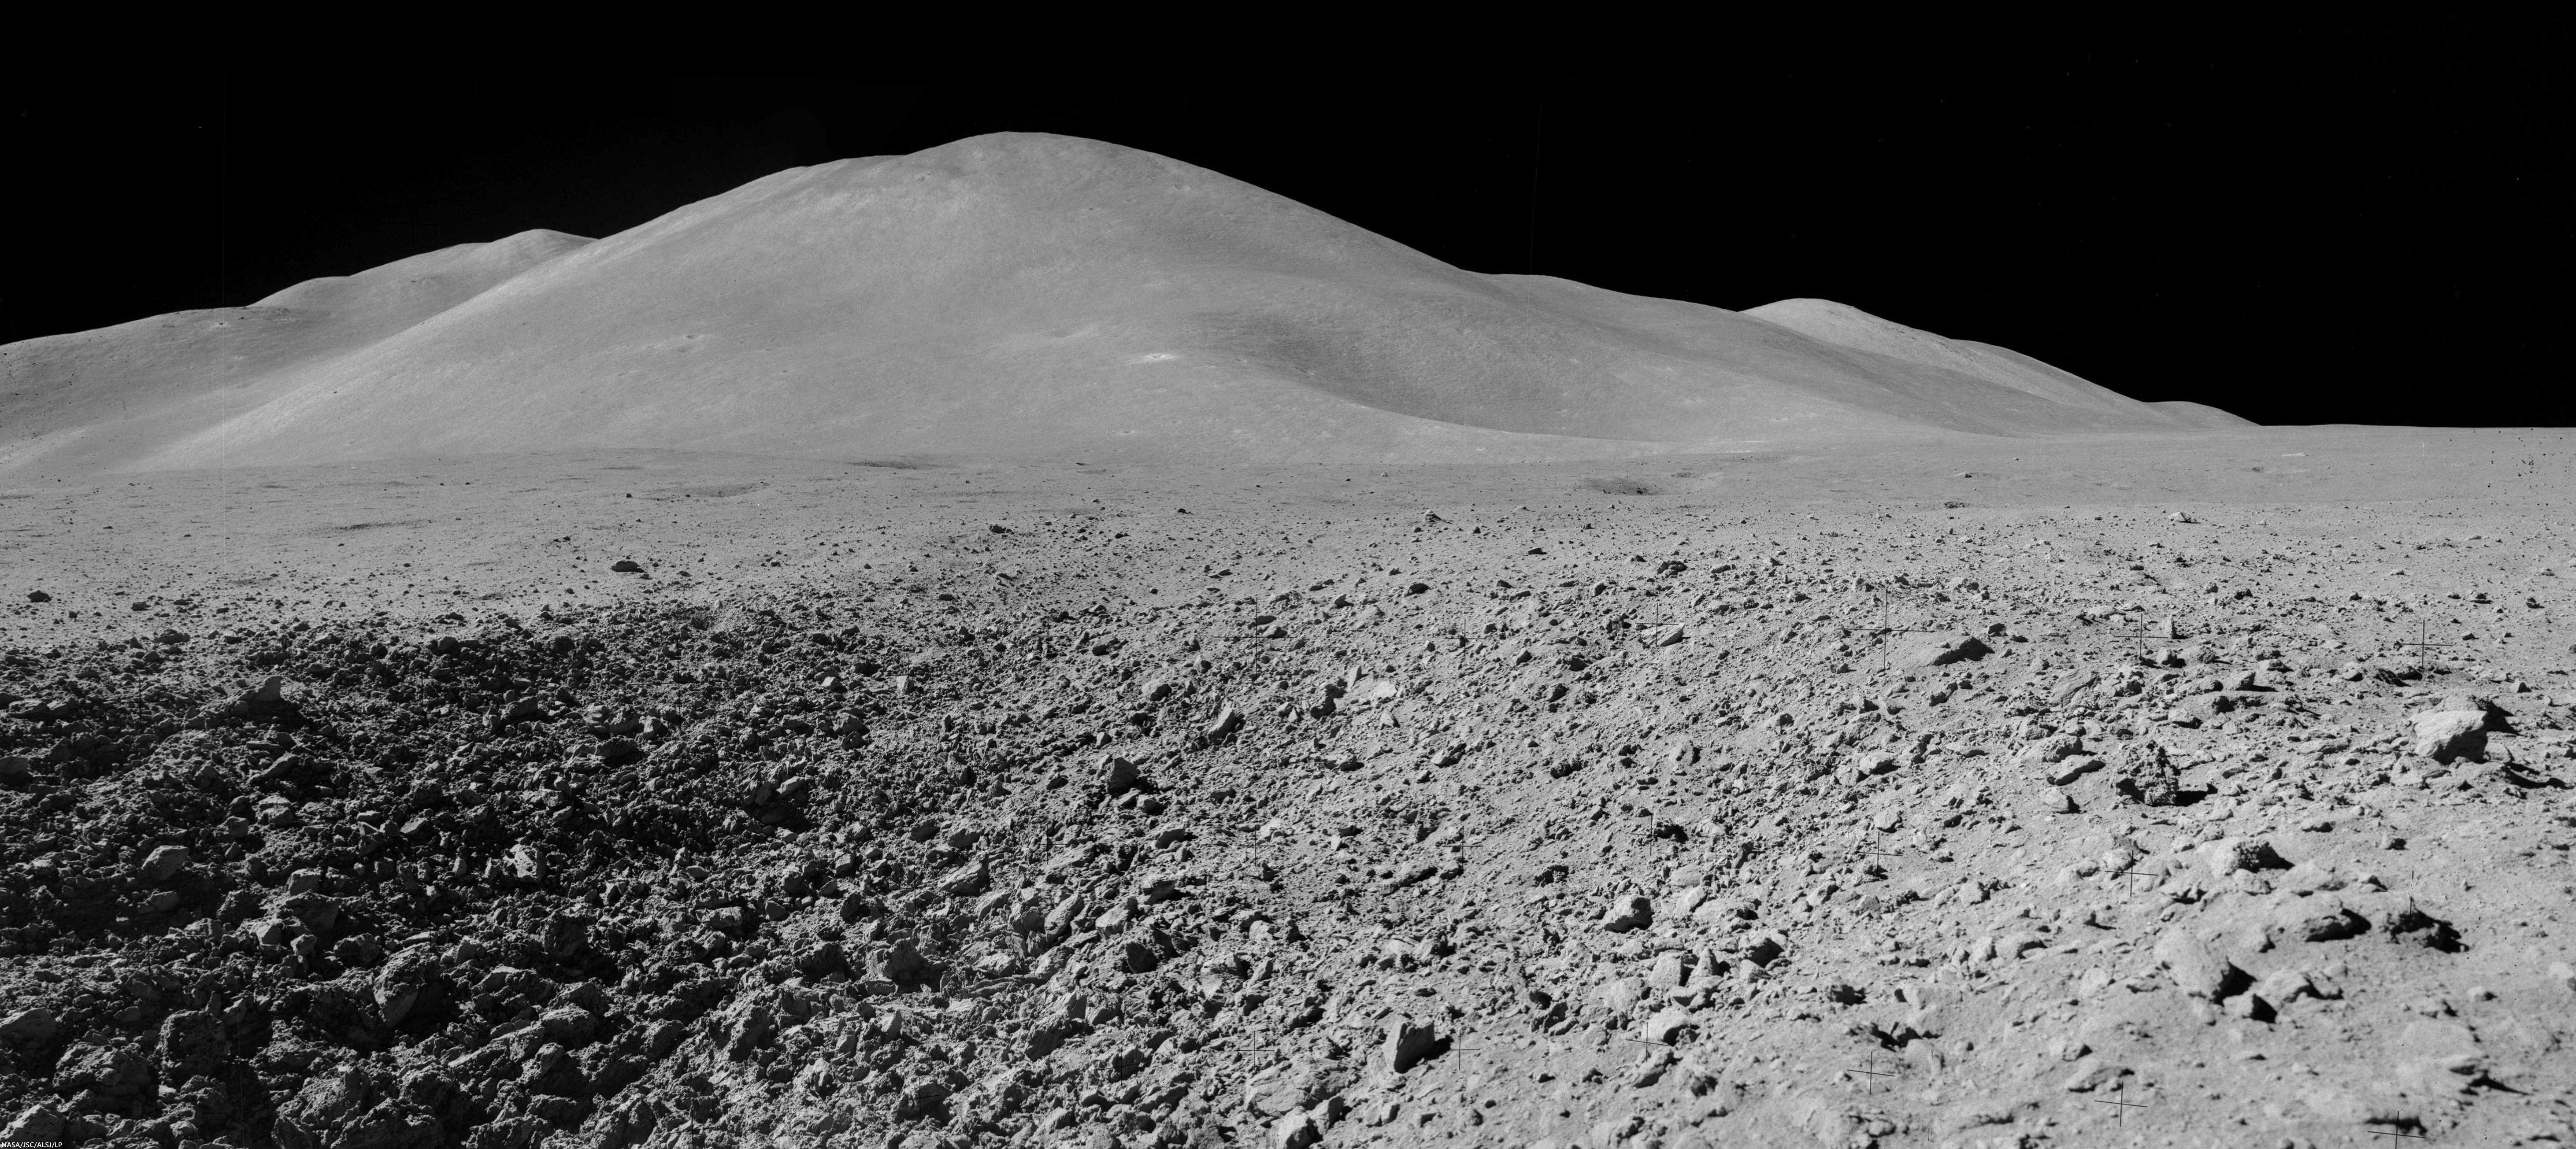
Mons Hadley Delta (high-resolution mosaics HERE); Mosaic of Dave Scott's Station 9 panorama (AS15-82-11084-88), from northeastern wall of the "Station 9 crater," a relatively fresh 15 meter-wide feature characterized by soft clod-like blocks of pressure-pressed regolith formed at small impact. Station 9 crater is about 240 meters immediately northeast of Rima Hadley; Apollo 15 (EVA 3), August 2, 1971 [Dave Scott/NASA/JSC/ALSJ].
The second EVA took the astronauts southeast to "South Cluster" and Spur craters. At Spur crater, a very old crystalline rock fragment was collected, containing evidence of geologic processes more than 4 billion years old and representing a piece of the original anorthositic crust of the Moon. They also discovered an unusual green material composed of volcanic glass.

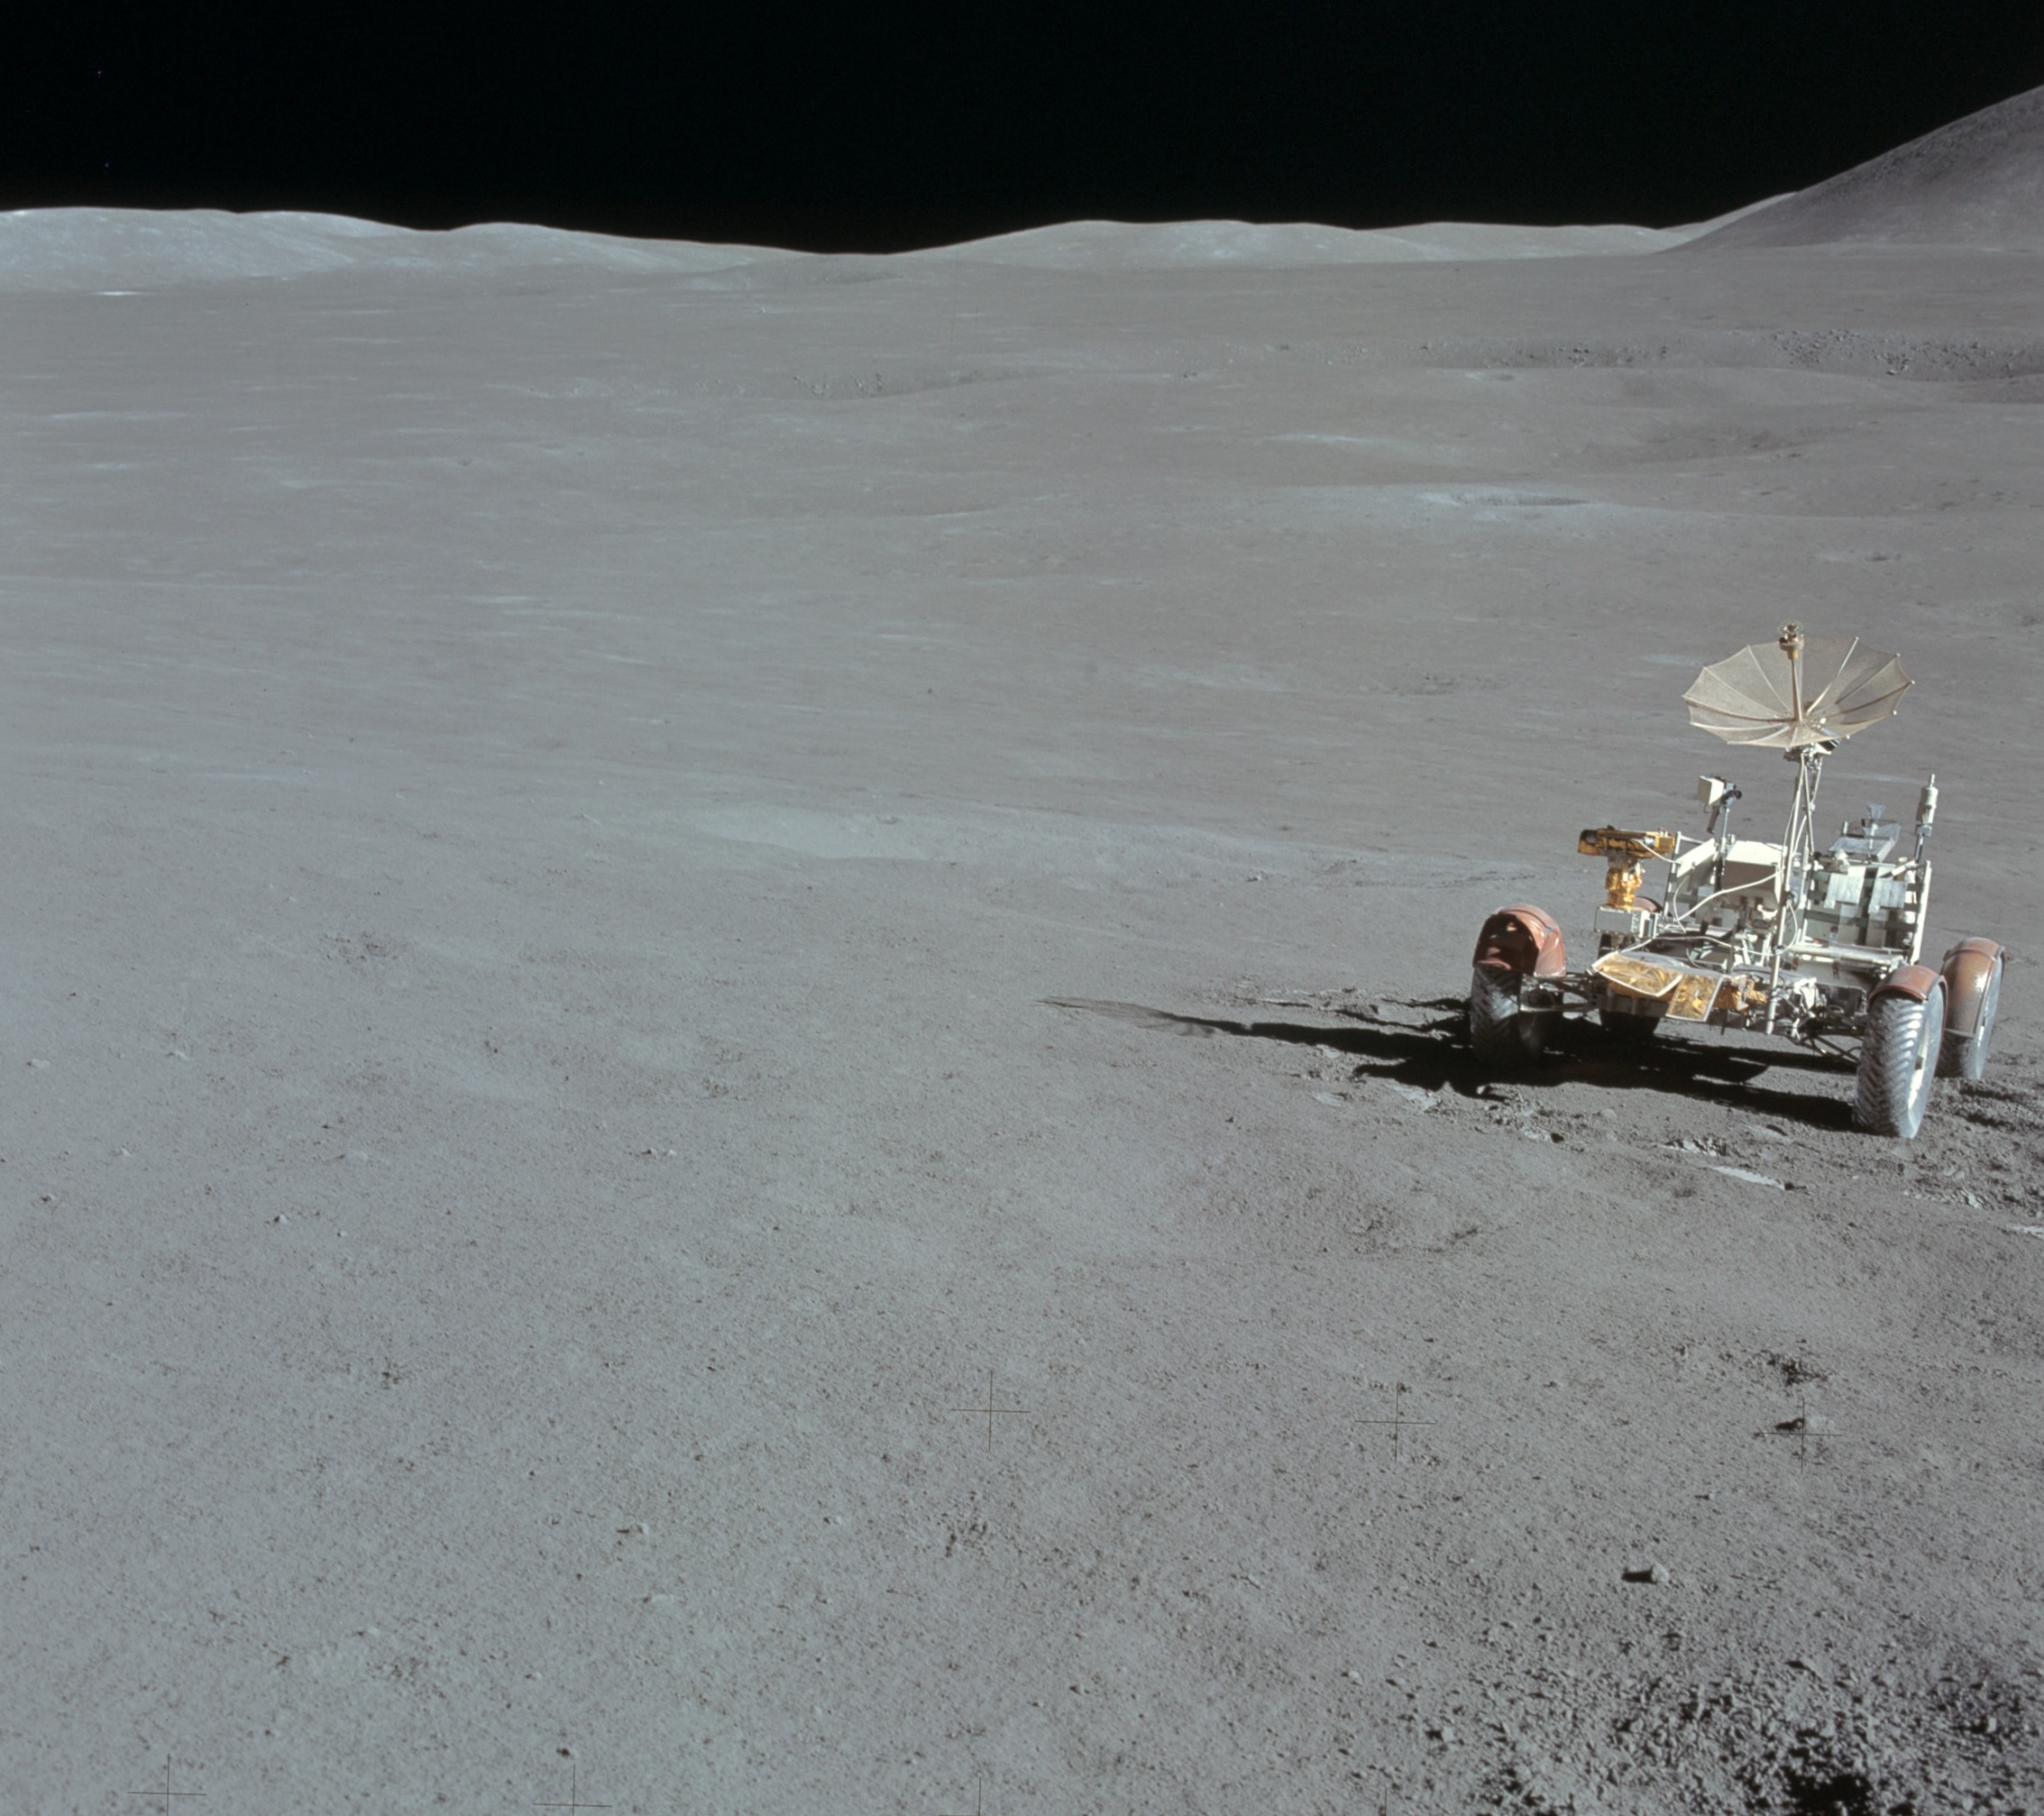
This traverse ascended about 95 meters in elevation, up the base of Mons Hadley Delta. At times, the slope was steep enough (~ 18°) that the rover had difficulty getting traction, and the mountain peak loomed so high overhead, that the astronauts could not lean back far enough to get it in the frame of their cameras.

Apparent outcrops (arrows) may represent a high-lava mark approximately 85 meter up the south slope of Mons Hadley. AS15 magazine 84. View a more dramatic mosaic from this panorama HERE [NASA/JSC/Apollo 15 Lunar Surface Journal/Arizona State University].
During this traverse, the astronauts commented that they thought they could detect a high-mark where lava might once have filled the basin at the base of nearby Mt. Hadley around a height of 85 meters above the current mare plain.

LROC projection with traverse courses of Apollo 15 expedition to Hadley Delta, July 30-August 2, 1971 [NASA/GSFC/Arizona State University].
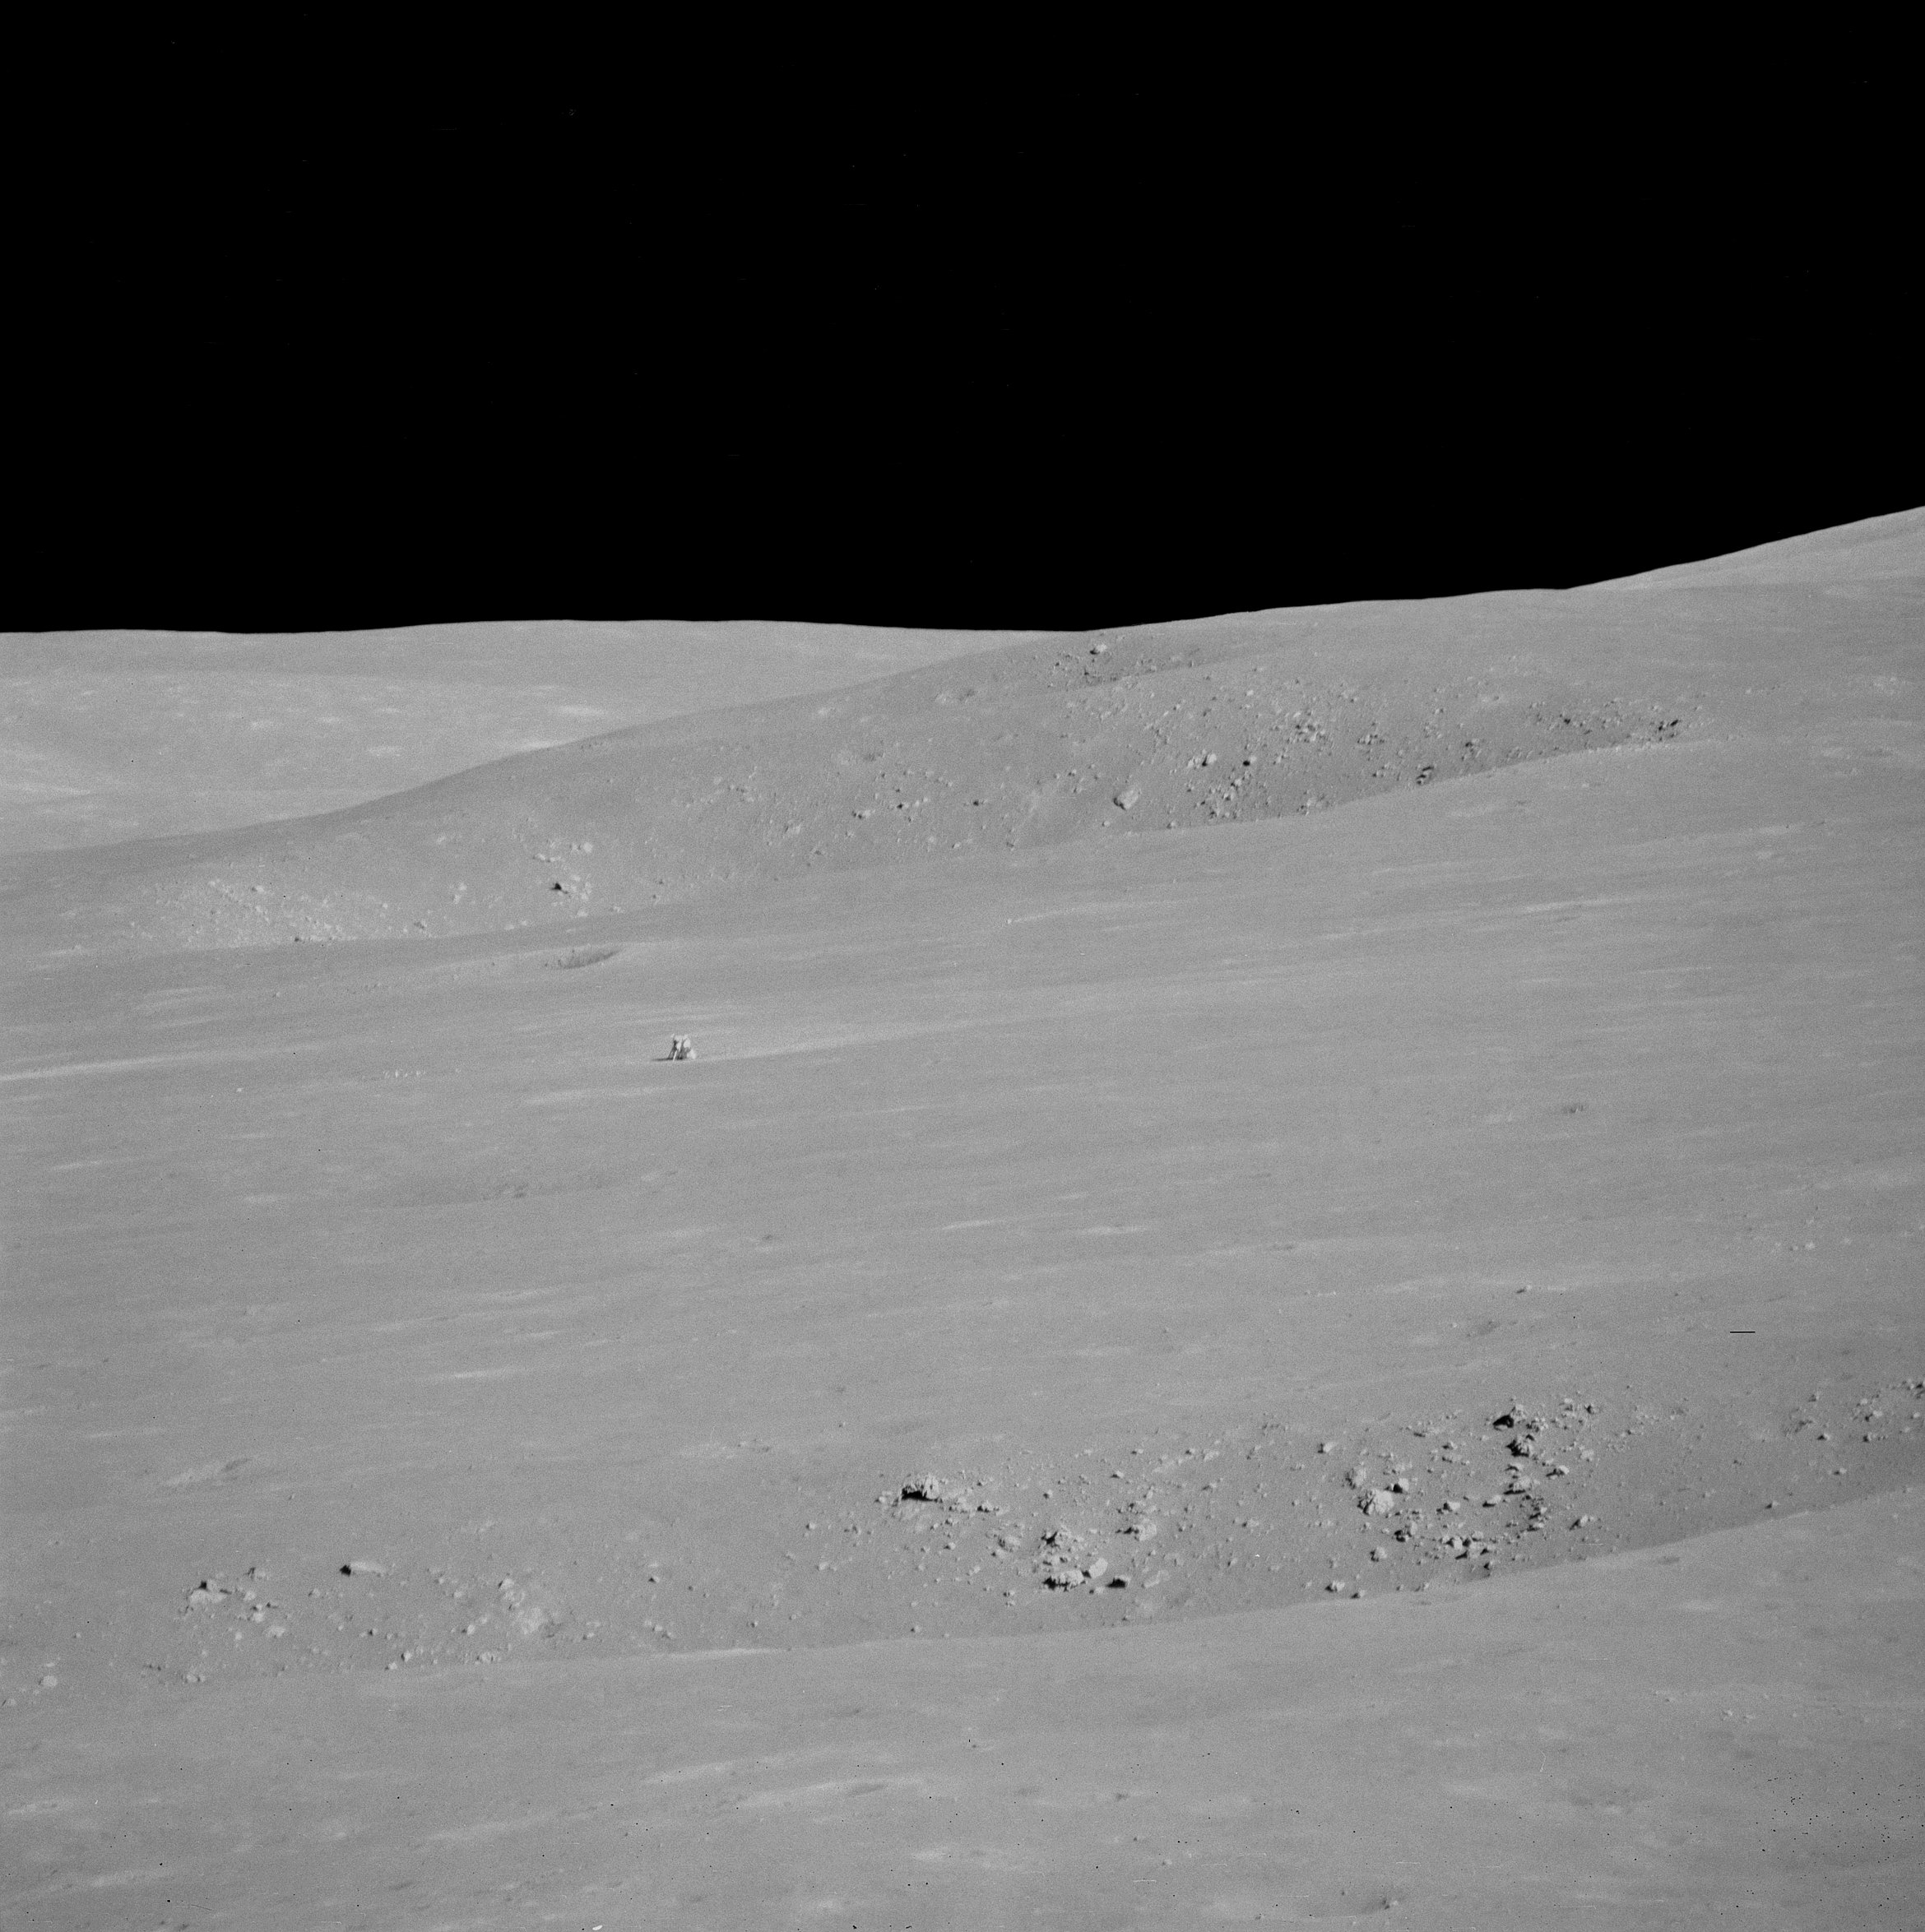
From Science Station 6. It definitely worthwhile to see a larger, high-resolution mosaic of this, reported to be Dave Scott's favorite photograph from the expedition (HERE). Through a 500-mm lens, from Science Station 6 up on the Apennine Front, the lunar module Falcon and ALSEP components are seen from 4.7 km, backdropped by the North Complex crater group and flank of Mons Hadley, on the plain's opposite bank [NASA/JSC].
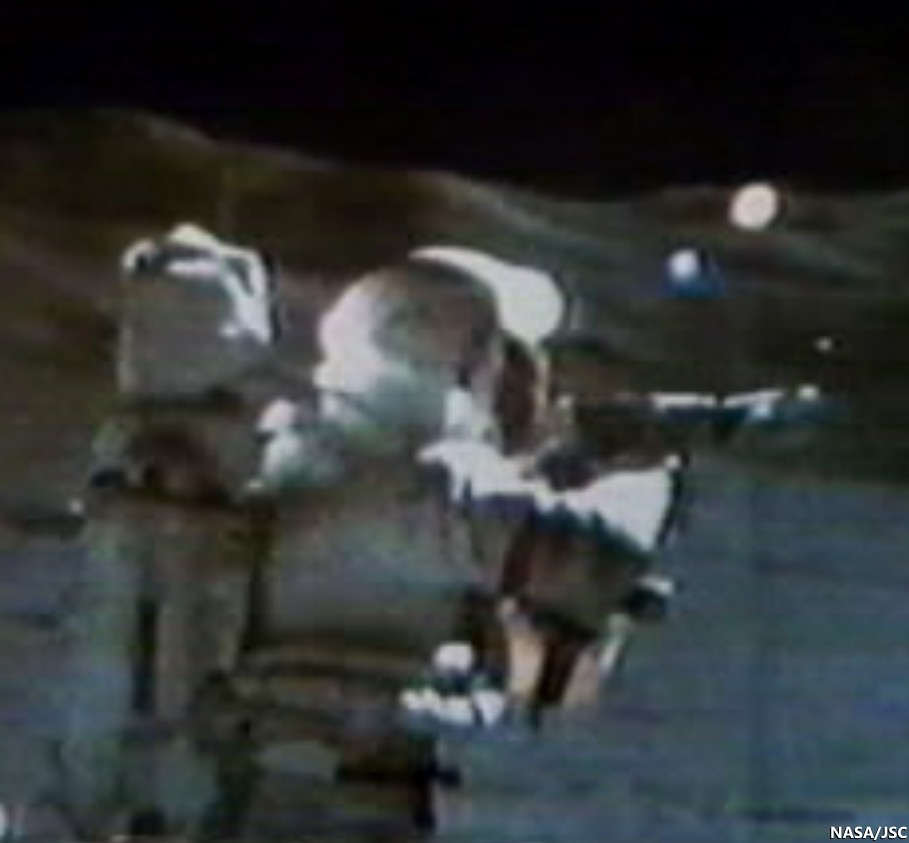
Apollo 15, Science Station 6, Spur Crater, on the Apennine Front, August 1, 1971. Dave Scott employs his 500 mm lens and black and white magazine 84 to capture the image immediately above, the Apollo 15 lunar module Falcon and North Complex crater group in context of the high mountains surrounding the Hadley Delta landing site. Still clipped from live video transmission relayed from remote-operated color TV camera on the lunar rover [NASA/JSC/ALSJ].
After capturing his black and white 500 mm panorama, Cmdr. Scott returned employed color magazine 86 and a less awkward smaller focal length. The reproduction here is too small to see the lunar module, but a much cleaner full resolution version is available HERE. Though it is not as detailed, and coherent backscatter is more problematic than the black and white at 500 mm, the full-resolution color image more closely matches the unaided human eye.  AS15-86-11618 [NASA/JSC/ALSJ].
While the Apollo 15 astronauts scarcely climbed the lower slopes of a lunar mountain, they made many important discoveries. What challenges, findings, and fun (like slope skiing) might future explorers experience on the powdery mountains of the Moon?

Explore the first two of the Apollo 15 traverses in more detail below by panning and zooming. The numbers indicate relative elevations of the paths travelled by the astronauts.

Related Posts:
Soaring Over Mighty Mt. Hadley
Apollo 15 departs Hadley Rille Delta
Water found in the Apollo 15 Genesis Rock
Follow the Tracks (Apollo 15)
Hadley Rille and the Mountains of the Moon
Retracing the Steps of Apollo 15 Constellation Region of Interest
Apollo 15 Laser Ranging Retroreflector: a Fundamental Point on the Moon
LROC's First Look at the Apollo Landing Sites
'Man's first wheels on the Moon' at 41 years
Bowditch Lava Terraces
Lunar Kipuka
Remnants of the Imbrium Impact
Hadley-Apennine: the Apollo 15 Landing Site
The Mighty Apennine Mountain Range
Layers near Apollo 15 Landing Site
LROC Explores Apollo 15 (YouTube video)
Kaguya captures Rima Hadley

Wednesday, April 10, 2013

John Moore's "Watered Moon"


John Moore has a new video quite different than what we've posted of his work previously. About the video above he recommends:
"Several theories abound as to the Moon's formation. One in particular is 'The Giant Impact Theory', which suggests a Mars-sized object struck our proto-Earth, and ejected vast amounts of material that later accreted to form the Moon. The two worlds developed quite differently over time -- one sustaining [life as we know it], the other a barren landscape completely indifferent to our natural needs. Central to formation of life on Earth was water, which fueled the diversity of life at every level. For the Moon, however, it wasn't to be so. But what if the conditions were just right, and water could sustain on the lunar surface, what then would have been the outcome? Let's see..."
Without unnecessary delay, we'll include the following additional work by John, though it deserves its own post with explanatory illustrations. It deserves its own Poster. As it is, we include links to earlier related posts since these two extremities of lunar elevation, first identified by Japan's Kaguya investigators and refined by American teams using data from LRO, have been of particular interest here.


Related Posts:
Oblique views of the Moon's highest and lowest places (October 3, 2012)
View from Vavilov (January 31, 2012)
DLR: Flying over the three-dimensional Moon (December 1, 2011)
LROC's new Global Lunar Topography (November 16, 2011)
LOLA's deep Antoniadi (April 16, 2011)
LRO's unprecedented topography of the Moon (December 17, 2010)
Highest point on the Moon (October 26, 2010)
The deepest spot on the Moon nearly wasn't (September 17, 2010)
Lunar superlatives from LROC WAC (September 6, 2010)
The Moon's lowest of the  low (November 24, 2009)
Accurate topographic map of the Moon (June 13, 2009)
Spectacular refinements to Kaguya laser altimetry (May 28, 2009)
Best lunar topography derived from Kaguya (February 12, 2009)

Wednesday, February 6, 2013

Future Moon: 'Working the Crater"


Another excellent, very useful and imaginative virtual diorama by John Moore, created using the Lunar Reconnaissance Orbiter laser altimeter (LOLA) digital elevation model (DTM) and both LROC NAC and WAC photography.

Having impacted upon the eastern rim of lunar crater Virtanen (15.66°N, 176.72°E) - a Constellation program 'Region Of Interest' - a possible site for further exploration of the Moon), this small, unnamed 12-kilometre-sized crater holds some wonderful geological features for scientists and geologists to explore.

Some of these features are still not well understood, so setting up bases in and around such craters will lead to profound discoveries regarding how they formed and developed over time - from initial impact to final settlement.

Directly Related:
Lunar Landslides! (October 15, 2011)


John Moore: Exaggerating the elevation (October 17, 2012)
LROC: The Rays of Messier A (April 6, 2012) John Moore DTM-based survey included.

Wednesday, May 2, 2012

LROC NAC DTM: Copernican crater in 3D

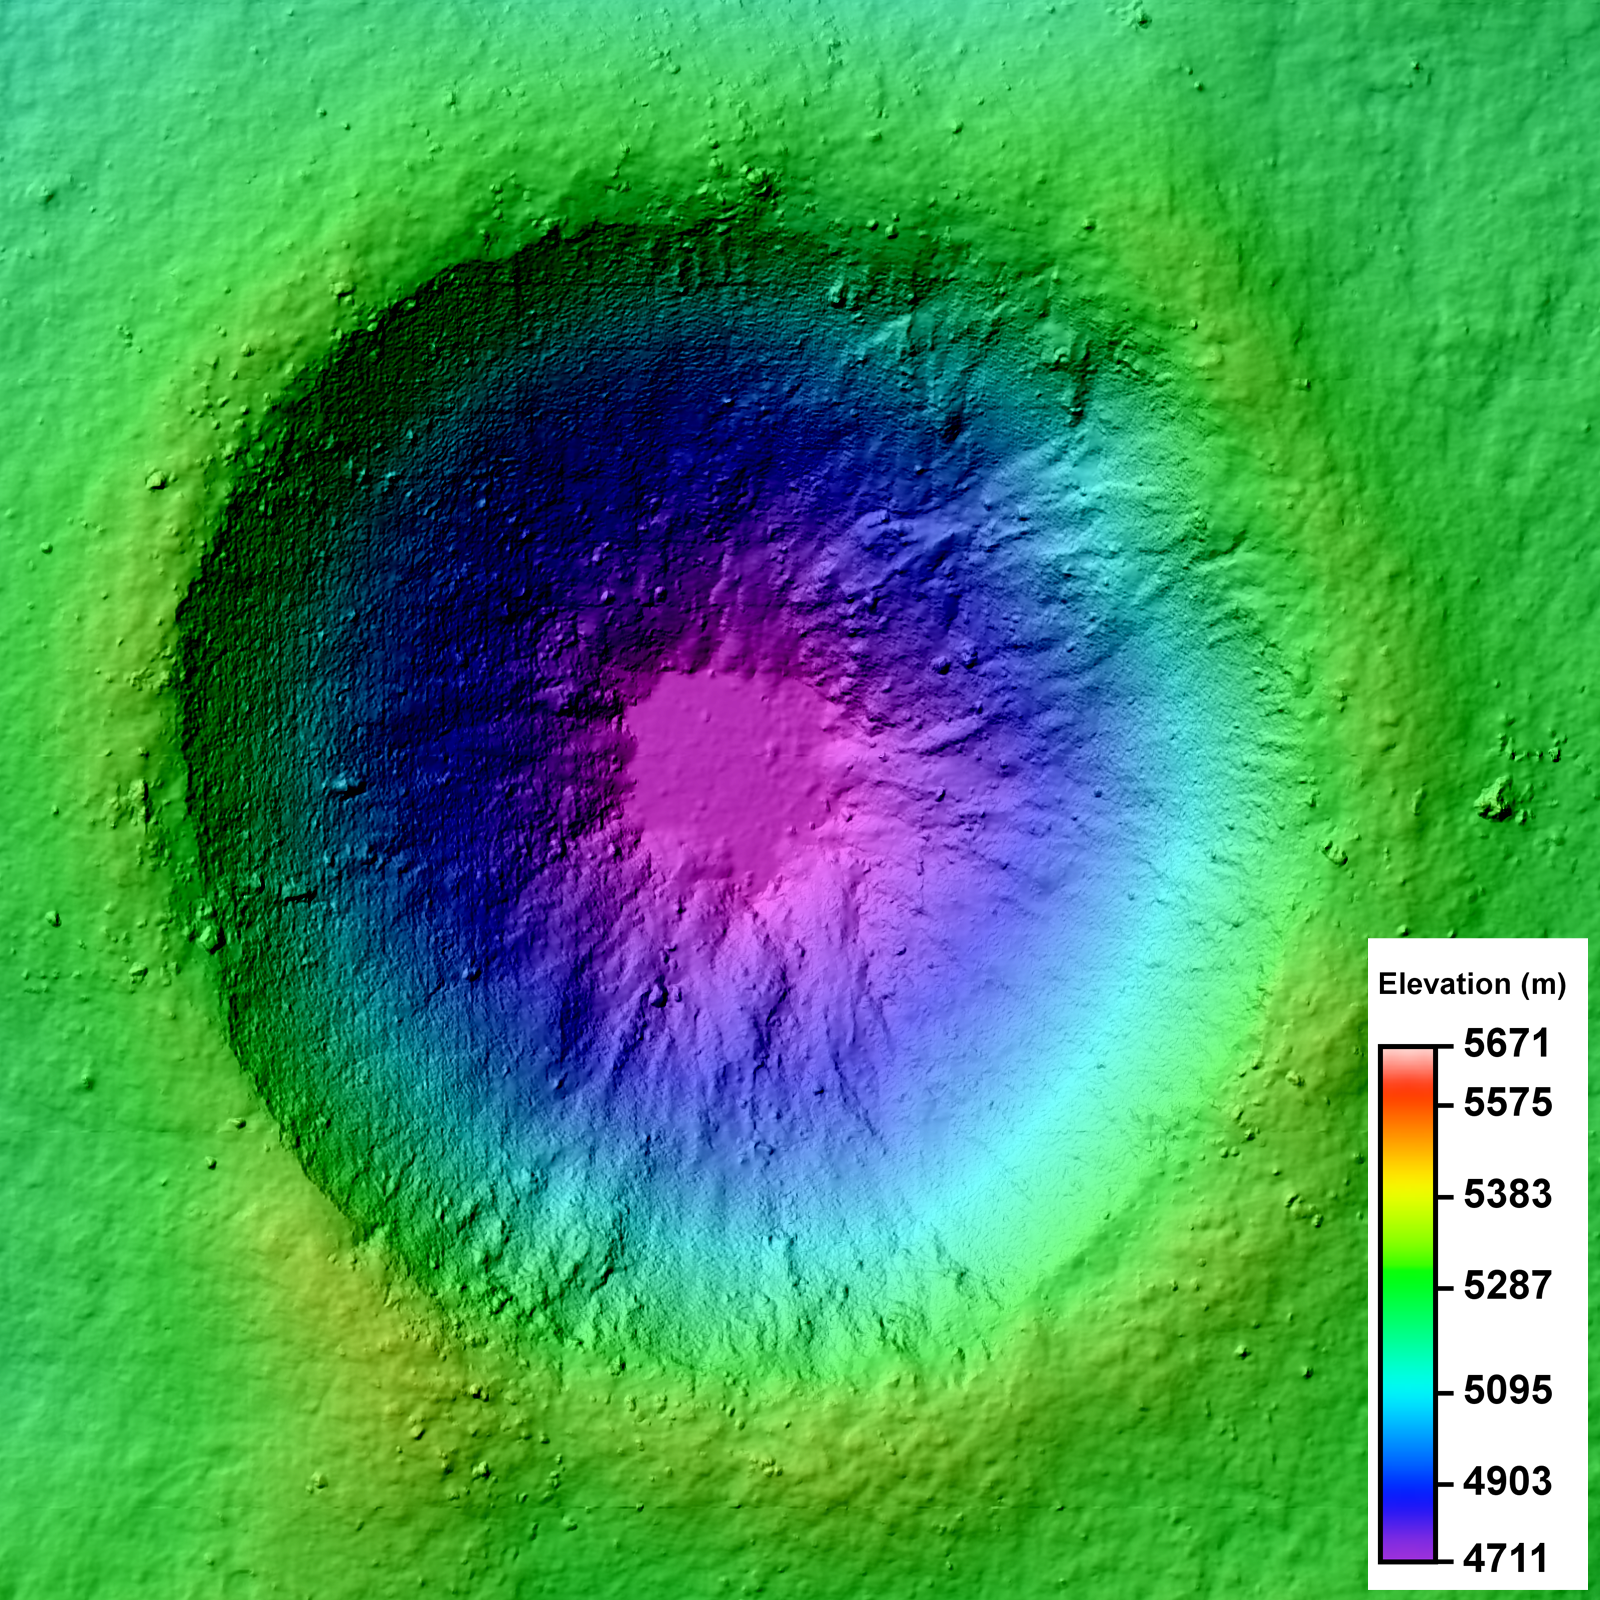
LROC Narrow Angle Camera (NAC) Digital Terrain Model (DTM) of an unnamed crater in the farside lunar highlands. Image field of view 3.2 km across. See the much larger (1600px) LROC Featured Image HERE [NASA/GSFC/Arizona State University].
Lillian Ostrach
LROC News System

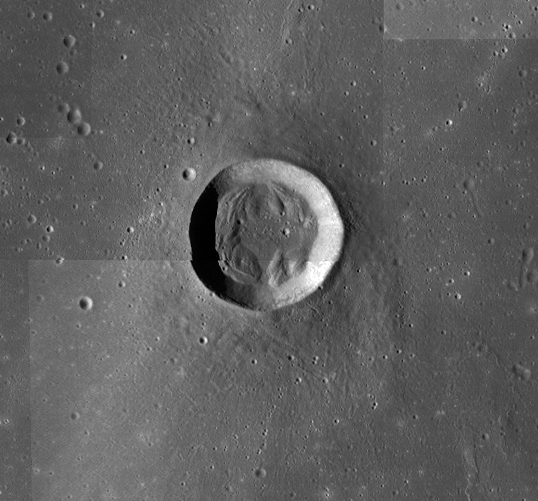
LROC Featured Images show off the incredible variety of stunning lunar geology imaged by the LROC NACs. While these beautiful images allow scientists to study the surface of the Moon with respect to morphologic detail and albedo variations at 0.5 meters per pixel, repeat - or stereo - images of the same location on the surface at similar illuminations but different viewing geometries provide scientists the chance to create a 3D topographic model. Why all the fuss? Well, these Digital Terrain Models, or DTMs, are critical to scientific investigations where topographic information about the lunar surface aids is necessary. Today's Featured Image is a DTM of a 2.3 km diameter unnamed impact crater (17.682°S, 144.408°E) west of Isaev crater. This impact crater is very young, evidenced by its high-reflectance ejecta blanket, and is of scientific interest because the interior crater morphology is complex (see image below).

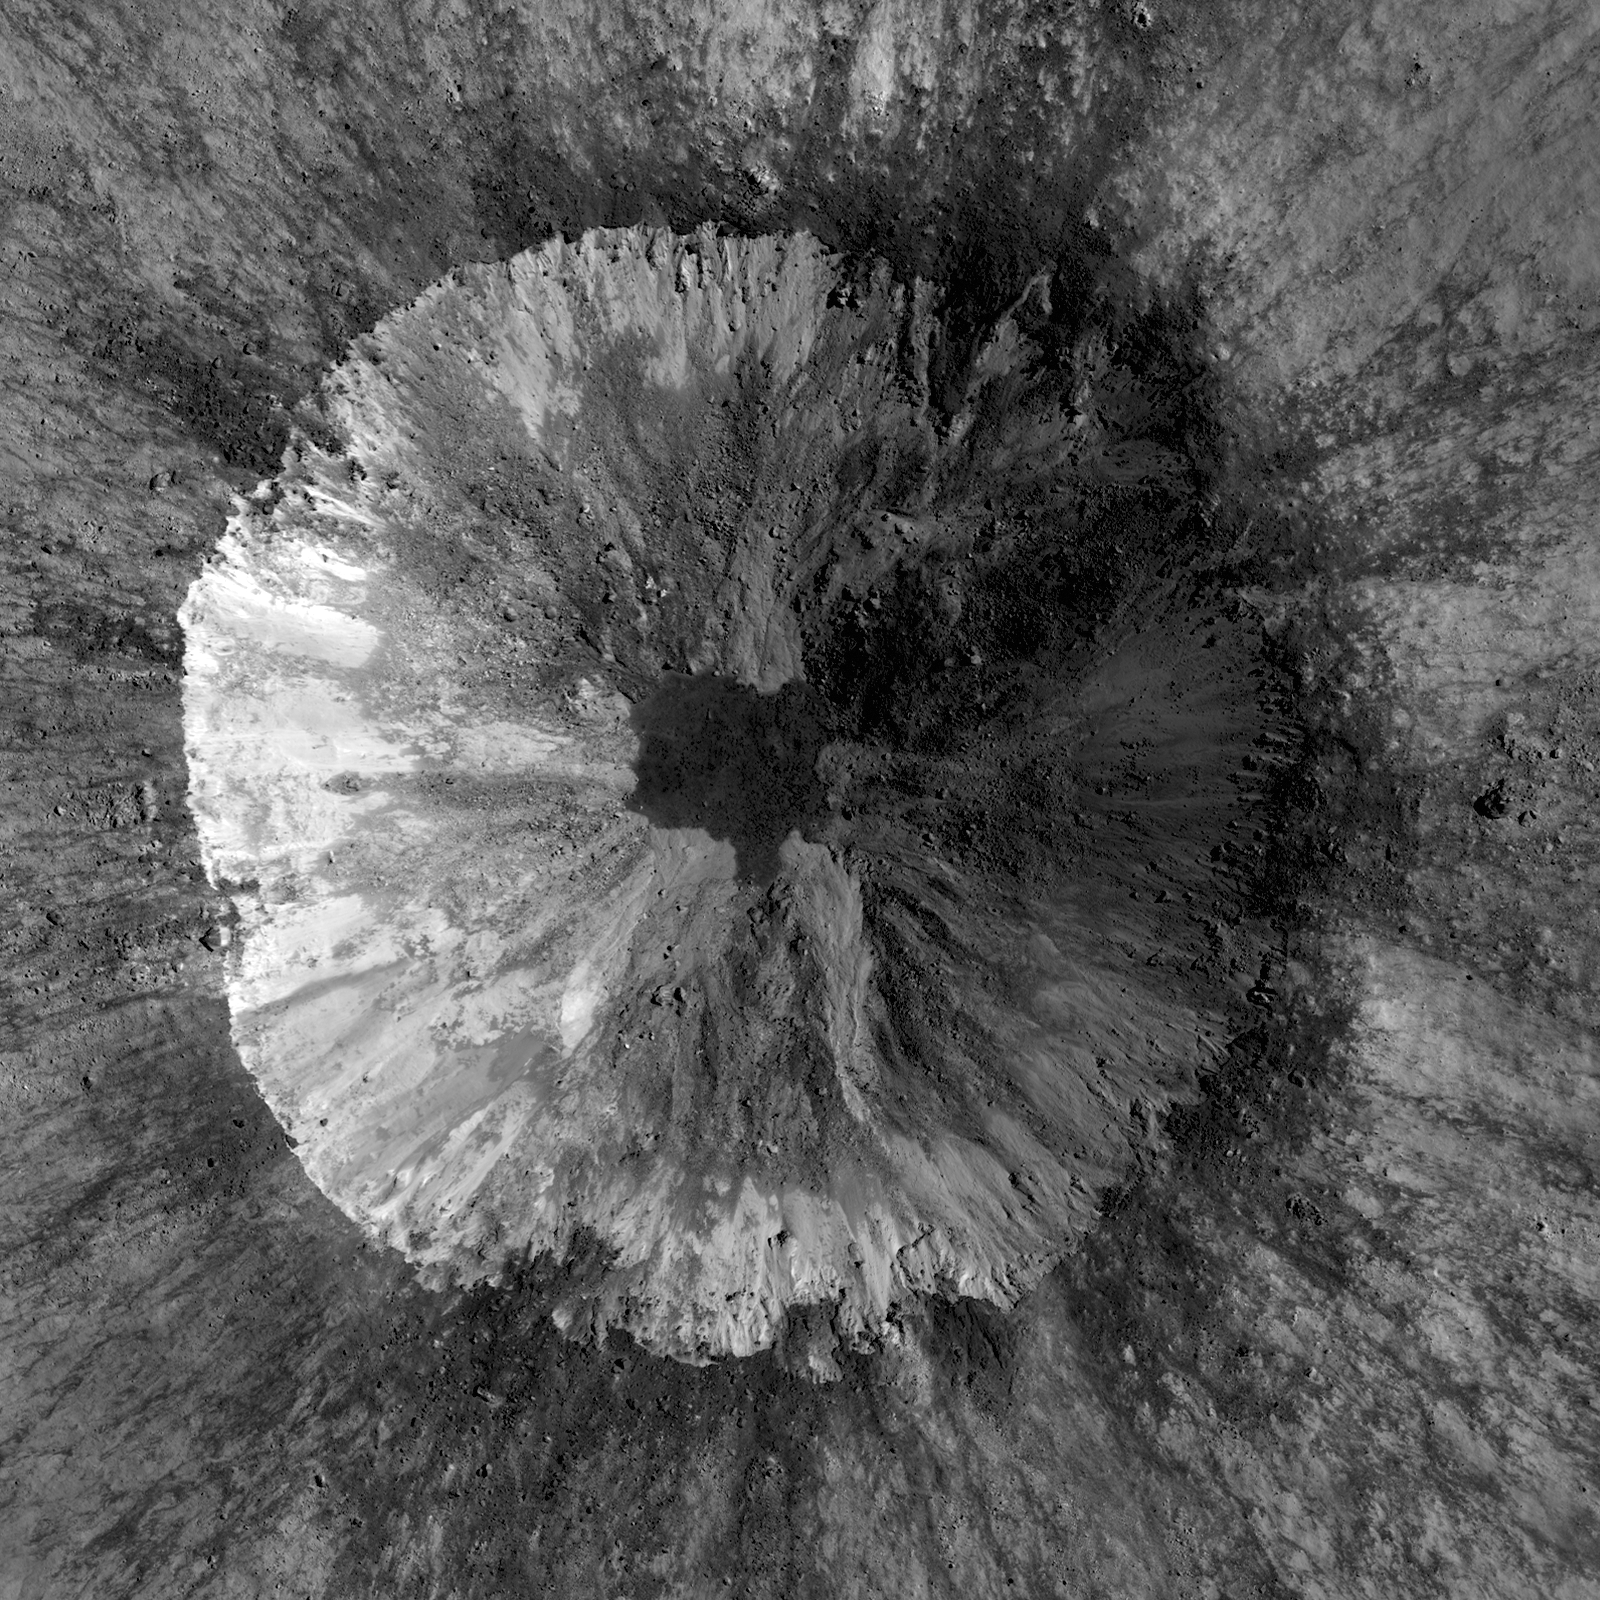
LROC Narrow Angle Camera (NAC) mosaic of an unnamed 2.3 km diameter crater, one of the two NAC stereo pairs used to create the DTM represented in the LROC Featured Image released May 2, 2012. While your brain knows the crater is concave, a depression, because of illumination and shadowing, the NAC mosaic alone can't be used to determine the elevation change from rim to floor. Image from LROC the left and right coincident frames of LROC NAC observation M143683729, resampled to 2 meters per pixel resolution for the DTM, field of view is 3.2 km across. LRO orbit 6308, November 6, 2010; from 61 kilometers. View the larger LROC complementary image HERE [NASA/GSFC/Arizona State University].
The NAC mosaic above probably looks somewhat familiar because most Copernican-aged craters have crisp crater rims, prominent ejecta blankets, mass-wasting observed on the crater walls, and often times impact melt in pools on the crater floor or dark streamers superposed on the ejecta blanket. Over time, material from the rim and crater walls slumped toward the crater floor. Some of these slumps are composed of rockier, blockier material, while others do not have entrained rubble.

Full resolution (62.58 meters per pixel) detail from LROC Wide Angle Camera (WAC) observation M176690527C (604nm) shows the subject crater under mid-afternoon illumination (incidence 64.28°), LRO orbit 11174, November 23, 2011 from 48.8 kilometers. When comparing with the LROC QuickMap 6 x 6km topography at lower right we can see the 400 meter rise in elevation, from the crater floor to the selected area's terminus just to the northeast, witnessing how the complexity of terrain's elevation is not easily visible from overhead [NASA/GSFC/Arizona State University]
There is a low-reflectance impact melt deposit on the crater floor with irregular contacts with the crater wall materials. Impact melt ponds often exhibit a relatively smooth surface because as the liquid melt cools, it seeks an equipotential surface, which is flat. But how does a scientist quantify "smooth"? Looking at the NAC, there are some debris entrained in the melt, but overall the surface looks flat. However, simply because something "looks" a certain way does not mean it is!

Simulated oblique view west from 150 kilometers over the LROC Wide Angle Camera (WAC) monochrome 100 meter Global Mosaic spread upon LOLA altimetry (ILIADS Application, Lunar Mapping and Modeling Project). The Copernican Age crater highlighted in the LROC Featured Image released May 2, 2012 is the small crater with a bright ejecta blanket at bottom center. in the farside highlands - 450 kilometers east of the central peaks of mare-filled Tsiolkovskiy crater, visible at top center [NASA/GSFC/LMMP/Arizona State University].

DTMs derived from LROC NAC stereo images are extremely useful because DTMs provide quantitative measures to complement qualitative descriptions. For the case of determining the smoothness of the impact melt pond, the slope of the crater walls and floor deposit can be calculated using the DTM. At the scale shown above, 2 m/pixel, the impact melt deposit surface is all at the same elevation and can thus be considered to be smooth. Furthermore, DTMs sometimes reveal unexpected observations! In the full frame of the LROC NAC DTM, there is a region of lower elevation to the north of the unnamed crater and a region of higher elevation to the south; these regions are not easily discerned in the LROC NAC mosaic.

Take a look at the full LROC mosaics - (DTM and NAC) - and see how the morphology you observe in the NAC image is linked with the elevation you see in the DTM.

Discover the Moon using DTMs in the DTM RDR Archive, HERE.

Direct link to today's Featured Image DTM in the RDR Archive.

Related Posts:
Barnstorming Linné crater
A Digital Terrain Model of the Orientale Basin
Precise 3D Measurements of Objects at Apollo 14Landing Site from LROC NAC Stereo Images

Tuesday, February 21, 2012

Further evidence of recent lunar geologic activity

Close-up of the "Virtanen graben" field, near the 18.29°N, 180.79°E, on the central meridian of the lunar far side. From LROC Narrow Angle Camera observation M136355592RE (LRO orbit 5228, August 13, 2010; resolution 0.66 meters from 59.85 km). This LROC NAC frame, along with M136362376, were used by Mark Robinson and colleagues at Arizona State University to create a Digital Terrain Model of the Virtanen graben in November 2010. That DTM can be explored HERE.
Images and elevation models from NASA's Lunar Reconnaissance Orbiter (LRO) appear to show the Moon's crust is being stretched, forming miniature valleys in a few small places on the lunar surface. A team of investigators will present their findings at the upcoming Lunar and Planetary Science Conference as evidence that this geologic activity occurred less than 50 million years ago, a very recent time in relation to the Moon's estimated age of roughly 4.575 billion years.

Researchers analyzing high-resolution images obtained by the Lunar Reconnaissance Orbiter Camera (LROC) have shown many small, narrow trenches typically much longer than they are wide, indicating the lunar crust is being pulled apart at these locations. These linear valleys, known as graben, form when the moon's crust stretches, breaks and drops down along two bounding faults. A handful of these graben systems have already been identified across the lunar surface and are cited as evidence the Moon may be shrinking.

"We think the moon is in a general state of global contraction because of cooling of a still hot interior," said Thomas Watters of the Center for Earth and Planetary Studies at the Smithsonian's National Air and Space Museum, lead author of a paper on this research appearing in the March issue of the journal Nature Geoscience.

"The graben tell us forces acting to shrink the moon were overcome in places by forces acting to pull it apart. This means the contractional forces shrinking the moon cannot be large, or the small graben might never form."

Full width (about 5 km wide) of LROC NAC DTM"Virtanen
graben 1
;" the small rectangle is the field of view seen in the
image above
[NASA/GSFC/Arizona State University].
The weak contraction suggests that the moon, unlike terrestrial planets, did not completely melt in the very early stages of its evolution. Rather, observations support an alternative view that only the moon's exterior initially melted forming an ocean of molten rock.

In August 2010, the team used LROC images to identify physical signs of contraction on the lunar surface, in the form of lobe-shaped cliffs known as lobate scarps.

The scarps are evidence the moon shrank globally in the geologically recent past and might still be shrinking today. The team saw these scarps widely distributed across the moon and concluded it was shrinking as the interior slowly cooled.

Based on the size of the scarps, it is estimated that the distance between the moon's center and its surface shrank by approximately 300 feet. The graben were an unexpected discovery and the images provide contradictory evidence that the regions of the lunar crust are also being pulled apart.

"This pulling apart tells us the moon is still active," said Richard Vondrak, LRO Project Scientist at NASA's Goddard Space Flight Center in Greenbelt, Maryland. "LRO gives us a detailed look at that process."

As the LRO mission progresses and coverage increases, scientists will have a better picture of how common these young graben are and what other types of tectonic features are nearby. The graben systems the team finds may help scientists refine the state of stress in the lunar crust.

"It was a big surprise when I spotted graben in the far side highlands," said co-author Mark Robinson of the School of Earth and Space Exploration at Arizona State University, principal investigator of LROC. "I immediately targeted the area for high-resolution stereo images so we could create a three-dimensional view of the graben.  It's exciting when you discover something totally unexpected and only about half the lunar surface has been imaged in high resolution.  There is much more of the moon to be explored."

DERIVATION OF ABSOLUTE MODEL AGES FOR LUNAR LOBATE SCARPS
van der Bogert, Hiesinger, Banks, Watters and Robinson, LPSC #1847

Lobate Scarp or Fluidized Ejecta (November 10, 2011)

LROC: Lunar Landslides! (October 15, 2011)

LROC: Tectonics at the edge of Procellarum (October 13, 2011)

Scarps in Schrödinger (September 28, 2011)

LROC: lobate scarp in Xenophanes (September 14, 2011)

Wrinkled Planet (May 3, 2011)

Too brief an expedition to a lobate scarp (August 24, 2010)

Moon geologically active, cooling and shrinking (August 19, 2010)

Updated map of lunar graben, lobate scarps and further more recent topographic features broadly hinting Earth's Moon is not "dead," as once assumed, but geologically active [NASA/GSFC/DLR/Smithsonian CEPS/Arizona State University].

Monday, February 6, 2012

LROC releases 57 narrow angle elevation models

False color model of the highest vents of the many Marius Hills now believed to be a single shield volcano in central Oceanus Procellarum, a region which may have remained active until 1.1 billion years ago. Nearby (bottom, north) is the tadpole head of the unofficially named "Sinuous Rille A." This area was a prime potential landing site in the Apollo era, more recently in the second tier of 50 Constellation Regions of Interest. The low profile of the Marius Hills, surrounded by relatively flat Procellarum mare, has made appreciating their anatomy difficult except after local sunrise and before local sunset when even low features cast long shadows. LROC Narrow Angle Camera photography taken from overhead and from a slewed angle in orbits before and after such opportunities has made it possible to build very high resolution models when the rare opportunity presents itself [NASA/GSFC/Arizona State University.
On January 15, the LROC team at Arizona State released 57 new high resolution digital terrain models (DTM). According to principal investigator Dr. Mark Robinson, "the new DTMs total about 170 Gbytes of data, and cover a variety of high science value targets."

"Start exploring today," Robinson urged. HERE.
The Marius Hills ROI (color strip closer to the horizon) in the context of LROC Wide Angle and Narrow Angle Camera photography showing a handful of the surrounding hills to the southwest and including the grayscale DTM of the Reiner Gamma albedo swirl over a 600 kilometer stretch of the Procellarum mare, a trail that seems to begin in those hills meandering to the famous central "eye" of Reiner Gamma, also a Tier 2 Constellation program Region of Interest and location of the Moon's most familiar crustal magnetic field. Since its discovery early in the history of nearside telescopic study observers have speculated whether the distinctive bright swirl of anomalously low optical maturity was accompanied by a topographic component. The grayscale DTM sliced through the dense "eye" of the formation appears to show nothing like a different crater count or change in elevation that explains the highly visible swirl, seemingly painted over the wide space of Procellarum mare.
The search for the once-elusive highest elevation on the lunar surface came to an end in the 21st century, first with the arrival of Japan's SELENE-1 (Kaguya) and soon confirmed by two digital elevation models under development using data from LRO laser altimetry (LOLA) and offset orbital photography from the LROC NAC and WAC instruments. Somewhat isolated from hills nearly as high along the northern outer rim of the ancient South Pole Aitken basin, north of the Korolev impact basin, this high promontory adjacent to the eastern wall of Engel'hardt crater on the Moon's farside tops out at 10,786 meters above global mean, almost 2 kilometers higher than Mt. Everest [NASA/GSFC/Arizona State University].
Explore the LROC Narrow Angle Camera Digital Terrain Models HERE.

Thursday, December 1, 2011

DLR: Flying over the three-dimensional Moon

Unnamed massif on the north-northeast rim of South Pole-Aitken basin at 22.62°S, 203.92°E, (8,550 meters above mean global elevation) is a lofty overlook of the Wisling and Plummer crater groups southwest of Korolev (top right). The remarkably short distance between the Moon's lowest spot, within Antoniadi, and it's highest point, on the rim of Engel'hardt crater, seen here on the horizon, can be traversed in the LROC WAC Digital Terrain Model (DTM) in videos downloadable at the DLR English-language website HERE [NASA/GSFC/ASU/DLR].
Although the Moon is so far the only celestial body other than Earth on which a human being has ever walked, the topography of its surface has not been studied comprehensively. This is why NASA's Lunar Reconnaissance Orbiter (LRO) has been orbiting the Moon since June 2009, using a wide-angle camera to digitally record its cratered surface. Using a total of 70,000 images, researchers at the German Aerospace Center (Deutsches Zentrum für Luft- und Raumfahrt; DLR) have now created a digital 3D model of the Moon with unprecedented accuracy and completeness. The video shows a number of virtual flights over the surface of Earth’s satellite.

The landing sites of Apollo 11, 12 and 14 are located centrally in a region depicted in tranquil blue. In these color-coded 3D images of the lunar surface, blue is used to indicate low-lying flat ground. It was not until the later missions that the US became more adventurous in the choice of a landing site. For example, the astronauts on the Apollo 15 and 17 missions were sent into regions of the Moon that posed a much greater challenge.  In the model created by the DLR Institute of Planetary Research in Berlin-Adlershof, these areas are depicted in green – indicating that these regions are at a slightly higher elevation, and are not as flat as those used for the earlier Moon landings. To make this 3D depiction possible, the wide-angle camera (LROC WAC) on board the American LRO spacecraft recorded images from an altitude of 50 kilometers. In the next step, DLR project scientist Frank Scholten from the Institute of Planetary Research evaluated the 70,000 stereo images, using special software to compare them pixel by pixel, then used the information relating to where the picture was taken and the direction of view of the camera to calculate roughly 100 billion 3D points. The result is a 3D model covering about 37 million square kilometers, which is more than 98 percent of the lunar surface and over twice the area of Russia.
Full range of the full-resolution DLR video tour of the LROC DTM. A very small section was cropped to create the view further up  [NASA/GSFC/ASU/DLR].
The Moon in focus It took a network of 40 computers two weeks of computing time to perform these elaborate calculations. The software required for this task was developed at the DLR Institute of Planetary Research and had already been employed successfully on image data from other planets; for example, the Mars Express mission. The result, known as the GLD 100 (Global Lunar Digital Terrain Model), delivers elevation figures at 100-metre intervals right across the surface of the Moon. "Over the last few years, planetary research has been focusing primarily on other planets, Mars being just one example. The Moon remained in the background during this period," explains Scholten. The team led by DLR planetary researcher Jürgen Oberst performed its measurements of the Moon in several different ways. Camera imagery was complemented by data from the Lunar Orbiter Laser Altimeter (LOLA), which employs laser pulses to measure elevations on the lunar surface; these were then compared with the data in the GLD100 elevation model. These two methods complemented one another; the laser instrument provides extremely accurate elevations, but covers only part of the lunar surface. Gaps of several kilometers still exist, particularly in regions near the lunar equator. The cameras on board the LRO compensate for this because they are able to completely cover large areas. "Our elevation model will help planetary researchers to examine questions for which an accurate and complete knowledge of the topography of the Moon is important," says Scholten. With this data, scientists wish to investigate a number of things, including whether the central latitudes of the Moon are home to any deep craters where water ice might exist in the permanent shadows - in a similar way to the regions close to the two poles.

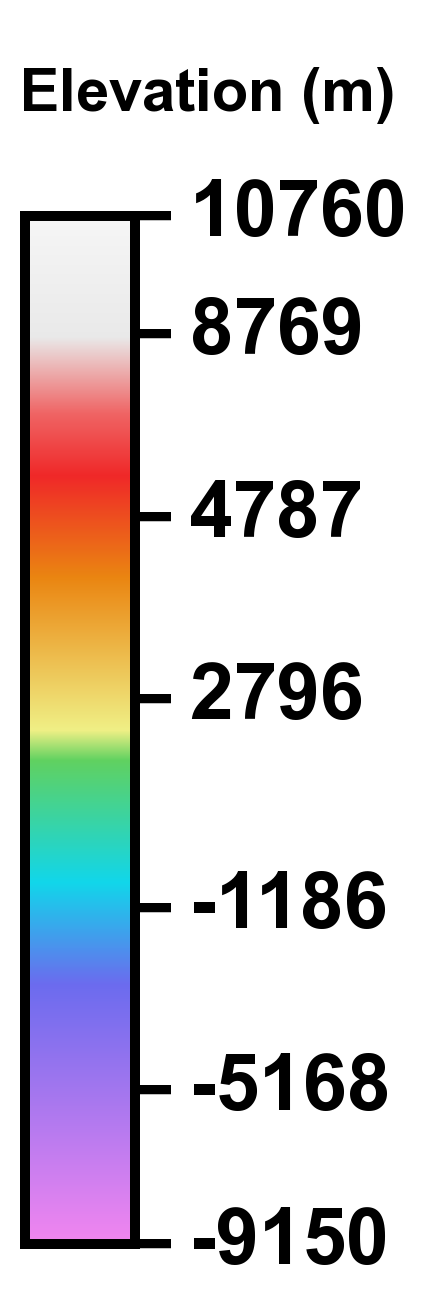
The elevation model clearly depicts the diverse landforms – for example, mountains, craters and rilles. The color-coded view depicts the third dimension – altitude – in colors ranging from blue (roughly -9100 meters) to red/white (roughly +10,760 meters). Whereas the 'front', or Earth-facing side of the Moon, with its flat plains, or mares, and the Apollo landing sites, appear for the most part in blue and green, the hitherto relatively unexplored far side of the Moon – the side not visible from Earth – has its high ground depicted in red. This far side is home to the lowest as well as the highest points on the Moon. "This depiction clearly shows how gigantic and deep the South Pole Aitken Basin is," explains DLR planetary researcher Ulrich Köhler. This basin has a diameter measuring about 2500 kilometers, making it the largest known impact crater in the Solar System. It is about 13 kilometers deep "and is perhaps a window on the distant past of the Moon because it may extend down to the original mantle," suggests Köhler. Using the data from this elevation model, scientists can also simulate low-altitude flights across the lunar surface. The 'sightseeing' flights over the Apollo 15 and Apollo 17 landing sites show clearly that the astronauts landed close to mountain ranges some several thousand meters in height and set out from there to explore the Moon.

Hadley Rille Valley and the landing site of the 1971 Apollo 15 expedition, a second still from the high resolution DLR tour of the LROC WAC Digital Terrain Model [NASA/GSFC/ASU/DLR].
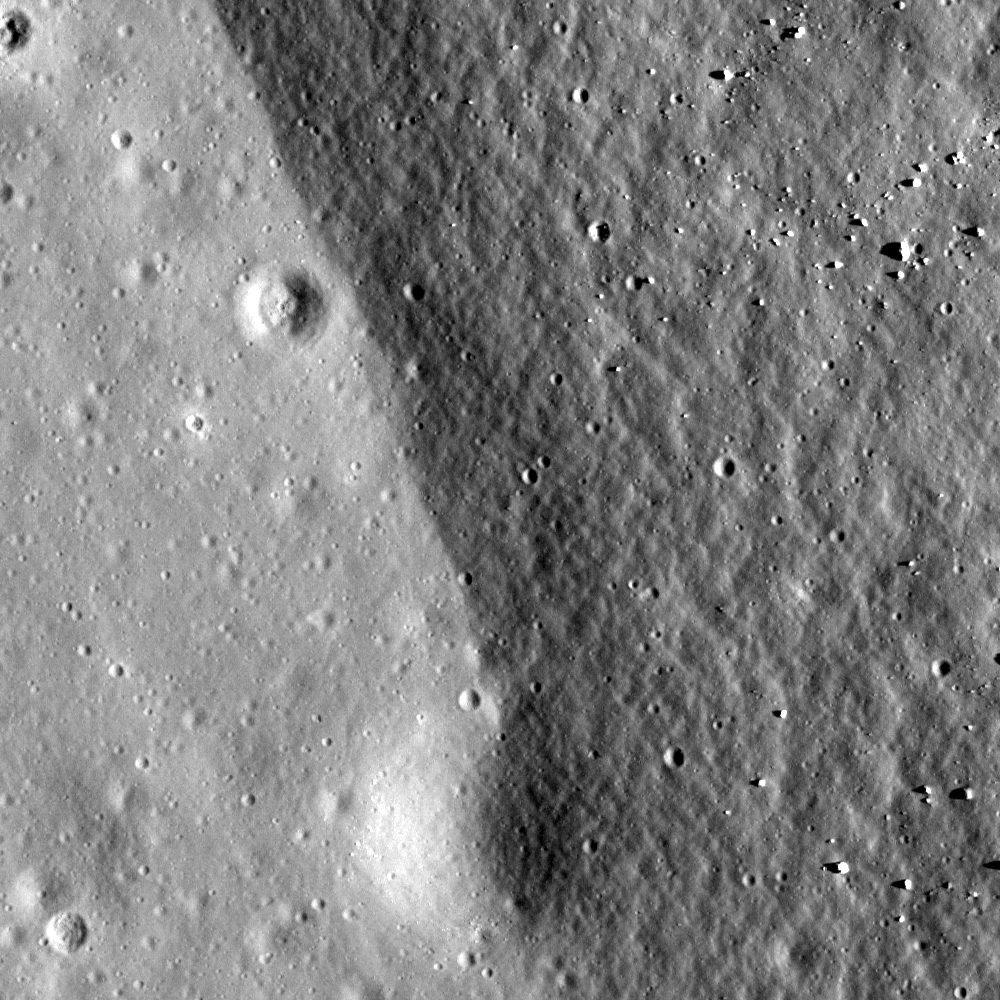
"With this data, we are laying important foundations for future Moon missions, whether manned or unmanned," states lunar researcher Ulrich Köhler. "These 3D maps of the Moon enable us to better evaluate future landing sites.” There are a total of seven instruments on board the NASA orbiter; DLR Space Administration funds the German members of the LRO team. With each new orbit of the Moon, and with each new image of the lunar surface, the planetary researchers are able to further refine their 3D model of Earth's companion.

"Every month, we cover the entire surface of the Moon once more with the camera,” explains Frank Scholten. “This data is included in our model on a continuous basis, which enables us to view the surface in ever greater detail."

Download and/or view the DLR tour in one of three available resolutions, HERE.

Reference: LROC's New Global Lunar Topography

Wednesday, November 16, 2011

LROC's new Global Lunar Topography

Full hemisphere example of the newly released Lunar Reconnaissance Orbiter Camera (LROC) Wide Angle Camera (WAC) color-shaded relief of the lunar farside, derived from their global Digital Terrain Model. View the larger image accompanying their November 16 announcement, HERE [NASA/GSFC/DLR/Arizona State University].
Mark Robinson
Principal Investigator
Lunar Reconnaissance Orbiter Camera (LROC)
Arizona State University


Global topography -- a boon to lunar scientists and explorers around the world! Today the LROC team releases Version 1 of the Wide Angle Camera (WAC) topographic map of the Moon. This amazing map shows you the ups and downs over nearly the entire Moon, at a scale of 100 meters across the surface, and 20 meters or better vertically. Despite the diminutive size of the WAC (it fits in the palm of one's hand), it images nearly the entire Moon every month. Every month? Yes! Redundant data? No! Each month the Moon's lighting changes, so the WAC methodically builds up a record of how different rocks reflect light under different conditions, and adds to the LROC library of stereo observations. The WAC really is the little camera that could! It was built by Malin Space Science Systems (MSSS) in San Diego CA, and is very similar to another MSSS camera (MARCI) now in orbit around Mars.

Left: LROC Wide Angle Camera attached to a test setup shortly before mounting on the spacecraft. Right: WAC being handed up to engineers for integration with LRO. View the released image HERE (photos M. Robinson).
The WAC has a pixel scale of about 75 meters, and with an average altitude of 50 km, a WAC image swath is 70 km wide across the ground-track. Because the equatorial distance between orbits is about 30 km, there is nearly complete orbit-to-orbit stereo overlap all the way around the Moon, every month. Using digital photogrammetric techniques, a terrain model was computed from this stereo overlap. The new topographic model was constructed from 69,000 WAC stereo models. Due to persistent shadows near the poles it is not possible to create a complete WAC stereo map at the very highest latitudes. Fortunately, the LRO Lunar Orbiter Laser Altimeter (LOLA) excels at characterizing the topography of the poles. Since the LRO orbits converge at the poles and LOLA ranges to the surface with its own lasers, LOLA provides a very high resolution topographic model of the poles. This LOLA map can fill in the WAC "hole at the pole".

Detail from WAC topography model, shades of gray represent elevation. Darker values are lower terrain and brighter values are higher points. (Image center is near 19.1°N, 175.3°E) View the much larger demonstration image HERE [NASA/GSFC/DLR/Arizona State University].
How is a digital topographic map created from stereo images? The WAC stereo images were compared one against another by pattern-matching a moving box of pixels until the best fit was found between two images with different viewing angles. Best fit pixel positions are combined with the LRO orbit position and the WAC viewing angles to define two 3D rays (lines of sight). The intersection point of these rays defines the location and the elevation of the point on the surface. Since the correlation box is bigger than 100 meters, surface details at the 100-meter scale are not fully resolved in a single stereo pair. However, each 100 meter square has an average of 26 stereo points within it (for a planet-wide total of 100 billion points), which helps to sharpen the elevation estimate. The resolution, in a formal sense, is probably close to 300 meters, and the accuracy of the elevations is estimated to be about 10 to 20 meters. This new map is called the Global Lunar DTM 100 m topographic model, or “GLD100”,  and covers 79°S to 79°N latitudes, 98.2% of the entire lunar surface. The WAC topography was produced by LROC team members at the German Aerospace Center (DLR).

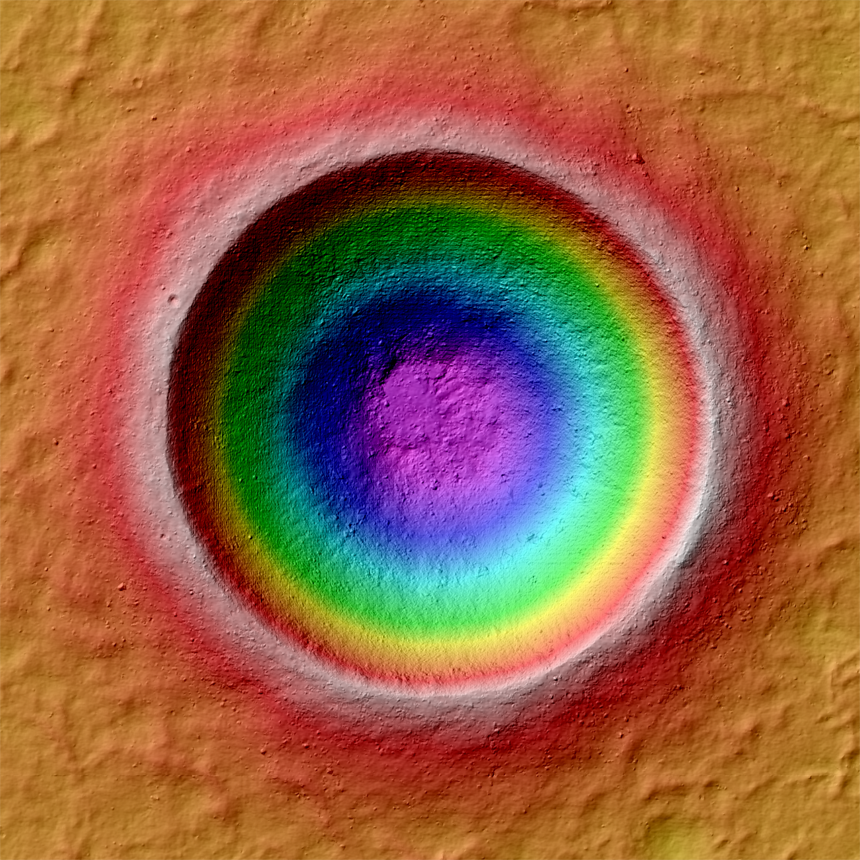
Color-shaded relief detail of the same region in the figure above. View the spectacularly detailed and larger release image HERE [NASA/GSFC/DLR/Arizona State University].
Shaded relief images can be created from the GLD100 by illuminating the surface from a given Sun direction and elevation above the horizon, and to convey an absolute sense of height the resulting grayscale pixels are painted with colors that represent the altitude. Visualizations like these allow scientists to view the surface from very different perspectives, providing a powerful tool for interpreting the geologic processes that have shaped the Moon
.
And the LROC WAC Global monochrome mosaic also corresponding to same area, with the accompanying larger and more detailed release image available HERE [NASA/GSFC/DLR/Arizona State University].
The large irregularly shaped Buys-Ballot crater, seen in the three images above, is about 47 km by 62 km. The WAC topography shows the flat floor to lie some 3100 meters below the western rim and 4600 m below the eastern rim. The central peak rises about 800 m above the floor. For comparison the width and depth of this crater are larger than those of the Grand Canyon, AZ.

Topographic profile (highly exaggerated) across Buys-Ballot crater, note the flat floor [NASA/GSFC/DLR/Arizona State University].

Why is the floor of the crater so flat? The WAC mosaic holds an important clue -- note how dark the floor is. On the Moon, dark (low albedo) material is typically basalt, which is dark because it is relatively rich in iron (mafic minerals). On the Moon, basalts are erupted as very hot lavas, making them very fluid, thus they tend to spread out and flood local topographic lows. From the topography and WAC image data, one can make a confident interpretation that the floor of this unusual crater is most likely flooded with basalt. But why such a small eruption? Most flood basalts on the nearside cover vast expanses of lunar terrain, but why not on the farside? Another mystery for future lunar explorers to unravel!

The area shown here is only a tiny portion of the Moon: see if you can find Buys-Ballot in the full resolution hemispheric view.

What improvements can be made over this first release of the LROC WAC GLD100? The current model incorporates the first year of stereo imaging, and there is another year of data that can be added to the solution. These additional stereo images will not only improve the sharpness (resolution) of the model but also fill in very small gaps that exist in the current map. The LROC team has made small improvements to the camera distortion model, and the LOLA team has improved our knowledge of the spacecraft position over time. These next generation steps will further improve the accuracy of Version 2 of the LROC GLD100 topographic model of the Moon.

Explore the new LROC GLD100!

And here are Direct links to color shaded relief visualizations (relatively large *.tif image files*):


Orthographic projection centered at 0° longitude and 0° latitude.
Orthographic projection centered at 60° longitude and 0° latitude.
Orthographic projection centered at 120° longitude and 0° latitude.
Orthographic projection centered at 180° longitude and 0° latitude.
Orthographic projection centered at 240° longitude and 0° latitude.
Orthographic projection centered at 300° longitude and 0° latitude.
Orthographic projection centered at 0° longitude and 90° latitude.
Orthographic projection centered at 0° longitude and -90° latitude.

Color scale legend for LROC Color Shaded Relief
. View the full size graphic, HERE [NASA/ GSFC/ DLR/ Arizona State University].
*NOTE: OS X (and many other) users may prefer opening these large TIFF files directly within a browser. Please select and "Save" to local storage media, allowing the option of opening these files in an image viewer or editing program.

Monday, October 17, 2011

LROC Quickmap improvements dazzle

Roof top of the Moon (10,786 meters (35,387 feet) above global mean elevation), as determined by LRO investigators a year ago, is high on the lopsided eastern rim of Engel'gardt crater (5.7°N, 159.0°E), in the farside highlands; 44 km-wide and seen here immediately left of center in a field of view roughly 325 km wide and includes the northern Korolev basin (below). All these features are difficult to spot in cameras, not least of the reasons being in an area criss-crossed with superimposed bright rays. After this past weekend, however LROC premiered an overlay with a variable opacity showing their Global Wide Angle Camera (WAC) digital terrain model (DTM) in false color (here seen at the default 30% over the hybrid LROC NAC and WAC Global mosaic) is now an integral part of the ACT-REACT LROC Quickmap feature on their popular website, improving the map's usefulness when searching through LROC's vast data contribution to the Planetary Data System immeasurably [NASA/GSFC/Arizona State University].
An hour "playing" with the 'new and improved' LROC Quickmap enabled us to assemble this exploration of the tenuous connection between the Marius Hills and the Reiner Gamma albedo feature (with it's attendant crustal magnetic anomaly), both familiar features in Oceanus Procellarum. It's a place to begin digging deeper into the three dimensions of data from LROC already available to the public, especially with the new addition of the LROC DTM. Is Reiner Gamma's long swirl and it's intense local magnetism a result of a sub-surface flash flood of volcanic material? With the new LROC DTM overlay, it's much easier to demonstrate those features with little to no corresponding topographic expression and others nearly invisible except at very high sun angles [NASA/GSFC/Arizona State University].
Not very far from the Moon's highest point is what appears to be it's lowest, within the South Pole-Aitken basin, at the bottom of the large crater on the southern floor of Antoniadi (or, near 70.38°S, 187.2°E, over 9,000 meters below global mean elevation). This mix of LROC WAC imagery overlaid with the false-color WAC DTM adds more than just a feeling of depth of field. Most camera views of the floor of Antoniadi, and mare-filled features everywhere else on the Moon, the surface looks misleadingly flat. Even at 500 meter per pixel resolution, the wide deep flat floor of Antoniadi shows an uneven, almost "dune-like" roughness, lost in surveys based on albedo alone [NASA/GSFC/Arizona State University].
Another instant study increases the opacity of the LROC WAC DTM overlay from the base WAC optical mosaic of a nearside portion of the lunar south pole environs, offering an informative look at one of the Moon's last terra incognitas [NASA/GSFC/Arizona State University].
Related Post: LROC Quickmap

Wednesday, April 20, 2011

Lava Flows Exposed in Bessel Crater


Spectacular example of layering exposed just inside the rim of Bessel (21.8°N, 17.9°E), a familiar 17 kilometer-wide nearside crater in Mare Serenitatis. LROC Narrow Angle Camera (NAC) observation M135073175R, field of view above is 500 meters; LRO orbit 5029, July 29, 2010; solar incidence 13° See the Full-Size LROC Featured Image, HERE [NASA/GSFC/Arizona State University].

Sarah Braden
LROC News System

The outcrops exposed on the interior wall of Bessel crater (~16 km in diameter) are remarkable since they are most likely preserved layering of mare basalt. Today's Featured Image shows a portion of the northern wall, which contains multiple layers that probably represent discrete lava flow deposits in Mare Serenitatis. Over time, large, but relatively thin, lava flows spread across the extent of Mare Serenitatis.

Lunar pits imaged by LROC also give us a good look at basalt flow layers. Boulders broken off of the mare layers tumble down the wall toward the floor of the crater.

Bessel crater is named after Friedrich Bessel, the developer of Bessel functions. By measuring the thickness of layering found in Bessel and other craters, scientists can put constraints on the thickness of individual lava flows. What else can Bessel crater tell us about Mare Serenitatis?


The original LROC Wide Angle Camera (WAC) 100 meter/pixel monochrome mosaic context image is seen here draped over the high-resolution Digital Terrain Model of the Apollo science mission corridor, available to users of Google Earth. Over that the LROC NAC frame was added (along with the Featured Image, barely visible inside the northwest rim. Bessel's interior shows slumping of material from the walls onto the floor [NASA/GSFC/Arizona State University].

Explore the entire NAC frame!

Related images:
Linne Crater
Dark streaks in Diophantus crater
Kepler's Rim


The view from the northwest floor (actually standing on slumped material) gazing up more than a kilometer along the longitudinal length of LROC NAC frame M135073175R and the location of the LROC Featured Image, almost to the crater rim (beyond line of sight). The Apollo Corridor was photographed in detail during the final Apollo "J" science missions, allowing for an assembly of a detailed terrain model, a method now being applied to the entire Moon by the LROC, LOLA and other instrument teams operating the Lunar Reconnaissance Orbiter.


Hopping digitally up to the rim of Bessel for a view south to the opposite rim, from a vantage near the location of the Featured Image. Similar lava layers are exposed at the same height 16 kilometers away. The southern Mare Serenitatis spreads out beyond. Examining LROC photography in this way demonstrates the global potential of the vast data being still being collected by LRO science teams, already many times over more information than all previous deep space missions combined.

Thursday, April 7, 2011

Interior Rim of Flamsteed P


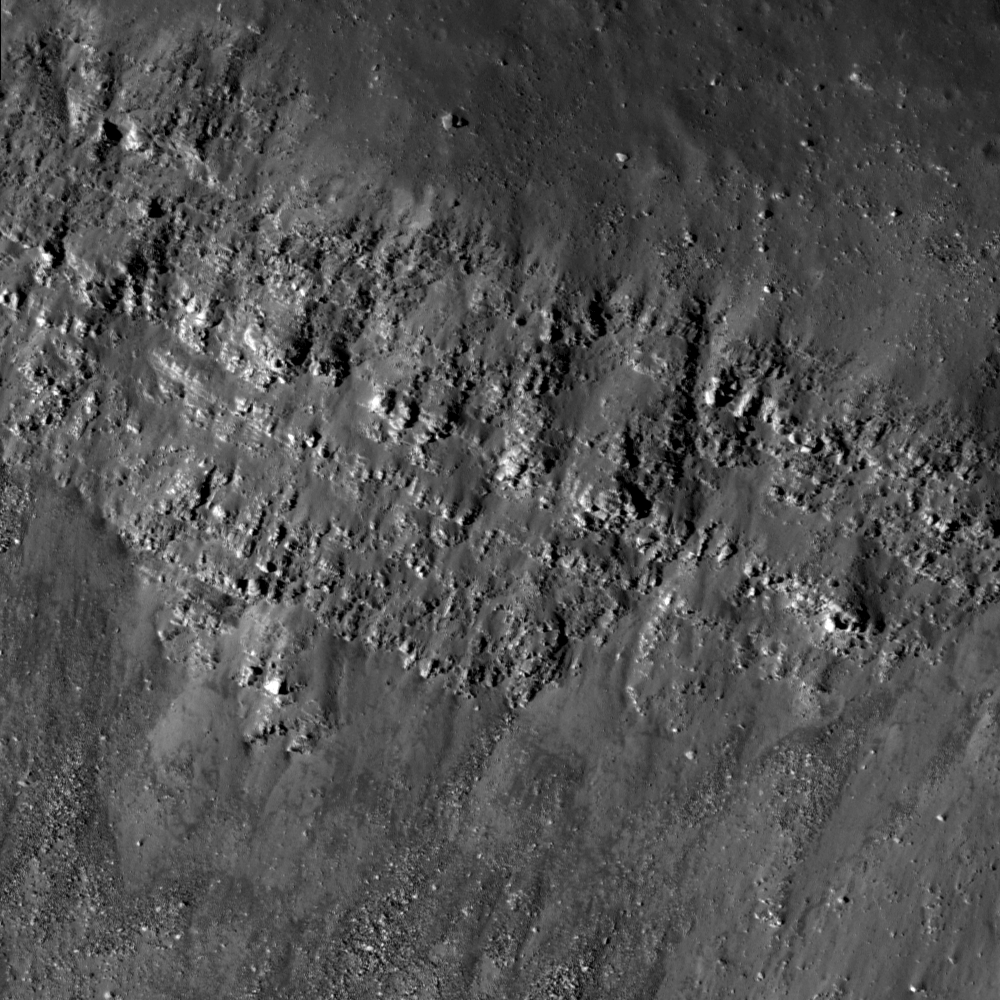
Boundary of buried crater rim and mare basalt at Flamsteed P, Illumination is from west at an angle of 60°, field of view is 500 meters; from LROC Narrow Angle Camera (NAC) observation M114233793R, LRO orbit 1968, November 30, 2009. View the full-size Featured Image, HERE. [NASA/GSFC/Arizona State University].

Hiroyuki Sato
LROC News System

Today's Featured Image displays a portion of eastern rim of Flamsteed P crater, located in southern Oceanus Procellarum. The rough and darker right side corresponds to the rim slope, and the brighter and smoother area to the left is the younger mare basalt. Flamsteed P's interior was mostly filled by mare basalts and all that remains are portions of its rim showing as discontinuous ridges (see WAC context image below).

In terms of local timeline of events (geochronology), following the formation of Flamsteed P, mare basalt flooded its interior and exterior. Later a small crater (110 m diameter) formed just at the boundary between the mare and crater rim (bottom of today's Featured Image). This small crater is half covered by the older rim unit. Does this make sense? Even though the small crater is much younger than the Flamsteed P rim it is buried by rim materials that slid downhill after the crater formed. What cause the regolith to move? Perhaps moonquakes generated by internal stresses or nearby impact events. Or perhaps a slower process of downhil creep caused by thermal cycling of the regolith (soil). We have much to learn about the Moon - the next frontier!


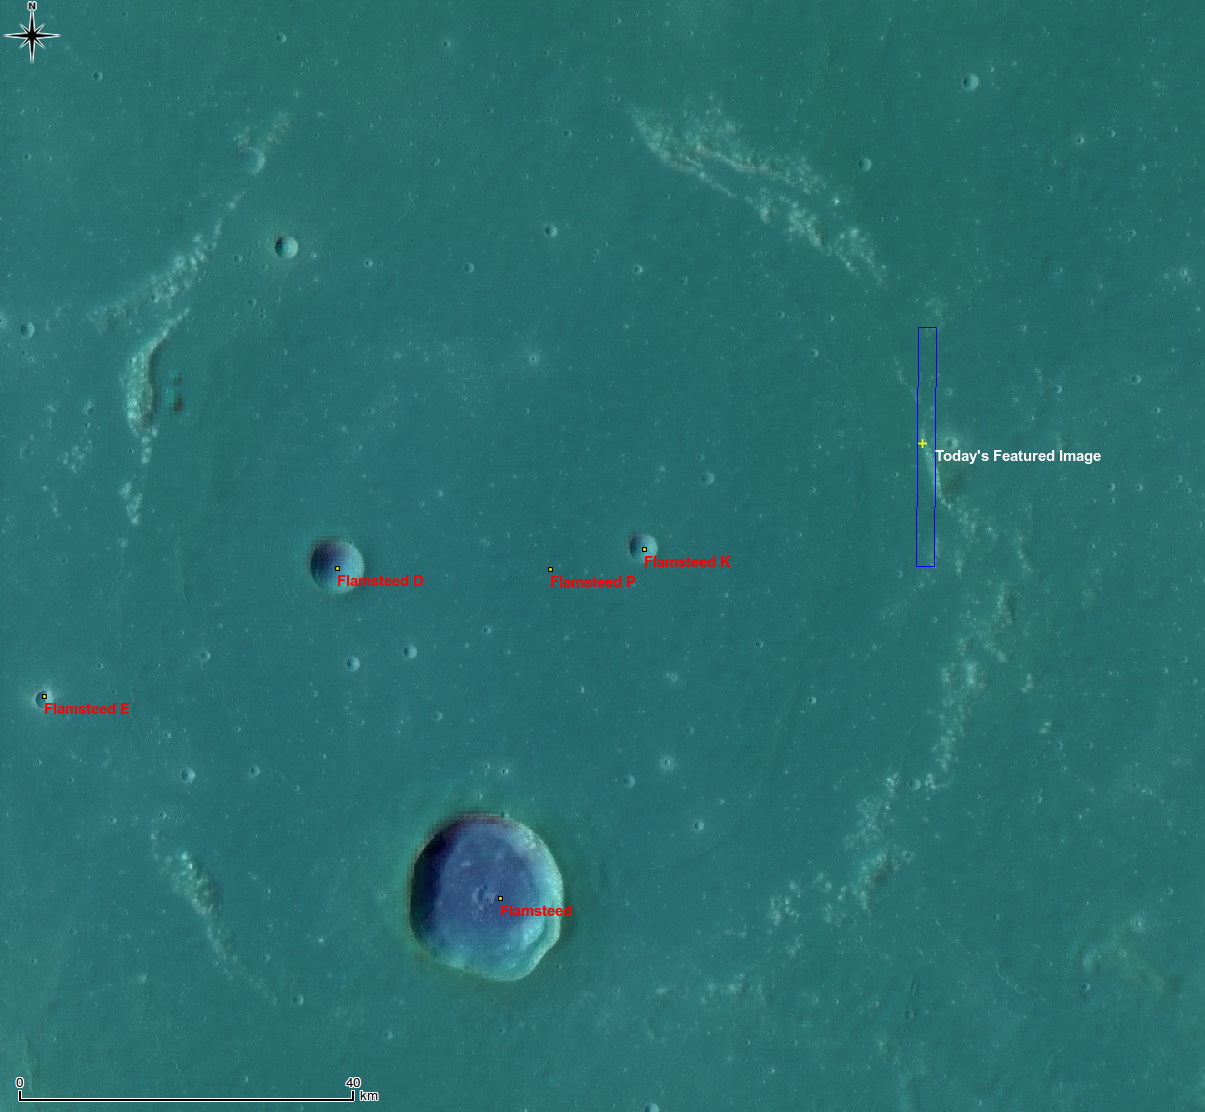
Whole of Flamsteed P, yellow cross and blue rectangle indicate the locations of the April 6, 2011 LROC Featured Image and the NAC frame from which is was taken. False color image from the Digital Terrain Model (DTM) centered at 3.15°S, 315.96°E. A LROC Wide Angle Camera (WAC) mosaic at 100 meters per pixel resolution is overlaid by LROC WAC DTM at 500 meters per pixel. View the full-size context image HERE [NASA/GSFC/Arizona State University/DLR].

The topographic color was produced as a by-product of stereo analysis of the WAC global dataset. Producing the global Digital Elevation Model (DEM) is a big job being led by LROC team members at the German Aerospace Center (DLR; English version) in Berlin.


Flamsteed P also hosts the first United States spacecraft to soft-land on another world, on June 2, 1966. The sentinel Surveyor 1, visible in this illusion of a 500 meters high "flyover" of LROC NAC images of the spacecraft's shadow on the ancient mare-inundated crater's interior. The northern rim of Flamsteed P is just apparent on the horizon [Google Earth/NASA/USGS/GSFC/Arizona State University].

Explore the boundary of mare basalts by viewing the full NAC frame!

Related posts:
Archimedes - Mare Flooded Crater
Wrinkle Ridges in Aitken Crater
Volcanoes in Lacus Mortis
Relative Timing of Geologic Events in Mare Frigoris
Surveyor 1 - America's first soft lunar landing


This 15 percent reproduction of a 6100 x 8200 mosaic from 43 individual images from Astronominsk hardly does it justice. You own it to yourself to see the original, captured in August 2010, just to see if you can locate Flamsteed P, a familiar target for even modestly-equipped amateurs [Goryachko, Abgarian & Morozov, Minsk, Belarus].


And here's the line-of-sight view of Flamsteed P as seen from Earth, not close-up but at full-resolution from the Astronominsk. The contact zone between the eastern rim of the nearly buried 100 kilometer-wide crater, discussed in the LROC Featured Image, can be spotted with little effort [Goryachko, Abgarian & Morozov, Minsk, Belarus].

Tuesday, March 15, 2011

Barnstorming Linné crater


Color coded shaded relief map of Linné crater (2.2 km diameter) created from an LROC NAC stereo topographic model. The colors represent elevations; cool colors are lowest and hot colors highest [NASA/GSFC/Arizona State University].

Mark Robinson
Principal Investigator
Lunar Reconnaissance Orbiter Camera
Arizona State University


Linné (27.7°N, 11.8°E) is a very young and beautifully preserved impact crater. LROC stereo images provide scientists with the third dimension - information critical for unraveling the physics involved in impact events. The LROC science team presented a first analysis of Linné crater topology at the Lunar and Planetary Science Conference last week.

The high resolution topographic model also provides the means to make synthetic views of the crater from any angle. By creating hundreds of such views and slightly changing the view point for each image a dramatic fly around movie appears on the screen.


Today the LROC team released a set of NAC stereo derived map products. LROC NAC Digital Terrain Models (DTM) are made from geometric stereo pairs (two images of the same area on the ground, taken from different view angles under nearly the same illumination). LROC was not designed as a stereo system, but can obtain stereo pairs through images acquired from two orbits (with at least one off-nadir slew). Off-nadir rolls interfere with the data collection of the other instruments, so LROC slew opportunities are limited to four per day.


Reduced resolution (2 meter pixel scale) mosaic of Linné, context for the location of the higher resolution images accompanying LROC Featured Image "Landmark Linné of Serenitatis," July 7, 2010. Linné (27.7°N, 11.8°E)is a landmark crater for amateur observers minimally equipped with 200mm reflecting telescopes. As with most such observations, Linné is most easily spotted when highlighted by the lengthy shadows of local sunrise or sunset, six days after a New Moon or five nights after Full [NASA/GSFC/Arizona State University].

To a generate a DTM, we use a combination of the USGS Integrated Software for Imagers and Spectrometers (ISIS) and SOCET SET from BAE Systems. ISIS routines ingest the image files, perform a radiometric correction, and export to a format SOCET SET accepts. Next an analyst runs through several procedures, including detailed quality control, that take about a week to complete a DTM.

Once a DTM is complete we make derived products: orthorectified image, shaded-relief image, color shaded relief image, color slope map, and a confidence map. An orthorectified image has all topographical and camera distortions removed. These images are cartographically true and can be used to measure accurate distances. A shaded-relief generated using the DTM simulates the Moon's surface with a light source casting shadows on the terrain. Color coded elevations are draped on the shaded relief to form the color shaded relief map. Finally, slopes derived from the DTM are color coded to help users better discriminate subtle changes in elevation. A confidence map indicates the quality of the elevation estimate at each pixel. The standard PDS products include the DTM and orthorectified images in two resolutions (resolution of the DTM and resolution of the original images), and the confidence map. Also the shaded-relief, color shaded-relief, color slope map, and DTM are provided in GeoTIFF format.

For more information on the methodology and preliminary error analysis of the DTMs, see Tran et al. 2010.

Explore the full resolution color shaded relief map and plan your own expedition to Linné crater.

Make sure and visit last Friday's Featured Image and watch the Moon rotate!