Showing posts with label DIVINER. Show all posts

Monday, February 2, 2015

LRO could remain in present orbit 7 or more years

Because the Moon is lumpy and uneven, it's possible nothing has ever been in close-orbit around our companion planet as long as the Lunar Reconnaissance Orbiter. Certainly nothing built by humans. Few deep space missions have delivered as much return on their investment. The sheer volume of data returned by LRO exceeds all deep space missions ever launched combined, several times over [NASA/GSFC/SVS].


THE SECOND EXTENDED SCIENCE MISSION
FOR THE LUNAR RECONNAISSANCE ORBITER:
STATUS, SCIENCE GOALS, AND DATA DELIVERIES

Noah E. Petro and John W. Keller
NASA Goddard Space Flight Center
Solar System Exploration Division

The Lunar Reconnaissance Orbiter (LRO) has been orbiting the Moon for over five years. In that time, data from the seven instruments onboard the spacecraft have made significant advances in our understanding of the Moon and its environment. In September 2014 LRO completed its first Extended Science Mission (ESM) and began a second ESM (ESM2). 

During the both ESM and ESM2, LRO has been in a quasi-stable, eccentric orbit of ~40 x 180 km with a periapse near the South Pole (Figure 1). This orbit enables high resolution measurements around the South Pole. 

The LRO Project is considering a maneuver in early 2015 to lower the periapse in order to further improve measurements over the South Pole, particularly by the LOLA instrument. Based on the current annual consumption of fuel, the spacecraft could remain in its current orbit for at least 7 more years.
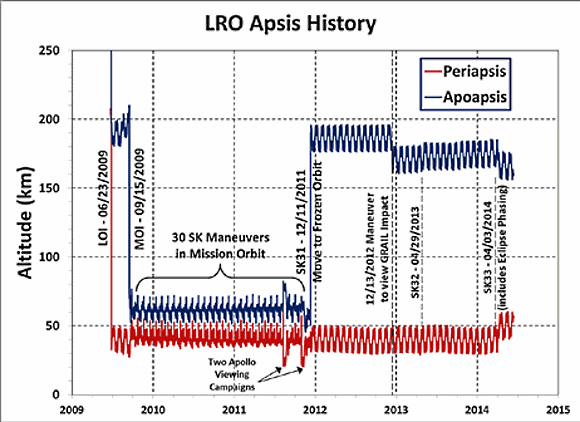
FIGURE 1. Orbital history of LRO since arriving at the Moon in 2009. LRO now employs yearly station keeping (SK) maneuvers in order to maintain its orbit. There are also periodic momentum unload burns that use small quantities of fuel.
LRO Operations: As part of the approval for continued operations, LRO was directed by NASA HQ to terminate operations of the Mini-RF instrument. All of LRO’s remaining six instruments are operating nominally, and have experienced no significant degradation since beginning the ESM over two years ago.

During extended operations the LRO spacecraft has performed exceptionally well, with 98.4% uptime during the life of the mission. LRO retains sufficient fuel quantities so that its current orbit could be maintained for at least 8 years, if not longer.

LRO Science In ESM2: An overarching theme of ESM2 for LRO is that of change. A number of measurements have shown changes to the lunar surface and to its environment. LRO will focus on the five following themes that each build on prior observations from LRO, LADEE, GRAIL, and the Moon Mineralogy Mapper. Each theme has numerous questions that are address, an example few are given here.
  1. Transport of Volatiles. How are volatile elements and compounds distributed, transported, and sequestered?
  2. Contemporary Surface Change. What causes changes in the flux and intensities of meteoroid impacts onto terrestrial planets.
  3. Regolith Evolution. Characterize planetary surfaces to understand how they are modified by geologic processes.
  4. Probing the Interior from Observations of the Surface. Characterize planetary interiors to understand how they differentiate and evolve from their initial state
  5. Interactions with the Space Environment.  How is surface material modified exogenically? How do exospheres form, evolve, and interact with the space environment?
LRO Data: The LRO instrument teams will continue to deliver data to the PDS every three months. As of the beginning of 2015 over 575 Tb of data have been placed into the PDS [1]. This data volume contains a range of products, including higher level maps, mosaics, and derived products. The PDS has made available the Lunar Orbital Data Explorer [2], a mapbased tool to search for finding and downloading PDS science data of LRO as well as other recent lunar missions.

In addition to the PDS holdings, several of the LRO instrument teams have additional products and tools available on their websites (Table 1).

Several global map products have recently been added to the PDS, here we highlight a few that are new in the last year. The Mini-RF team has assembled a global mosaic of their monostatic measurements [3].

For the first time we have global radar data for the Moon, data that clearly shows variations in rock abundance and surface texture over both the near and farside (Figure 2).

FIGURE 2. Mini-RF global mosaic of the Circular Polarization Ratio (CPR), one of the number of Mini-RF mosaic products now available online.
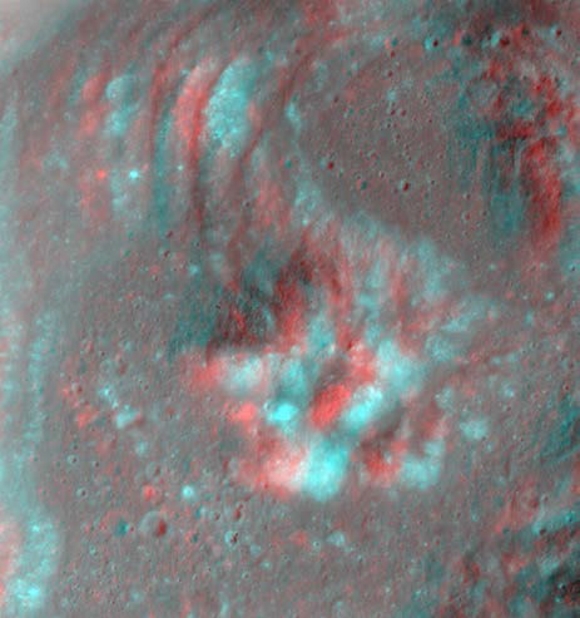
The LROC team regularly adds new products to the PDS via the team webpage (Table 1), including shapefiles, global mosaics, NAC-derived DEM’s, and NAC mosaics of selected targets. Recently the LROC team has made available a number of anaglyphs (Figure 3) showcasing the ability of the LRO spacecraft and the LROC team to precisely target the NACs.

FIGURE 3. Red-Blue anaglyph of the central peak of Euler crater.  The LROC team has made a number of anaglyphs available on their website (Table 1).
The LAMP team has a number of polar products available, including FUV ratio maps of both poles (Figure 4). These following maps are available at a resolution of 240 meters per pixel; Lyman-α (119.57–125.57 nm), Long (130–190 nm), On-band (130–155 nm), Off-band (155–190 nm), H2O Absorption Feature Depth Maps made by a Ratio map of on/off band.

FIGURE 4. LAMP Lyman-α map of the South Pole. LRO has focused on volatiles at the South Pole since arriving at the Moon 5+ years ago.
Table 1. LRO teams and their websites

LRO Project

Outreach

CRaTER

Diviner

LAMP

LEND

LOLA

LROC

Mini-RF

Use LRO Data!

The LRO Project has begun holding a series of data users workshops with the goal of helping the community work with the large volume of LRO data. Presentations given at the workshops are archived at the LRO website [4]. Questions regarding the access and use of LRO data can be directed to the authors of this abstract.

References:  [1] LRO PDS Archive, (http://pdsgeosciences.wustl.edu/missions/lro/).
[2] Lunar Orbital Data Explorer, (http://ode.rsl.wustl.edu/moon/).
[3] Cahill, J. T. S., et al., (2014) Icarus, 243, 173-190.
[4] LRO Data Resources, (http://lunar.gsfc.nasa.gov/resources.html).

Friday, January 31, 2014

Geologic characteristics: Chang’E-3 exploration region

From extensive data distilled from remote sensing collected by the DIVINER Lunar Radiometer on-board the Lunar Reconnaissance Orbiter (LRO) since July 2009 has allowed David Page and the DIVINER team to produce extensive maps of the thermal behavior "and a range of derived quantities at the Chang'e-3 landing site, described in a separate report released January 5. Distinct areas can be seen in LROC WAC Surveys, with an overlay mapping rock abundance using thermal dissipation temperatures collected at the coldest periods, before local sunrise. DIVINER detected no minimum temperatures in the area below 94°K [NASA/JPL/UCLA/GSFC/ASU].
Zhao, Huang & Qiao, et.al.
Planetary Science Institute
China University of Geosciences, Wuhan

Science China (March 2014)

ABSTRACT: We present topographic, geomorphologic and compositional characteristics of a 1°×1° (~ 660 square kilometer) region centered near the landing site of Chang’E-3 using the highest spatial resolution data available. We analyze the topography and slope using Digital Terrain Model (DTM) generated from Terrain Camera (TC) images. The exploration region is overall relatively flat and the elevation difference is less than 300 meters, and eighty percent of the area slopes are less than 5°. 

Impact craters in the exploration region are classified into four types based on their degradation states. We investigate the wrinkle ridges visible in the exploration region in detail, using TC and Lunar Reconnaissance Orbiter (LRO) Narrow Angle Camera (NAC) images. We calculate iron oxide and titanium dioxide abundances using Multispectral Imager (MI) data and confirm two basaltic units: the northern part, belonging to Imbrium era low-titanium to very-low titanium mare basalts, and the southern part is Eratosthenian era low titanium to high titanium mare basalts. 

Finally, we produce a geological map and propose the geologic evolution of the exploration region. 

M177x3C_604nm-anot-580x800
The north central Mare Imbrium exploration region and landing site of Chang'e-3.  The geology report dates the northern mare to the Imbrium Age and the southern mare, in the lander's immediate vicinity to the Eratosthenian age, two billion years apart. LROC WAC mosaic swept up in three sequential orbits, December 5, 2011; sunrise angle of incidence 76° at 61.5 meters per pixel resolution, from 44.7 km [NASA/GSFC/Arizona State University].
INTRODUCTION: Nearly 40 years after the completion of the Apollo and Luna missions, the third Chinese lunar mission, Chang’E-3 (CE-3), was launched on December 2, 2013 and safely landed on the surface of the Moon on December 14, 2013.

The rover “Yutu” separated from the lander successfully about 8 hours later. The landing site of CE-3 is 44.12°N, 340.49°E, which is located in the northern part of Mare Imbrium. As the first Chinese lunar soft-lander and rover, the landing site was selected primarily considering engineering constraints, including topography, communication and solar illumination.

In addition, local geologic diversity was also taken into consideration, including impact craters, wrinkle ridges, and basaltic materials of different ages. The CE-3 landing site and its nearby terrains have never been visited by any other missions. Therefore, the exploration will shed light on the geologic characteristics, geochemical diversity and evolution of Mare Imbrium.

Geological maps in Apollo era and recent studies reveal regional geologic information for Sinus Iridum and the adjacent terrains. However, the spatial resolution of previous maps is not sufficient for detailed geologic study or for the rover traverse planning considering both scientific and engineering requirements. Luckily, as unprecedented high spatial resolution remote sensing data being acquired by recent lunar missions (e.g., Chang’E 1 & 2, SELENE-1, Chandrayaan-1 and Lunar Reconnaissance Orbiter: LRO), large scale geological mapping and detailed study were possible for prior study of the Chang'e-3 landing site and its exploration region. 

Read or Download the Full Adobe PDF file HERE.

Wednesday, January 15, 2014

Hansteen α

Hansteen α (LROC NAC)
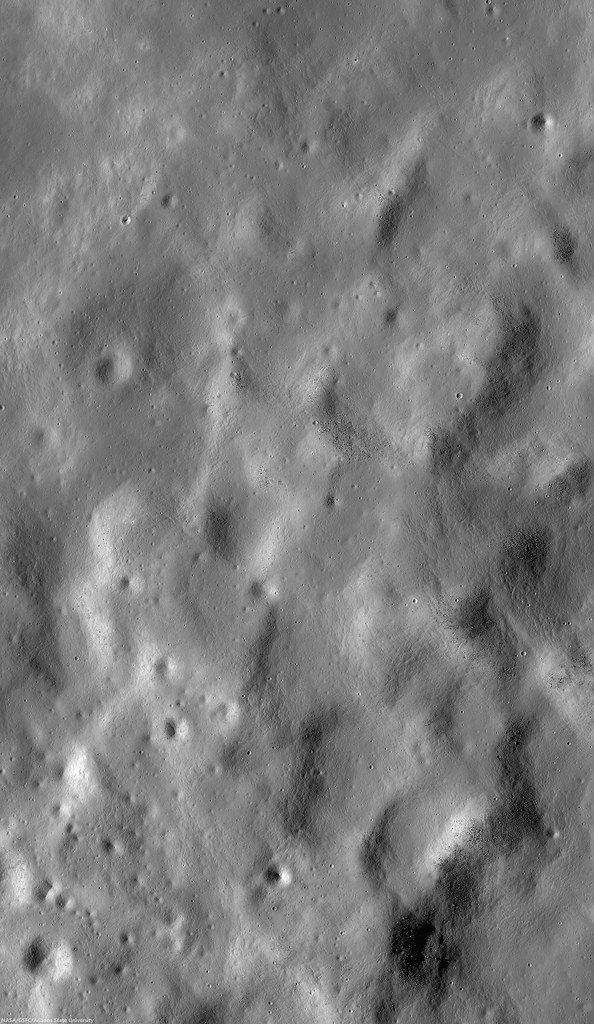
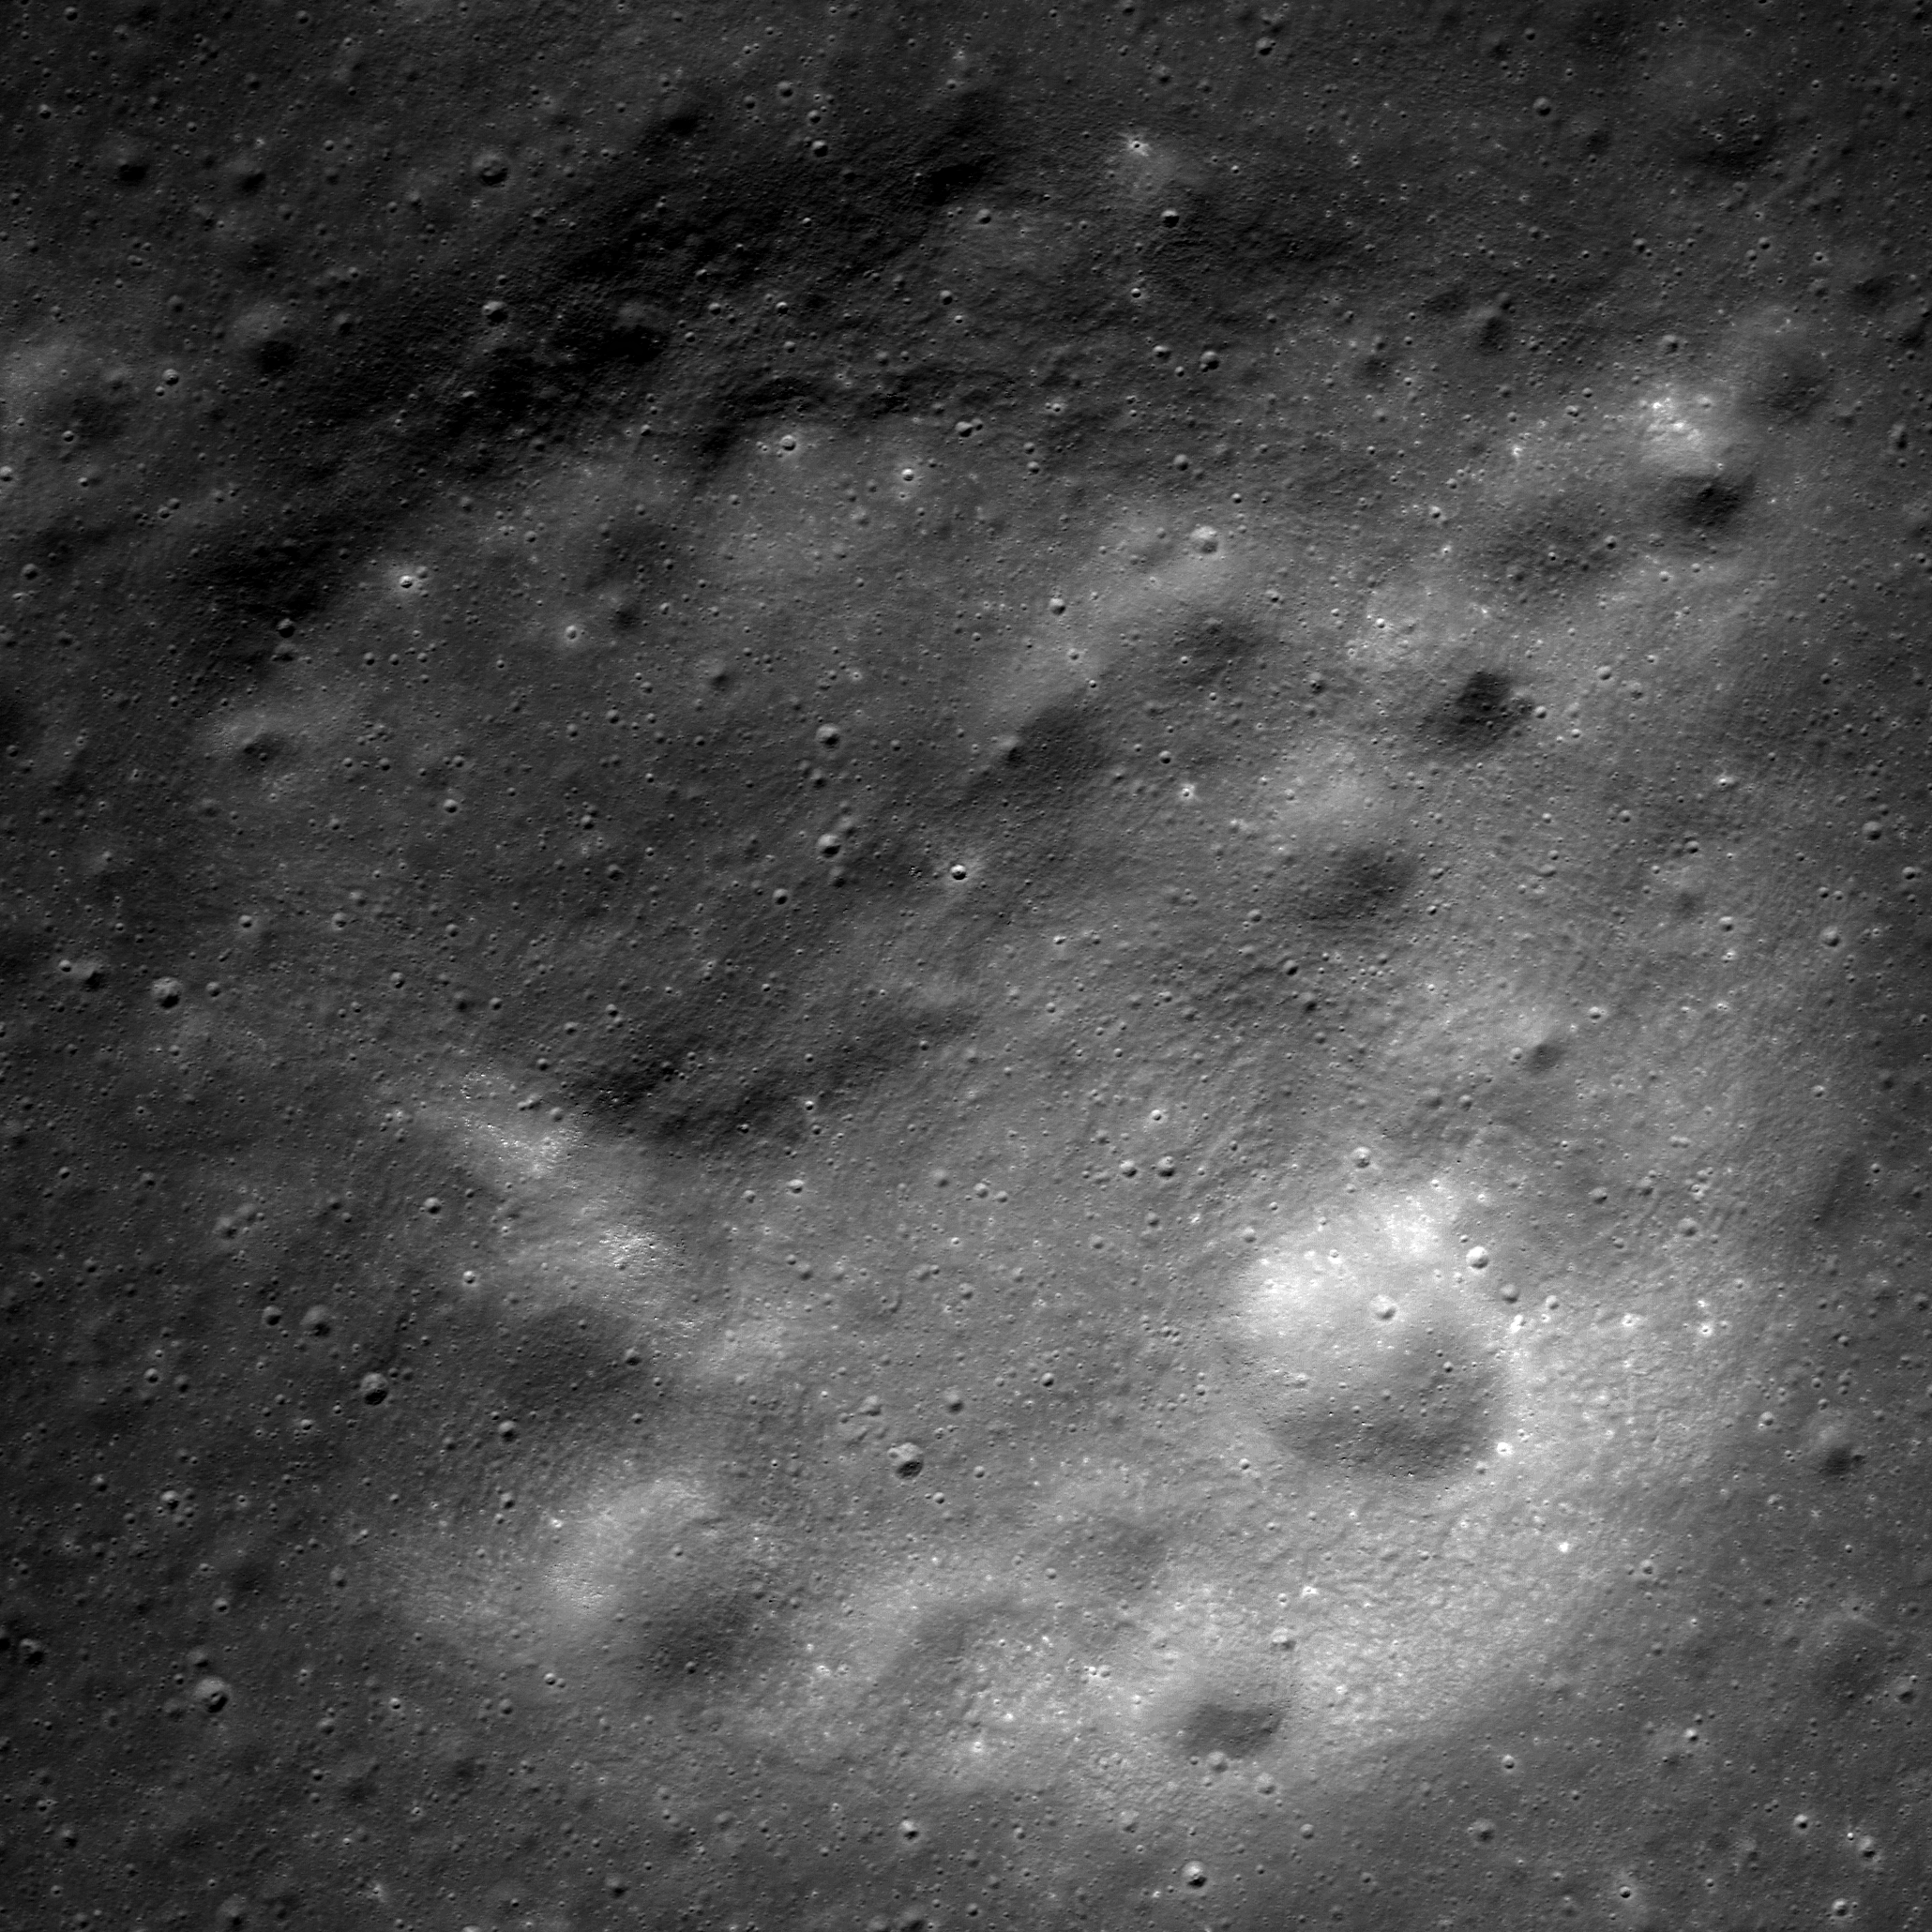
Close up on the heights (-923.8 elev.) of Hansteen α (AKA, "Mons Hansteen" and "the Arrowhead"), a triangular berg, 25 km long on its three margins, composed of intrinsically bright material and rising here 1030 meters above its neighborhood in south Oceanus Procellarum.  LROC Narrow Angle Camera (NAC) periapsis observation M166175569LR, spacecraft orbit 9623, July 24, 2011; 61.74° incidence, slew 16.45° west, resolution 0.5 meters from 41.05 km (Enlarged image HERE.) [NASA/GSFC/Arizona State University].
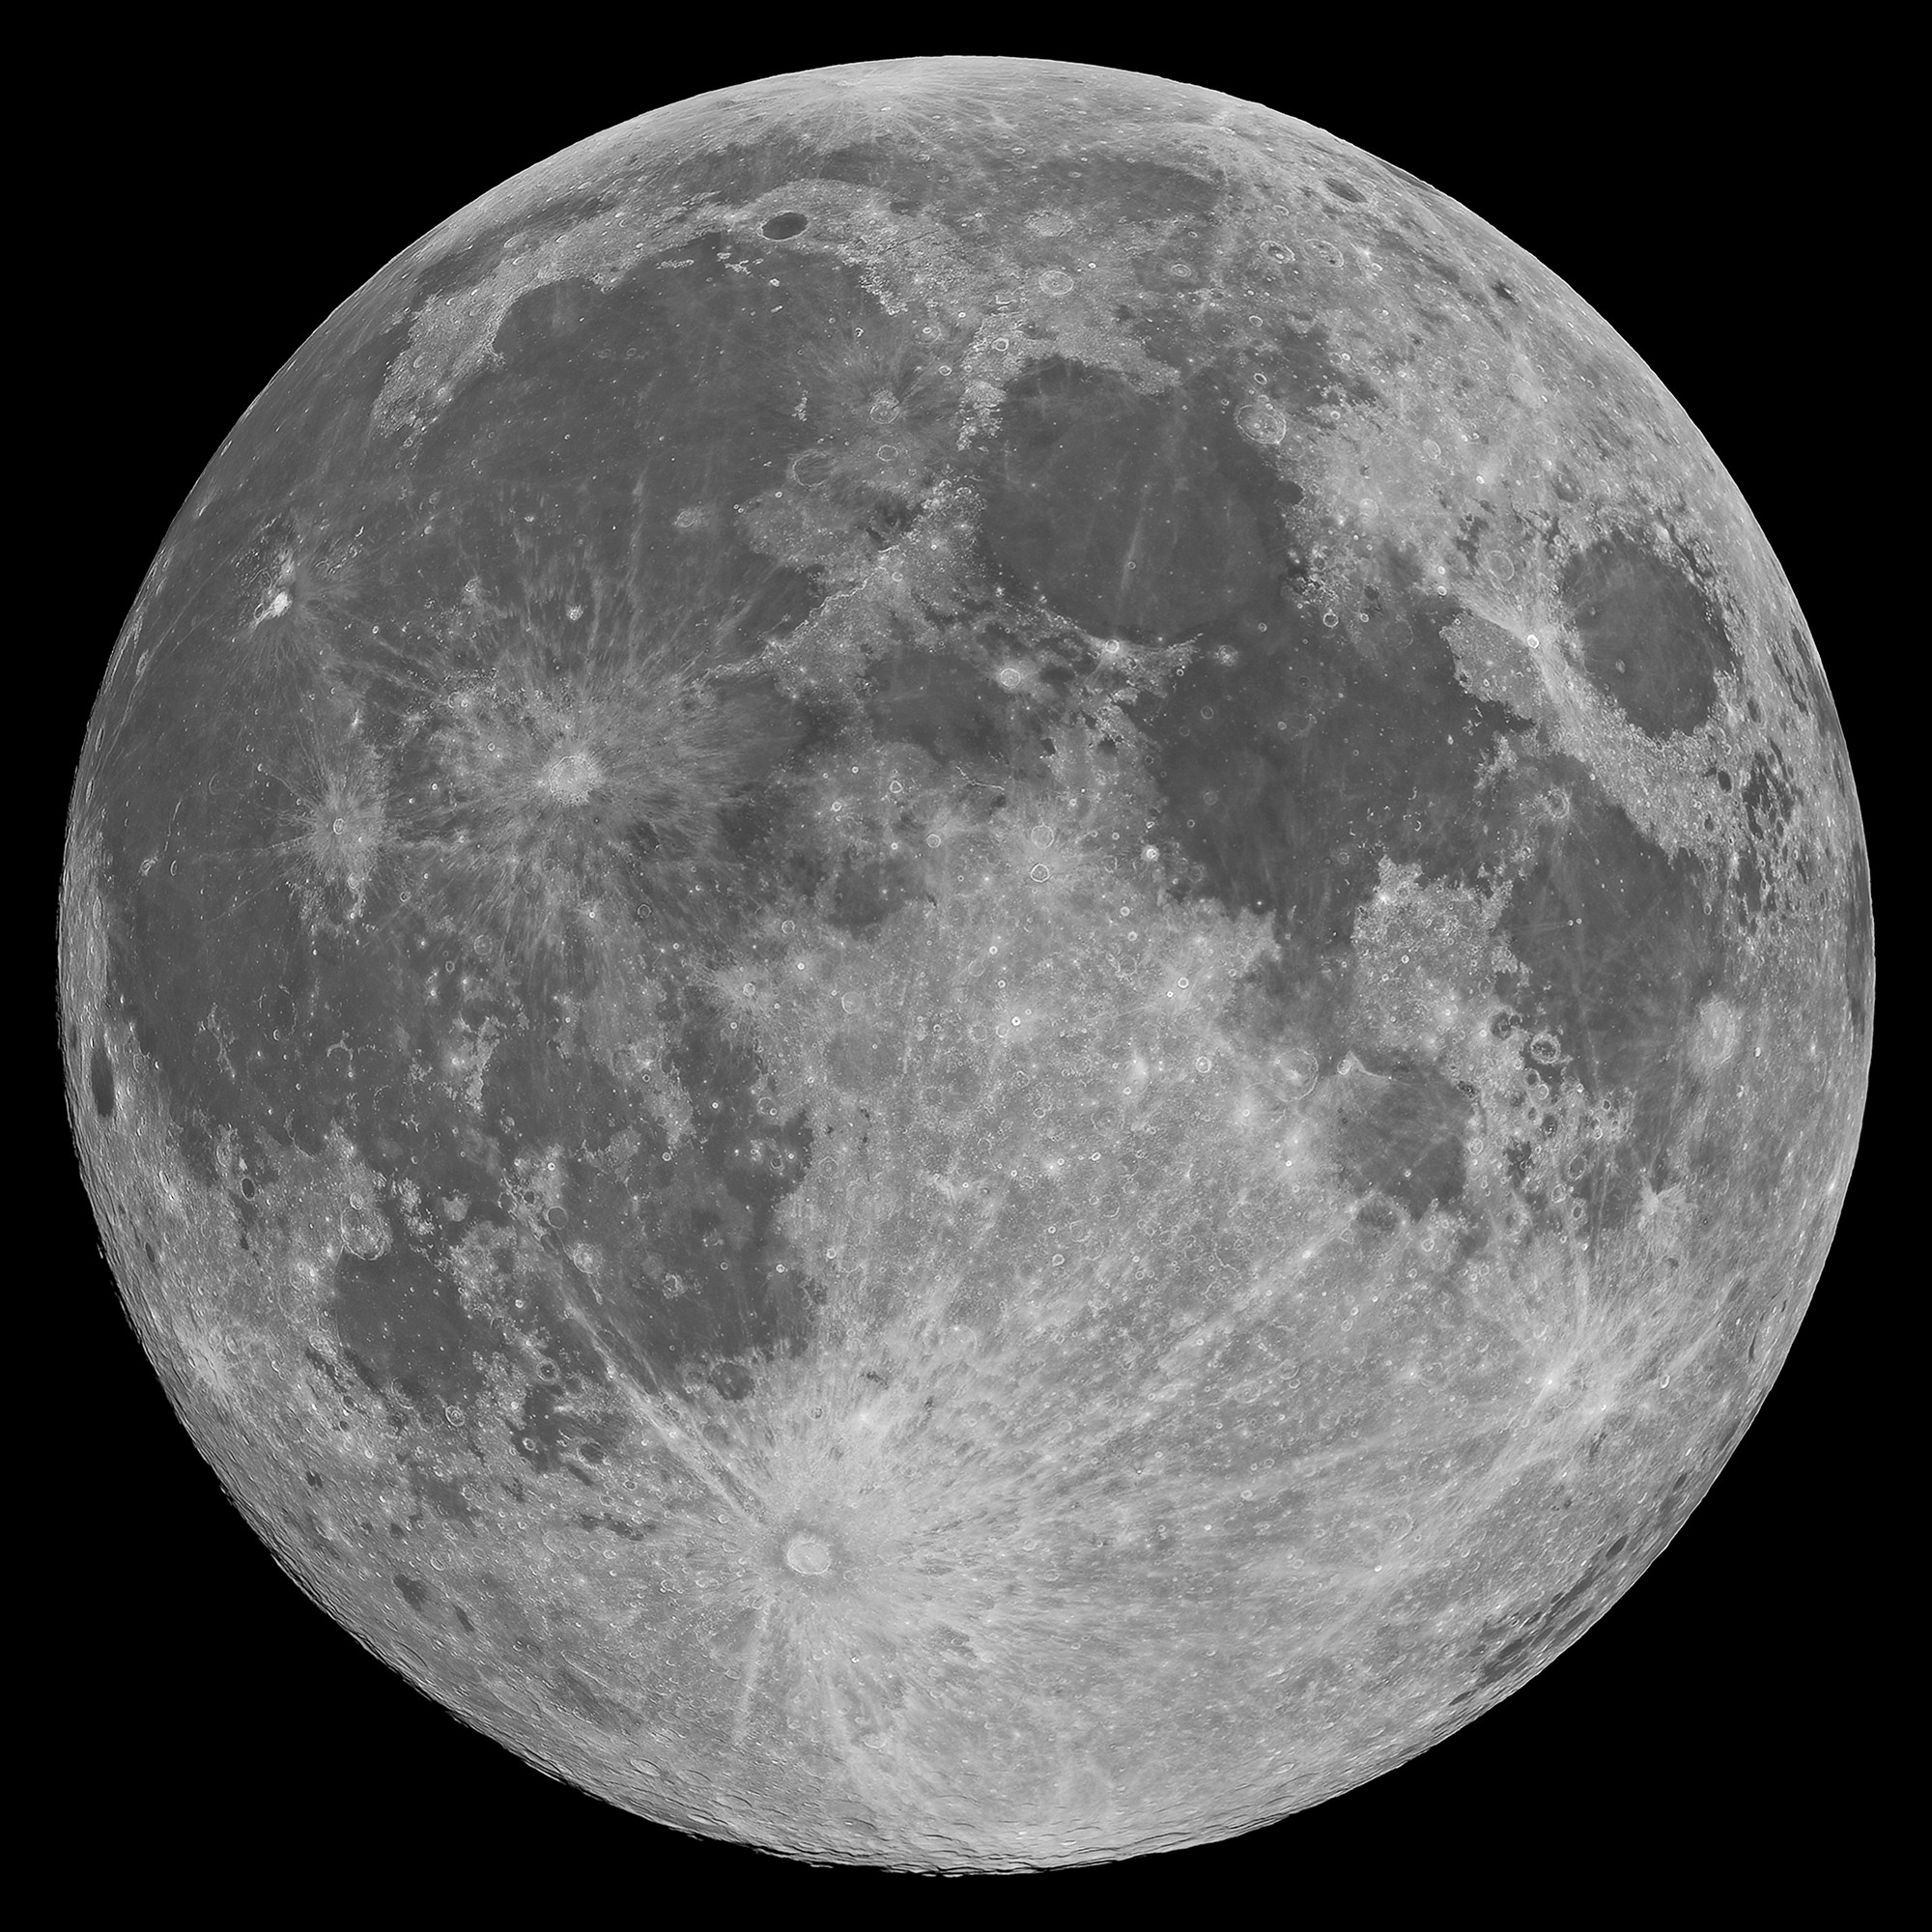
Mons Hansteen (12.2°S, 50.21°W) is a familiar nearside landmark, when viewing a Moon that's almost Full through a modest telescope. As the reader can see in the picture of the Full Moon at the end of this post, it stands out from its surroundings in the far south Oceanus Procellarum.

It's nicknamed "the arrowhead" because it looks like one, like, long-ago, it was knapped to a point by the patient hand of a hunter and now rests half buried in the darker mud of a trail, perhaps uncovered by a recent downpour.

Close investigations of the Moon over the past half century reveal what investigators call "Hansteen Alpha," or Hansteen α, stands out geologically and in other ways. The small mountain is made of different stuff than most of what is found on the lunar surface and the volcanism that flooded and re-flooded the Moon's basins. It's optical brightness is complimented by differences at other wavelengths as well, presenting a spectral profile found in only a few other locations on the Moon. 

Hansteen α is one of the Moon's red spots, bright with an albedo similar to the lunar highlands but spectrally red, brighter in shorter wavelengths and characterized by absorption in the ultra-violet (UV). 

Moreover, it must be a younger feature than it might seem on first glance, younger than certain of the larger craters nearby and other features in its neighborhood that were clearly overrun repeatedly by the darker basaltic lavas that periodically flooded and re-flooded the lower elevations over a period nearly three billion years long.

Hansteen α (LROC NAC)
The heights in the first image are at lower right in this 3.94 km-wide field of view, the full width of the area captured from LRO in LROC NAC M166175569LR, and showing a cross-section of Hansteen α from that central area north to more lower elevations, nearer the mountain's northwestern margin. (View larger sizes HERE.) [NASA/GSFC/Arizona State University].
Hansteen a (LROC WAC 250m)
Hansteen α is younger than craters Billy (45.57 km across and 3.88 billion years old, to the south) and Hansteen (45 km across and 3.87 billion years old, to the west), because both are less than one and a half times their respective diameters in distance, and the impacts that excavated these features should have at least partially covered the bright mountain. Instead, no evidence of such a direct effect has been found, only peppering of more recent impacts. LROC Quickmap at 250 meters resolution [NASA/GSFC/Arizona State University].
Hansteen α resembles the Moon's highlands but, beginning early in the post-Apollo era, investigators noted differences in texture, color and measured albedo. In the close-ups at the beginning of this post, showing some of the highest elevations of Hansteen α, depressions can be seen clustered on terraces. These seem to have once been volcanic vents.  Volcanic vents are not particularly rare on the Moon, but the kind of material that emerged from these is clearly not the same stuff that flooded its surroundings.

LROCQM064-H-a-580x746
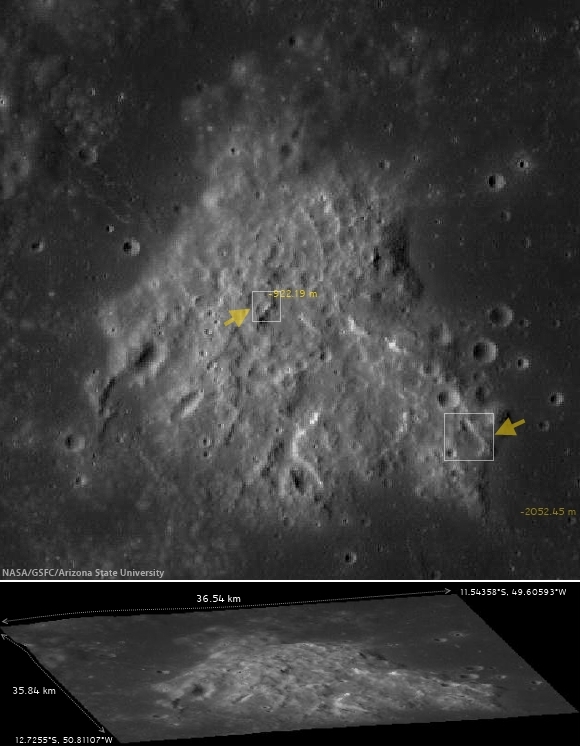
A closer look at Hansteen α elevations, with locations marked of areas shown in LROC NAC observations posted here, the highest elevations and, further along along, some solidified flows on the steep southeastern margin, included below. LROC Quickmap at 64 meters resolution, together with the LROC WAC-derived digital terrain model [NASA/GSFC/Arizona State University].
Using an experimental 3D visualization tool, accessed through the LROC Quickmap. a 152 square km area, centered on Hansteen α, animated between 0 and 10 X vertical exaggeration, further illustrating highest elevations, southwest of the formation's center; something more difficult to measure using 2D overhead photography [NASA/GSFC/Arizona State University].
The margins of Hansteen α seem abrupt, with steeper slopes than is found around the edges of the more common basaltic domes. This might be in keeping with suggestions that the kind of lava emerging into and out of this feature was thicker, related to its composition and the heat necessary for melting and transport. It also provides geologists with clues about its age relative to the volcanism that flooded Procellarum in this region.  

The Hansteen α might have formed from a "secondary," and "more evolved" volcanism, something certainly less common than the basaltic lavas that flowed out into the Moon's broad basins, not once but repeatedly, over a 2.7 billion year period, from the Nectarian age, when the Moon and Earth were only 600 million years old, until just prior to the Copernican period 1.2 billion years ago.

These more recent high-resolution images from LRO show groupings of blocky boulders, mostly related to mass wasting along slopes though some of these clusters are found on level areas and don't appear to be the result of impacts.

Intrusive volcanism Hansteen Alpha
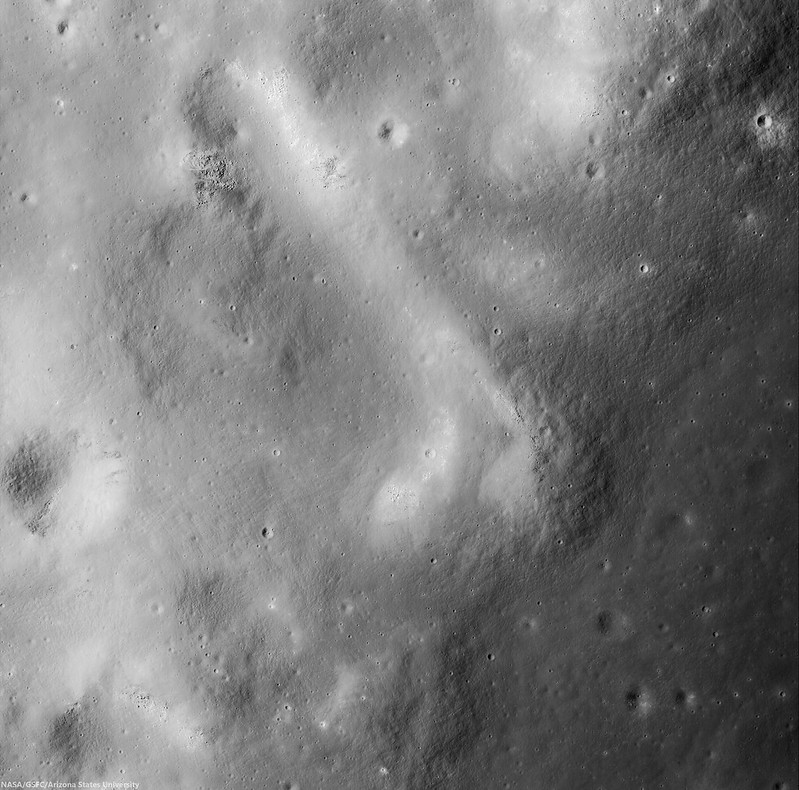
An intrusive flow, clearly visible on the abrupt southeastern margin of Hansteen alpha,  right where it solidified, This is a 3.93 km square field of view from LROC NAC observation M1129816872R, orbit 18636, July 30, 2013; 42.35° incidence, 80 cm per pixel resolution from 80.7 km over 12.2°S, 310.14°E  [NASA/GSFC/Arizona State University].
Intrusive volcanism Hansteen Alpha
Contextual view of the full 7.8 km-wide field of view swept up in the same LROC NAC  observation, showing a wider view of southeast margin of Hansteen α. Such close-ups reveal that the margin here is more abrupt than it seems at a distance. (Enlarged views and various other sizes available HERE.) [NASA/GSFC/Arizona State University].
So, just what is Hansteen alpha? In two papers presented in 2011 and 2012 to the Lunar and Planetary Science Conference, Hawke, et.al., representing some of the more noted investigators working with data returned from LRO (the more recent of these being  "The Geology and Composition of Hansteen Alpha," 43rd Lunar and Planetary Science Conference (2012), #1754), wrote, "Non-mare volcanism is the only viable process for the formation of Hansteen α."

That paper, along with others those investigators cite, along with still others cited as references below, present truly fascinating discussion of how instruments on-board Clementine (1994), Lunar Prospector (1998-99) and both the LROC cameras and the Diviner instrument, flying on LRO since 2009, are actively being used to weed out the history of this unique feature and how it relates to the complicated volcanic stratigraphy of the Procellarum basin.

Finding Hansteen alpha (Mons Hansteen)
Finding Hansteen α through a modest telescope is relatively easy, from about four days after First Quarter through three days after Last Quarter, on the south edge of Oceanus Procellarum, as shown in this well-crafted mosaic by Stephan Lammel. Look for it left of center in the inset and in the Full Moon, above.
References:

Related ASU LROC Posts:
The Fourth Marian Dome (April 17, 2013)
Aristarchus Spectacular! (December 26, 2011)
Silicic volcanism on the Moon (February 14, 2011)

Wednesday, April 17, 2013

The Fourth Marian Dome

A volcanic dome in northeastern Oceanus Procellarum., west of Rima Sharp. LROC Narrow Angle Camera (NAC) observation M1119207667R, spacecraft orbit 17144, March 29, 2013, resolution 1.5 meters over a field of view 3.1 km across [NASA/GSFC/Arizona State University].
Sarah Braden
LROC News System

The volcanic dome in the Featured Image (located at 43.673°N, 310.145°E) rises above the mare basalt of Oceanus Procellarum. This dome is another example of silicic volcanism on the Moon, much like the nearby Mairan Domes, the Gruithuisen Domes, and the Lassell Massif.

Each of these features were originally identified as "red-spots," meaning they are spectrally anomalous compared to surrounding mare and highlands material, with strong ultraviolet absorptions that are responsible for their red color.

New data from the Diviner Lunar Radiometer Experiment instrument on the LRO spacecraft confirmed that all four domes (see the WAC context image below) are highly silicic compared to mare and highlands compositions. The Diviner team's work included this fourth dome as part of the Mairan Domes and dubbed it Mairan "northwest." In terms of size and shape, Mairan "northwest" has the most in common with the smallest Mairan dome, Mairan "south." Mairan "northwest" is ~3.2 km in diameter, just slightly smaller than Mairan "south" at ~4.2 km in diameter. However, Mairan "south" is about 400 meters in height (relative to the surrounding mare) while the structure in the Featured Image has a height of only ~180 meters (measurements taken from the WACGLD100 DTM). Regardless of their height relative to the mare, both domes may be greater in size that their surface expressions due to embayment by mare basalt.

LROC Wide Angle Camera (WAC) context image of northeastern Oceanus Procellarum shows the location of the area surrounding the LROC Featured Image field of view (white box) in relation to the more prominent named Mairan Domes. Field of view is about 120 km across [NASA/GSFC/Arizona State University].
The dome of interest (lower right) and its relation to points north and a lengthy segment of Rima Sharp. LROC WAC monochrome (643 nm) observation M117827780ME, orbit 2498, January 11, 2010; spacecraft and camera slew -11.15° resolution 59 meters per pixel from 40.72 km [NASA/GSFC/Arizona State University].
Oblique view south over Rima Sharp from the JAXA planetary camera on-board SELENE-1 (Kaguya) in 2007. The small dome of interest can be seen as small white blur, between the horizon and the bend region of Rima Sharp at lower center. The named Marian Domes and the crater Marian G are visible half way between the horizon and the small dome of interest [JAXA/SELENE].
The dome of interest (yellow arrow) as seen from Earth, photographed by Lunar Picture of the Day (LPOD) contributor Stephan Lammel, June 11, 2003. The massive Mons Rümker effusive dome is visible at high relief at left. The largest crater in the highlands at right is Marian, 40 km across.
Examples of extrusive silicic materials are rare in the collection of Apollo samples and the origins of these materials are not known. However, it is thought that silicic domes like the Mairan domes may be the source locations. Studies of the Compton-Belkovich region have shown that highly silicic lunar rocks are more volumetrically important in the lunar crust than would be implied by their near absence in the Apollo samples. A sample return mission to the region of today's Featured Image would finally answer questions about the origin of these highly silicic rocks - how they were created as part of the Moon's late stage magmatic evolution.

Explore the entire NAC frame, HERE.

Related Images:
New Views of the Gruithuisen Domes
Gruithuisen Domes Constellation Region of Interest
Marius Hills Constellation Region of Interest
Compton-Belkovich: Farside Highlands Volcanism!

Tuesday, July 26, 2011

LROC: Farside Highlands volcanism


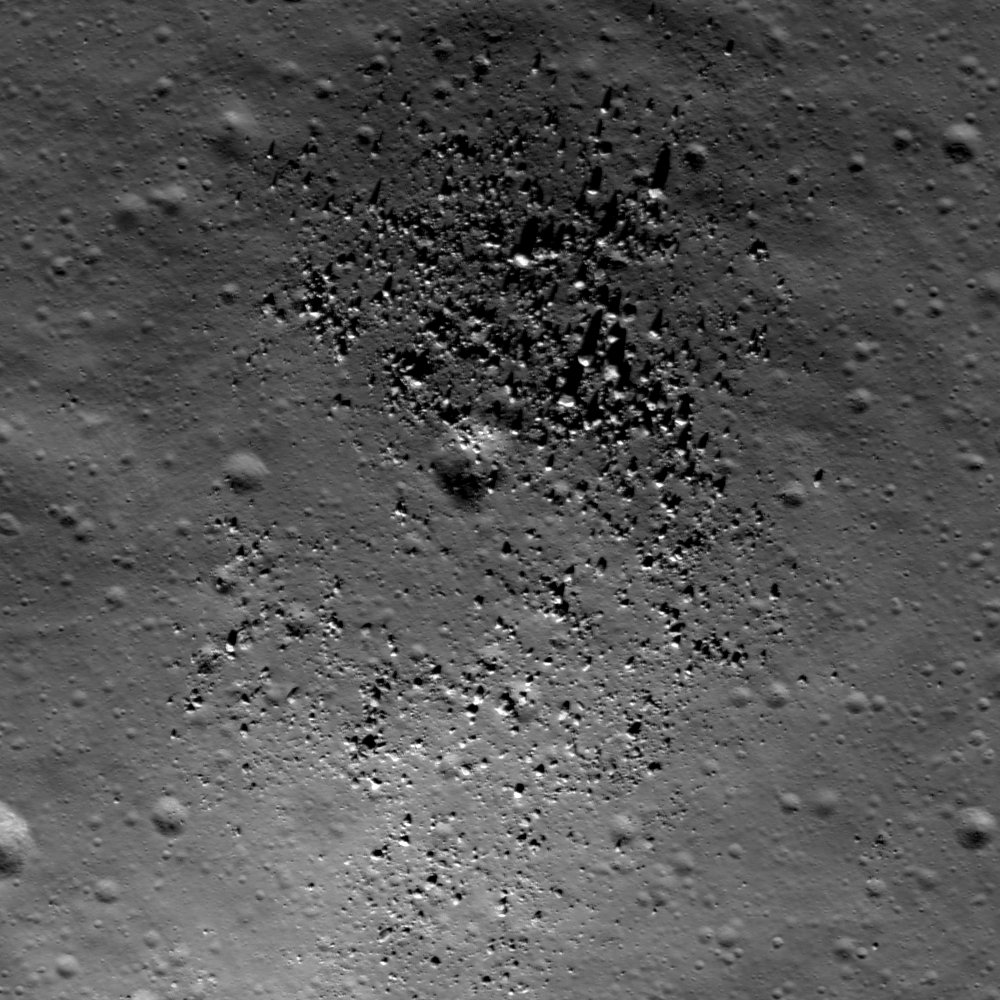
Small dome in the Compton-Belkovich "Thorium Anomaly" region (61.33 °N, 99.68 °E). Evidence indicates a volcanic origin for this and other intriguing features in this relatively small area in the highlands of the lunar farside's northern hemisphere. Solar illumination Incidence Angle is 64°, Sun is from the SSW, field of view roughly 510 meters. LROC Narrow Angle Camera (NAC) observation M139238146L, LRO orbit 5653, September 16, 2010. See the full-size LROC Featured Image HERE [NASA/GSFC/Arizona State University].


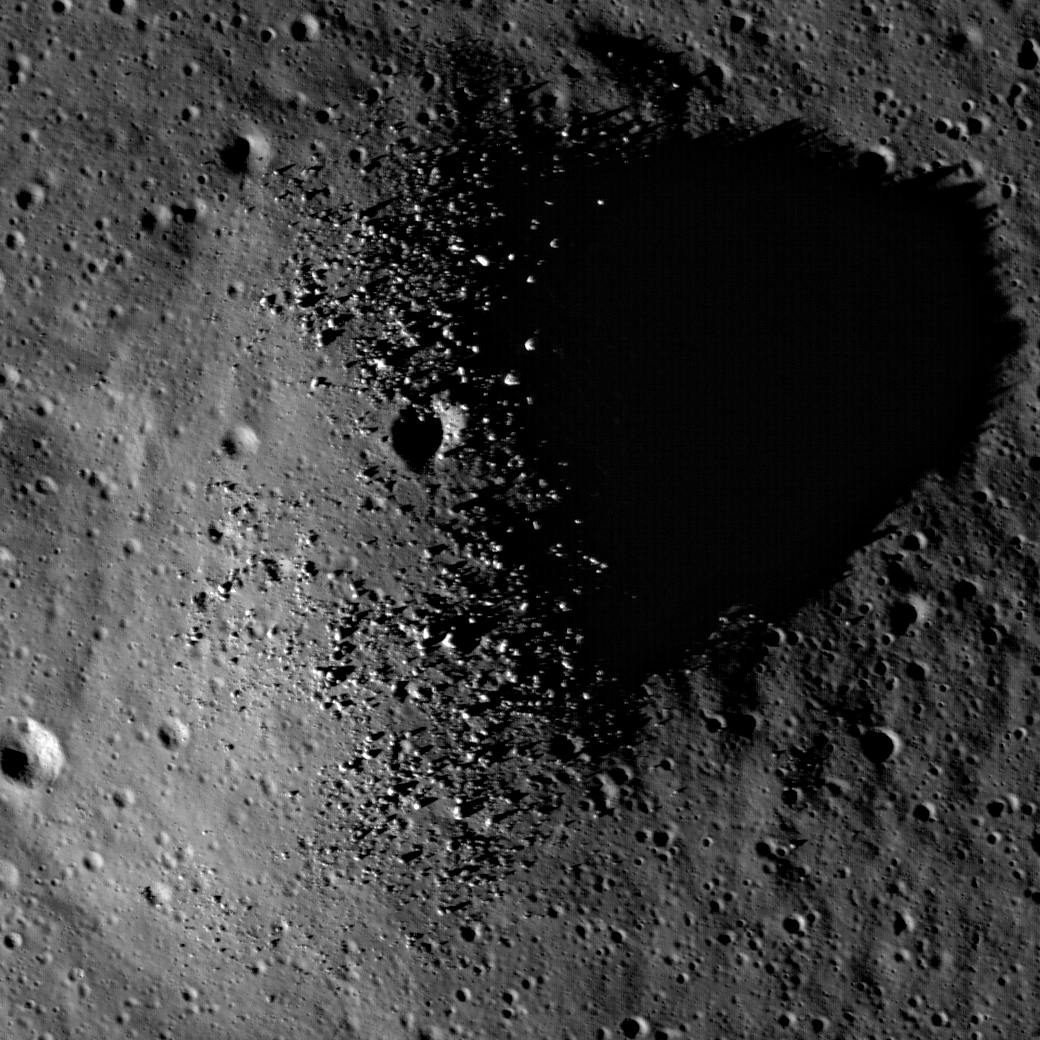
Same dome, early evening shadow, brings out small topographic features in relief. Note in the close-up view in the image following below the summit boulder shadows. Full frame field of view above is roughly 3100 meters across; LROC NAC observation M119198897L, LRO orbit 2700, January 27, 2010 [NASA/GSFC/Arizona State University].

Mark Robinson
Principle Investigator
Lunar Reconnaissance Orbiter Camera
Arizona State University

Since the domes in the Compton-Belkovich area are rounded and smooth (excepting the boulders scattered across the summit) they are not easy to spot. At sunrise and sunset (above) even smooth topography casts long shadows. In this case the Sun is 13° degrees above the horizon, showing that the slopes of the dome are steeper than 13°, an important clue to unraveling its origin. Steeper slopes often mean more viscous magma, which in turn points toward more silica rich compositions.


Full-resolution close-up of Compton-Belkovich "Dome-1" from M119198897L and the early evening shadow brings the meter-sized boulders into view [NASA/GSFC/Arizona State University].

Are you having trouble seeing the feature as a dome, that is, with positive relief? Consider the above subsampled images above from M119198897L and the wider view that includes a small crater just east of the dome. The sun is from the left. Sometimes your brain can be fooled - you see what is up as what is down. If you know the Sun direction you can "force" the ups to become downs, and vice versa. And what about the little crater at the top of the dome? Is it a volcanic vent or an impact crater? If you said “impact crater” – you are right! The top of the dome is actually about 100 m south of the small crater. The crater just happens to be near the top of the dome.


LROC Wide Angle Camera (WAC) observation M119212328M, LRO orbit 2702, January 27, 2010, and a rare example of "non-mare" silicic volcanism situated between Compton and Belkovich craters on the lunar farside, the "Compton-Belkovich High-Reflectance Feature." For scale, the small dome (and it's companion crater to the east) are indicated by the yellow arrow [NASA/GSFC/Arizona State University].


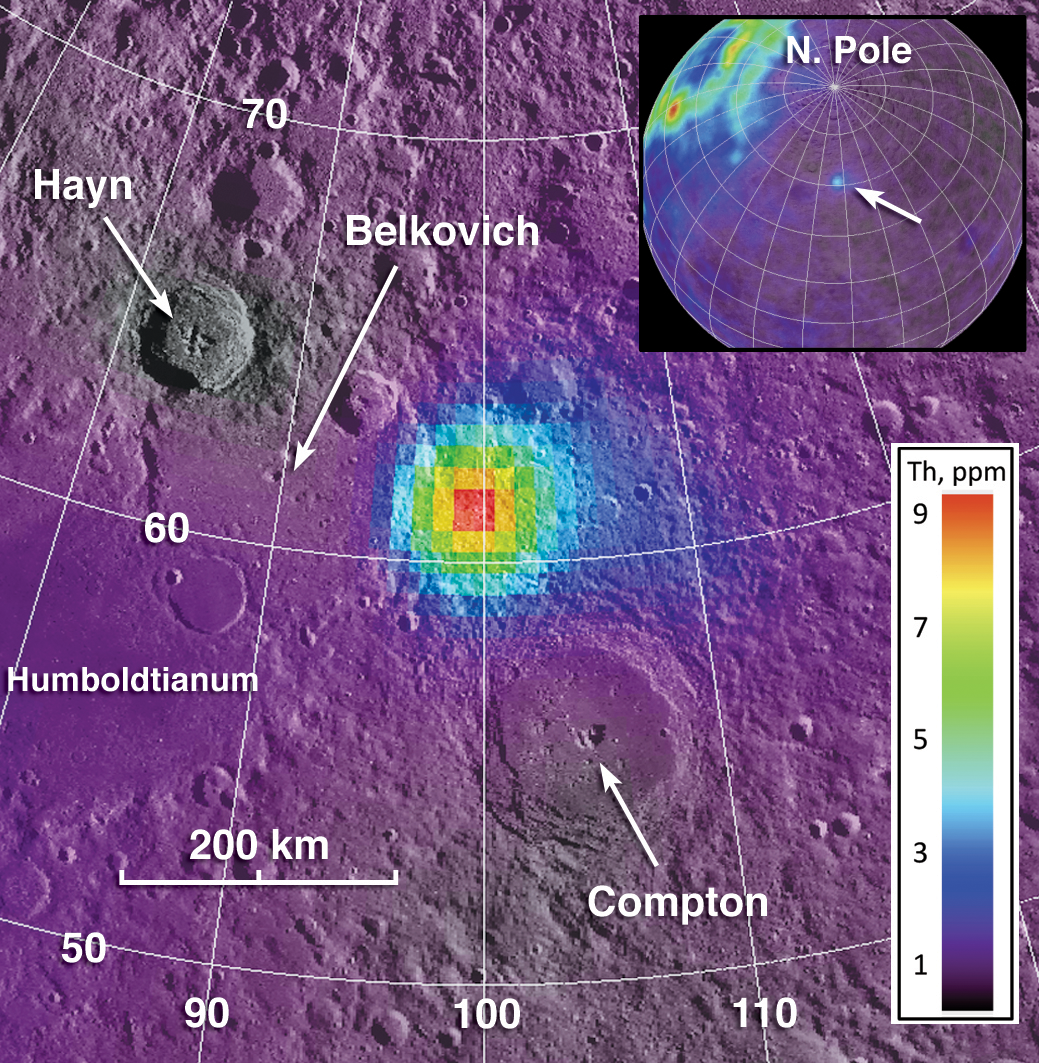
Composite image showing geochemistry from Lunar Prospector and the spike in thorium coincident with the CBHRF. (Note the nearside-farside differences in thorium seen in the inset) View the full-size context composite illustration HERE [Jolliff et al, 2011].

The Compton-Belkovich site was of special interest even before the LRO mission began. Back in 1998 the Lunar Prospector spacecraft, with its gamma-ray spectrometer, measured the global distribution of the element thorium, which has a strong peak in the gamma-ray spectrum because it is naturally radioactive. Although much of the Moon’s thorium, at least as expressed on the surface, lies mostly on the nearside, a terrain between the craters Compton and Belkovich lit up like a bull’s eye (above). For this reason, the site was selected as one of NASA’s Project Constellation sites because it is of high interest for future human or robotic exploration.


Figure 3 from "Non-Mare, Silicic Volcanism on the Moon's Far Side," Jolliff, et al., Lunar & Planetary Science Conference 2011, #2224.

This thorium “hot spot” was described by David Lawrence and the Lunar Prospector gamma-ray spectrometer team (see figure), later Jeff Gillis and coworkers noted in looking at Clementine images that a high albedo feature was located near the center of the thorium bull’s eye (see WAC context image above). However, since then, the origin of the hot spot and the nature of the deposits was not known until LRO imaged the site with the LROC Narrow Angle Cameras. Those images revealed numerous volcanic features, some large, and some small, like the little dome seen in today’s featured image. Between the Lunar Prospector and Diviner geochemistry and the LROC images, we are able to determine that these domes are examples of silicic (rich in silica relative to basalt) volcanism. An amazing discovery - the only silicic volcanism on the farside.

Be sure to return and read future posts about other features in this intriguing and unusual volcanic terrain on the Moon. What a fabulous place this would be for astronaut geologists to explore, do field geology, and collect samples for analysis!

In the meantime explore the full resolution NAC and see what volcanic features you can find!

Sunday, April 10, 2011

LOLA: Cold Hermite


It may look like an ordinary old crater, but to some scientists the 104 km diameter Hermite Crater is one of the most interesting features on the lunar surface.

NASA Goddard - In 2009, the Diviner instrument revealed that an area within Hermite Crater is the coldest place ever measured in the Solar System, with a temperature of -249 degrees Celsius [1]. This cold temperature is due to the fact that regions within this crater, which is located near the Moon's north pole, never see sunlight.

Data from LRO's LOLA instrument have enabled scientists to model topographically-controlled lighting conditions near the lunar poles over long periods of time [2]. These model simulations reveal that on the scale of millions of years, regions (see arrows) near the southwestern portion of the crater remain in permanent shadow [NASA/GSFC/LOLA].

Much more on Hermite, HERE.

Orbital Earthrise over the Moon's far north in 2008, and a look back peeking up from the far side as Japan's first lunar orbiter SELENE-1 (Kaguya) captured this HDTV view also of Hermite and also that crater's permanently shadowed interior western rim, discovered a year later to host to the coldest temperatures yet recorded in the solar system [JAXA/NHK/SELENE].

Tuesday, October 26, 2010

LRO-Diviner Lunar Radiometer observations of cold traps in the Moon’s south polar region

David A. Paige,1* Matthew A. Siegler,1 Jo Ann Zhang,1 Paul O. Hayne,1 Emily J. Foote,1 Kristen A. Bennett,1 Ashwin R. Vasavada,2 Benjamin T. Greenhagen,2 John T. Schofield,2 Daniel J. McCleese,2 Marc C. Foote,2 Eric DeJong,2 Bruce G. Bills,2 Wayne Hartford,2 Bruce C. Murray,3 Carlton C. Allen,4 Kelly Snook,5 Laurence A. Soderblom,6 Simon Calcutt,7 Fredric W. Taylor,7 Neil E. Bowles,7 Joshua L. Bandfield,8 Richard Elphic,9 Rebecca Ghent,10 Timothy D. Glotch,11 Michael B. Wyatt,12 Paul G. Lucey13
22 OCTOBER 2010 VOL 330 SCIENCE

Diviner Lunar Radiometer Experiment surface-temperature maps reveal the existence of widespread surface and near-surface cryogenic regions that extend beyond the boundaries of persistent shadow. The Lunar Crater Observation and Sensing Satellite (LCROSS) struck one of the coldest of these regions, where subsurface temperatures are estimated to be 38 kelvin. Large areas of the lunar polar regions are currently cold enough to cold-trap water ice as well as a range of both more volatile and less volatile species. The diverse mixture of water and high-volatility compounds detected in the LCROSS ejecta plume is strong evidence for the impact delivery and cold-trapping of volatiles derived from primitive outer solar system bodies.

The Moon’s polar regions are notable because of their potential to cryogenically trap water ice and other volatile species (1). The Lunar Reconnaissance Orbiter (2) (LRO) Diviner Lunar Radiometer Experiment has been mapping the infrared emission from the Moon since July 2009 using seven spectral channels that span a wavelength range from7.55 to 400 mmat a spatial resolution of ~200 m (3).

Thermal maps of the south polar region (Fig. 1, A and B) were obtained during the LRO monthly mapping cycle just before the Lunar Crater Observation and Sensing Satellite (LCROSS) impact (4), as the Moon approached southern summer solstice (5). The mapped quantity is the bolometric brightness temperature, which is the wavelength-integrated radiance in all seven Diviner channels expressed as the temperature of an equivalent blackbody (6). For quantifying the overall heat balance of the surface and comparing with available models, the bolometric brightness temperature is the most fundamental and interpretable measurable quantity.

For the simplest case in which Diviner’s surface footprint is filled with a blackbody of uniform surface temperature, the bolometric brightness temperature will be equal to the temperature of the surface.


Figure 1. Maps of measured and model-calculated surface and subsurface temperatures in the lunar south polar region. The outer circle on all maps is 80° south latitude. Observations were acquired between 6 September and 3 October 2009 as the Moon approached southern summer solstice. (A) Diviner-measured daytime bolometric brightness temperatures acquired between 11.4 and 13.6 hours local time (5). (B) Diviner-measured nighttime bolometric brightness temperatures acquired between 21.41 and 1.66 hours local time (5). (C) Model-calculated annual average near-surface temperatures and the location of the LCROSS impact in Cabeus Crater. (D) Model-calculated depths at which water ice would be lost to sublimation at a rate of less than 1 kg/m−2 per billion years. - The white regions define the locations where water ice can currently be cold trapped on the surface, the colored regions define the upper surface of the lunar ice permafrost boundary and the gray regions define locations where subsurface temperatures are too warm to permit the cold-trapping of water ice within 1 m of the surface.

In the more general case, where Diviner’s surface footprint contains small-scale slopes, shadows, or rocks, the brightness temperatures in Diviner’s individual infrared channels may vary with wavelength depending on the distribution of sub–footprint-scale temperatures, spectral emissivities, and photometric properties. In this case, the bolometric brightness temperature cannot be interpreted in terms of a unique surface temperature. However, within cold regions that are not in direct sunlight, simultaneously acquired brightness temperatures in Diviner channels 7 (25 to 41 mm), 8 (50 to 100 mm), and 9 (100 to 400 mm) are in good agreement (6), which is consistent with uniformly high spectral emissivity across this wavelength range and relatively uniform temperatures within each Diviner footprint (fig. S1, A and B). This interpretation is supported by the results of an analysis of data acquired in each of the Diviner infrared channels at the LCROSS impact site in Cabeus Crater (7). For unilluminated regions, we use Diviner bolometric brightness temperatures as reasonably accurate proxies for the temperature of the surface.

The thermal maps show that the coldest regions are located on the floors of larger impact craters that receive no direct sunlight (Fig. 1,A and B). For these regions, previous modeling studies have shown that the main heat source is emitted infrared radiation from distant interior sunlit crater walls (8–11). Topographic relief within cold crater floor regions can provide additional radiation shielding, resulting in intensely cold localized regions with measured mid-day bolometric brightness temperatures as low as 29 K. Heat flow fromthe lunar interior may contribute to the overall heat balance of these coldest surfaces, but is not dominant compared to heating from scattered solar and infrared radiation during this season (6). Diviner’s summer solstice observations represent a valuable snapshot of the south polar region surface temperatures that can be extended in depth and in time with models. We have developed a thermal model that realistically accounts for the effects of large-scale topographic relief on direct and indirect solar and infrared radiation on the heat balance of the lunar surface (6). The model uses a ~500-m-scale triangular mesh based on south polar topography derived from the Kaguya LALT laser altimeter (12) and a spatially uniform set of thermal and reflectance parameters that are generally consistent with those derived from previous studies (6). The excellent overall agreement between maps (fig. S3, A and B) and histograms (Fig. 2A) of the observed and calculated bolometric temperatures demonstrate the general validity of our modeling approach. The only notable discrepancy occurs for daytime temperatures in the shadowed portions of craters that have measured bolometric temperatures in the range of 60 to 120 K, where the model underestimates temperatures by roughly 15 K (fig. S4, A and B). This may be largely due to directionally anisotropic infrared emission from rough sunlit crater walls, which is not accounted for in the present model (6). Given the better agreement between the model and the Diviner nighttime data, we estimate that the net effect on model-calculated annual average temperatures at 2-cm depth (Figs. 1C and 2B) is less than 7 K in the warmest craters and close to zero in the coldest craters. For the limiting case of zero heat flow from the lunar interior, the temperatures at greater depths would be close to this near-surface average temperature (11). However, with nonzero heat flow, average temperatures will increase with depth at a rate proportional to the heat flow rate and inversely proportional to the thermal conductivity. Using parameters derived from the heat flow experiments at the Apollo 15 and 17 landing sites (13), we estimate that LCROSS impact site temperatures at 2-m depth should be <6 K higher than annual average surface temperatures (fig. S5). Although the Diviner bolometric temperatures presented here and cooling curves at the LCROSS impact site are generally consistent with the presence of unconsolidated regolith near the surface (7, 14), the thermophysical properties of the Moon’s cryogenic regolith are not currently well constrained and could differ substantially from those in warmer regions (15), particularly at depth.


Figure 2. (A) Normalized histograms of measured daytime and nighttime bolometric brightness temperatures for the maps shown in Fig. 1, A and B, with comparisons to model-calculated surface temperatures at the same locations and times as those of the Diviner observations (fig. S3, A and B). (B) Histograms of model-calculated annual average temperatures at 2-cm depth for the maps shown in Fig. 1C and fig. S7, A to D, and at the LCROSS impact site for selected values of qmax, the mean maximum angle between the Moon’s spin axis and the normal to the ecliptic plane. qmax =1.54° for present-day conditions. (C) The recent evolution of qmax as a function of the Earth-Moon distance (29). (D) The volatility temperatures of a range of potential cold-trapped volatile compounds (21, 22) View higher-resolution Fig. 2 HERE.

We expect that the Moon’s cryogenic regions extend to depths of at least tens of meters below the surface, but estimating the volumetric extent of the Moon’s cryogenic regions purely from surface-temperature observations is highly uncertain.

Thermal model results can be used to estimate the stability of water ice deposits to loss by sublimation and diffusive migration through the lunar regolith (11, 16). Figure 1D shows a map of the depths at which water ice would be lost at a rate of less than 1 kg m−2 per billion years, which corresponds to a loss rate of 1 mm per billion years for a pure ice deposit (6). The results show that surface cold traps for water ice are surrounded by much more extensive “lunar permafrost” regions where water ice is stable in close proximity to the surface (17). These regions may receive direct solar radiation during periods when solar lighting conditions are most favorable, but maintain annual maximum temperatures at depth that are sufficiently cold to effectively prevent appreciable water loss due to sublimation. Because of their more hospitable surface thermal and illumination environments, lunar permafrost regions may be accessible locations for future in situ exploration of the Moon’s cold traps.

The overall picture painted by the present thermal state of the lunar south polar region is one of extreme cold. Temperatures in the Moon’s larger cold traps are closer to those expected for the poles of Pluto (18) than for Earth’s closest neighbor. At the cold temperatures that exist within most south polar craters, cold-trapped water molecules have negligible mobility (16), such that any water molecules deposited on the surface will not effectively diffuse below the surface where they can be protected from loss processes such as photolysis and sputtering (19). In cryogenic regions, burial of frozen volatiles by impact gardening is likely to be a much more effective process (20). However, warmer permafrost regions that currently exist at the margins of cold traps may represent somewhat more favorable environments for the downward diffusion of water molecules into the regolith, which should be aided by the daytime temperature gradient between warmer surface layers and colder subsurface layers below.

The distribution of temperatures in the lunar south polar region also places constraints on the thermal stability of non-water volatile species. Figure 2D shows the volatility temperatures (the temperatures at which pure solids exposed to vacuum at the surface would sublimate at a rate of 1 mm per billion years) for several volatile species (21, 22). Non-water subsurface volatiles will also be stable to sublimation at higher temperatures owing to the effects of diffusive migration through the regolith (6). Large areas of the lunar south polar region have the capability to cold-trap water and less volatile species such as mercury and sodium. All three of these volatile species were in the LCROSS ejecta plume (4, 14, 23).

Colder surface and subsurface areas in the south polar region also have the capability to cold-trap so-called super volatile species that have higher volatility than water, which include compounds such as sulfur dioxide, carbon dioxide, formaldehyde, ammonia, and methanol. The detection of a representative cross-section of these same supervolatile species in the LCROSS ejecta plume (4) represents strong evidence for the impact delivery of volatiles to the Moon by primitive outer solar system bodies, and the subsequent cold-trapping of these volatiles at the lunar poles (21, 22).

A question of interest regarding the lunar cold traps is whether they contain abundant deposits of nearly pure water ice such as those discovered by radar observations of impact craters at the poles of Mercury (24). Diviner-measured summer solstice daytime and nighttime surface bolometric brightness temperatures of 46.7 and 38.7 K in the region surrounding the LCROSS impact site, and model-calculated annual average temperatures at this site at a depth of 2 cm, are close to 38 K (6). As shown in Figs. 1, C and D, and 2B, the LCROSS impact site is a surface cold trap for water and is among the coldest locations in the south polar region. The Lunar Prospector Neutron Spectrometer (LPNS) results show that the average hydrogen abundance in the near-surface regolith at the south pole is ~70 parts per million (ppm) by weight, which translates to a water-equivalent average abundance of ~600 ppm by weight (25). Our results show that the surface and near-surface water ice cold traps comprise >66% of the surface area poleward of 85° south latitude (Fig. 1D). If we assume that all the hydrogen detected by LPNS was uniformly distributed within these cold traps, then the average water-equivalent abundance would be only ~1000 ppm by weight, which is substantially less than the 1 to 10% water content inferred at the LCROSS impact site (4). This suggests that the LCROSS site must be enriched in water compared to the average south polar near-surface cold trap, which is consistent with enhanced hydrogen abundances observed in the Cabeus region by orbital neutron spectrometers (26–28).

The spin pole of the Moon is currently in a tidally damped Cassini State 2 configuration in which the time-averaged maximum angle between theMoon’s spin axis and the normal to the ecliptic plane (qmax) has decreased to its present value of qmax = 1.54° as the Earth-Moon distance increased over time (Fig. 2C) (29). The absolute time scale for the tidal evolution of the Earth-Moon system is highly uncertain, but it is likely that the transition depicted in Fig. 2C has occurred over a period of more than 1 billion years (30). Model-calculated annual average near-surface temperatures qmax = 4°, 8°, 12°, and 16° (Fig. 2B and fig. S7, A to D) show that portions of the Moon’s south polar region cooled considerably as the Moon’s orbital radius increased, first creating cold traps capable of cold-trapping water, and then trapping compounds with higher volatility. The LCROSS impact site,which is located on the floor of the large Cabeus impact crater, is typical of the coldest areas on the Moon today. However, earlier in the Moon’s orbital history, when qmax was greater than ~10°, the floors of large-impact craters were not the coldest areas on the Moon because the walls of these relatively shallow craters did not shield their floors from direct solar radiation. Based on the results in Fig. 2B and fig. S7, A to D, the Moon’s earliest surviving near-surface cold traps are not located on the floors of large-impact craters, but rather on the floors of intermediate-sized craters, which thus may have had longer opportunities to accumulate water ice.

1Department of Earth and Space Sciences, University of California, Los Angeles, 595 Charles E. Young Drive East, Los Angeles, CA 90095, USA. 2Jet Propulsion Laboratory, California Institute of Technology, Pasadena, CA 91109, USA. 3California Institute of Technology, Pasadena, CA 90025, USA. 4NASA Johnson Space Center, Houston, TX 77058, USA. 5NASA Goddard Space Flight Center, Greenbelt, MD 20771, USA. 6U.S. Geological Survey, Flagstaff, AZ 86001, USA. 7Oxford University, Oxford OX1 3PU, UK. 8University of Washington, Seattle, WA 98195, USA. 9NASA Ames Research Center, Moffett Field, CA 94035, USA. 10University of Toronto, Toronto, ON M5S 3B1, Canada. 11State University of New York, Stony Brook, NY 11794, USA. 12Brown University, Providence, RI 02912, USA. 13University of Hawaii, Honolulu, HI 96822, USA.

*To whom correspondence should be addressed. E-mail: dap@moon.ucla.edu

References and Notes:

1. K. Watson, B. C. Murray, H. Brown, J. Geophys. Res. 66, 3033 (1961).
2. G. Chin et al., Space Sci. Rev. 129, 391 (2007).
3. D. A. Paige et al., Space Sci. Rev. 150, 125 (2010).
4. A. Colaprete et al., Science 330, 463 (2010).
5. The LRO orbit plane is inclined 90° to the lunar equator and is fixed in inertial space. LRO’s ground track rotates through 360° of longitude every sidereal month, allowing Diviner to make one daytime and one nighttime map every 27.3-day mapping cycle in pushbroom nadir mapping mode. Local time on the Moon can be expressed in hours by normalizing the angular distance between geographic longitude and the longitude of the solar point to a 24-hour day. We define daytime to be between 6 a.m. and 6 p.m. local time, and nighttime to be between 6 p.m. and 6 a.m. local time. Because the plane of the LRO orbit rotates relative to the lunar terminator by 360° every Earth year, the local times of Diviner’s observations drift by ~2 hours during each mapping cycle. The subsolar latitude on the Moon currently varies by approximately T1.54° over the course of the Moon’s 346-day draconic year, resulting in distinct seasonal temperature variations at the highest latitudes. The LRO launch date was chosen so that the LRO orbit plane was within 10° of the noon-midnight plane during LRO’s first southern summer solstice.
6. Supporting material is available on Science Online.
7. P. O. Hayne et al., Science 330, 477 (2010).
8. R. R. Hodges, Lunar Planet Sci. Conf. 11, 2463 (1980).
9. D. A. Paige, S. E. Wood, A. R. Vasavada, Science 258, 643 (1992).
10. A. P. Ingersoll et al., Icarus 100, 40 (1992).
11. A. R. Vasavada et al., Icarus 141, 179 (1999).
12. H. Araki et al., Science 323, 897 (2009).
13. M. G. Langseth et al., Proc. Lunar Sci. Conf. 7, 3143 (1976).
14. P. H. Schultz et al., Science 330, 468 (2010).
15. G. J. Taylor et al., Proceedings of Space Resources Roundtable VI. LPI Contribution No. 1224., Golden, CO, Abstract 6040 (Lunar and Planetary Institute, Houston, TX, 2004).
16. N. Schorghofer, G. J. Taylor, J. Geophys. Res. 112, E02010 (2007).
17. We estimate that the total area of surface water ice cold traps in the lunar south polar region shown in Fig. 1D is 13,087 km2, and the total area of near-surface water ice cold traps to a depth of 1 m is 119,507 km2.
18. C. J. Hansen, D. A. Paige, Icarus 120, 247 (1996).
19. T. H. Morgan, D. E. Shemansky, J. Geophys. Res. 96 (A2), 1351 (1991).
20. D. H. Crider, R. R. Vonrak, Adv. Space Res. 31, 2293 (2003).
21. J. A. Zhang, D. A. Paige, Geophys. Res. Lett. 36, L16203 (2009).
22. J. A. Zhang, D. A. Paige, Geophys. Res. Lett. 37, L03203 (2010).
23. G. R. Gladstone, Science 330, 472 (2010).
24. J. K. Harmon, Space Sci. Rev. 132, 307 (2007).
25. W. C. Feldman et al., J. Geophys. Res. 106 (E10), 23,231 (2001).
26. D. J. Lawrence et al., J. Geophys. Res. 111, E08001 (2006).
27. R. C. Elphic et al., Geophys. Res. Lett. 34, L13204 (2007).
28. I. Mitrofanov et al., Lunar Planet. Sci. Conf. 41, 2250 (2010).
29. W. R. Ward, Science 189, 377 (1975).
30. B. G. Bills, R. D. Ray, Geophys. Res. Lett. 26, 3045 (1999).
31. We thank the many people at the Jet Propulsion Laboratory and the Goddard Space Flight Center who contributed to the success of the Diviner instrument and the LRO project. We also thank the National Aeronautics and Space Administration for funding this investigation.

Supporting Online Material
www.sciencemag.org/cgi/content/full/330/6003/479/DC1
Methods Figs. S1 to S7
References 1 February 2010; accepted 12 August 2010 10.1126/science.1187726

Thursday, October 21, 2010

LRO analysis of LCROSS data proves essential

Updated October 25, 2010, 1837 UT

Investigators and teams operating advanced instruments flying on-board Lunar Reconnaissance Orbiter mapped the impact of the LCROSS impactor and its aftermath, October 9, 2009. Their full reports were discussed October 21, 2010, coincident with being published in the journal Science. LRO approaches the impact, seen as a true false-color map of the measured dissipation of heat 21 seconds after the impact in the permanently shadowed region of the Cabeus crater group [NASA/GSFC/UCLA/SVS].

Bill Steigerwald
Goddard Space Flight Center

Last year on October 9, NASA's LCROSS (Lunar Crater Remote Observation and Sensing Satellite) intentionally crashed its companion Centaur upper stage into the Cabeus crater near the lunar south pole. The idea was to kick up debris from the bottom of the crater so its composition could be analyzed. The Centaur hit at over 5,600 miles per hour, sending up a plume of material over 12 miles high.

"Seeing mostly pure water ice grains in the plume means water ice was somehow delivered or chemical processes are causing ice to accumulate in large quantities," said Anthony Colaprete, LCROSS project scientist and principal investigator at NASA's Ames Research Center, Moffett Field, CA. "Furthermore, the diversity and abundance of certain materials called volatiles in the plume, suggest a variety of sources, like comets and asteroids, and an active water cycle within the lunar shadows."

LCROSS was a companion mission to NASA's Lunar Reconnaissance Orbiter (LRO) mission, launched in tandem with the advanced lunar orbiter, June 18, 2009.

The two missions were designed to work together, and support from LRO was critical to the success of LCROSS. During impact, LRO, which is normally looking at the lunar surface, was tilted toward the horizon so it could observe the plume. Shortly after the Centaur hit the Moon, LRO flew past debris and gas from the impact while its instruments collected data.

"LRO assisted LCROSS in two primary ways -- selecting the impact site and confirming the LCROSS observations," said Gordon Chin of Goddard Space Flight Center, LRO associate project scientist.


The LCROSS Shepherding and Sensing module immediately follows the empty Centaur impactor, returning data to Earth on the latter's impact and the formation of a 30 meter crater seconds before its own impact nearby. LRO approached and passed the relatively "water-rich" 72 square km permanently shadowed target and orbited nearly overhead the following orbit, measuring the signature of both impacts. Both vehicles had been launched together the previous June. (LRO, still in orbit, has now orbited the Moon more than 6000 times) Scene taken from new animation released by NASA, October 21, 2010 [NASA/GSFC/ARC].

"Since observatories on Earth were also planning to view the impact, there were a lot of constraints on the location -- the impact plume had to rise out of the crater and into sunlight, and it had to be visible from Earth," said Chin.

Prior to the impact, LRO's instruments worked together to map and provide details on the polar regions, according to Chin. For example, LRO's Lunar Orbiter Laser Altimeter (LOLA) instrument built up three-dimensional (topographic) maps of the surface. This data was plugged into computer simulations to see how shadows change as the Moon moves in its orbit, so that regions in permanent shadow could be identified. The Lunar Reconnaissance Orbiter Camera (LROC) helped by making images of the actual regions of light and shade, which were used to verify the simulation's accuracy. Finally, LOLA measured the depths of polar craters to find areas where the impact could still be seen from Earth.

Since hydrogen is a component of water, maps of lunar hydrogen deposits are useful for finding areas that might hold water. Preliminary hydrogen maps were provided by the spacecraft's Lunar Exploration Neutron Detector (LEND) instrument. Regions that had relatively high amounts of hydrogen were identified as the most promising for the impact.

"Over a year ago, we formally suggested Cabeus to the LCROSS principal investigator," said LEND principal investigator, Igor Mitrofanov of the Institute for Space Research, Moscow. "According to our current data, the regolith within the Cabeus impact crater may have the highest content of water anywhere on the Moon, perhaps up 4.0 percent weight."

"Originally, the LCROSS team was going with a site further north than the Cabeus crater, because it was better for Earth visibility," said Chin. "However, LEND revealed that the area did not have a high hydrogen concentration, but Cabeus did. Also, Diviner showed that Cabeus was one of the coldest sites, and LOLA indicated it was in permanent shadow. So, we were able to inform the decision to aim for Cabeus further south -- while it was a little less visible from Earth, Cabeus was ultimately better for what we were trying to find."

Temperature maps from LRO's Diviner instrument were also crucial to identify where the coldest places were.

David Paige, principal Investigator of the Diviner instrument from the University of California, Los Angeles, used temperature measurements of the lunar south pole obtained by Diviner to model the stability of water ice both at and near the surface.

"The temperatures inside these permanently shadowed craters are even colder than we had expected. Our model results indicate that in these extreme cold conditions, surface deposits of water ice would almost certainly be stable," said Paige, "but perhaps more significantly, these areas are surrounded by much larger permafrost regions where ice could be stable just beneath the surface."

"We conclude that large areas of the lunar south pole are cold enough to trap not only water ice, but other volatile compounds (substances with low boiling points) such as sulfur dioxide, carbon dioxide, formaldehyde, ammonia, methanol, mercury and sodium," Paige added.

UCLA graduate student and Diviner team member, Paul Hayne, was monitoring the data in real-time as it was sent back from Diviner.


Diviner brightness temperature swath acquired about 90 seconds after the LCROSS impact, the location of which is indicated by the white arrow. Based on the Diviner measurements, the impact site was heated to more than 380°C (1,300°F) Click HERE for larger view [UCLA/NASA/JPL/GSFC].

"During the fly-by 90 seconds after impact, all seven of Diviner's infrared channels measured an enhanced thermal signal from the crater. The more sensitive of its two solar channels also measured the thermal signal, along with reflected sunlight from the impact plume. Two hours later, the three longest wavelength channels picked up the signal, and after four hours only one channel detected anything above the background temperature."

Scientists were able to learn two things from these measurements: first, they were able to constrain the mass of material that was ejected outwards into space from the impact crater; second, they were able to infer the initial temperature and make estimates about the effects of ice in the soil on the observed cooling behavior.

Another LRO instrument, the Lyman-Alpha Mapping Project (LAMP), used data on the gas cloud to confirm the presence of the molecular hydrogen, carbon monoxide and atomic mercury, along with smaller amounts of calcium and magnesium, all in gaseous form.

"We had hints from Apollo soils and models that the volatiles we see in the impact plume have been long collecting near the Moon’s polar regions," said Randy Gladstone, LAMP acting principal investigator, of Southwest Research Institute (SwRI) in San Antonio, Texas. "Now we have confirmation."


The Lyman Alpha Mapping Project (LAMP) ultraviolet spectrograph onboard LRO observed the LCROSS plume as far-ultraviolet emissions from the fluorescence of sunlight by molecular hydrogen and carbon monoxide, plus resonantly scattered sunlight from atomic mercury, with contributions from calcium and magnesium. The observed light curve is well simulated by the expansion of a vapor cloud at a temperature of ~1000 kelvin, containing ~570 kilograms (kg) of carbon monoxide, ~140 kg of molecular hydrogen, ~160 kg of calcium, ~120 kg of mercury, and ~40 kg of magnesium [NASA/LRO/SwRI].

"The detection of mercury in the soil was the biggest surprise, especially that it’s in about the same abundance as the water detected by LCROSS," said Kurt Retherford, LAMP team member, also of SwRI.

"The observations by the suite of LRO and LCROSS instruments demonstrate the moon has a complex environment that experiences intriguing chemical processes," said Richard Vondrak, LRO project scientist at NASA Goddard. "This knowledge can open doors to new areas of research and exploration."

Related Links> NASA press release | Media briefing materials


View the full-size video, HERE.