|
| One of four "enigmatic" domes singled out in a segment of an LROC Wide Angle Camera (WAC) color mosaic released at the European Planetary Science Congress and the American Astronomical Society's Division for Planetary Sciences on October 7. Long suspected of being a separate species from more common volcanic features, like those of the Marius Hills, the Darney C 3 domes ("D" on the second image following) on the border of Mare Cognitum with Oceanus Procellarum (11.22°S, 333.5°E) may, instead, be fragments of a long obliterated lunar crust or islands, once high places now nearly buried by the flows that created the nearside's basins. LRO orbits 4559 and 4560, June 22, 2010; from 44.9 km altitude, resolution ~ 62.5 meters per pixel [NASA/GSFC/Arizona State University]. |
Editors Note: Fairly reliable elemental maps of the Moon have been around since the Apollo era, becoming more detailed as planetary scientists continue to comb through data obtained by Clementine (1994) and Lunar Prospector (1998-1999) (along with those of the flotilla of probes dispatched by ESA, Japan, India and China). The highest-resolution direct observations of the Moon are still being swept up by the record-shattering Lunar Reconnaissance Orbiter, now well into a third year in low lunar orbit and only beginning to show a degree of age after the loss of Mini-RF operations and a redundant gyro this past year.
In December LRO will be raised to a more stable 100 km-high orbit to save fuel after orbiting the Moon 11,000 times since arriving in lunar orbit in June 2009, and long after becoming the longest lasting lunar mission as well, returning more data than all previous Deep Space missions put together.
LRO teams continue to use earlier abaselines to map confirm the abundance of a variety of strategic elements on the lunar surface, and in unprecedented detail.A promise made for delivering such comprehensive high-resolution color maps and elemental surveys of the Moon is being fulfilled.
What follows is "value-added" detail from a widely-circulated press release about presentations made by the Lunar Reconnaissance Orbiter Camera (LROC) investigators to a joint meeting of the European Planetary Science Congress and the American Astronomical Society's Division for Planetary Sciences on October 7. Along with the elusive original demonstration images we've added a number of mosaics of images already released to the Planetary Data System.
 |
| From a partial map of the nearside lunar surface centered on the colorful contact zone bordering Mare Serenitatis and Mare Tranquillitatis, combining observations in visible and ultraviolet wavelengths and showing a 'treasure trove' of areas rich in titanium oxide. Titanium is a valuable element, key to helping scientists unravel mysteries of the Moon's interior. LROC investigators Mark Robinson and Brett Denevi presented the results at the European Planetary Science Congress and the American Astronomical Society's Division for Planetary Sciences on October 7. The relative blue color of the Tranquillitatis mare is due to a higher abundances of the titanium-bearing mineral ilmenite. Direct study of samples gathered by Cernan and Schmitt (Taurus Littrow, Apollo 17, December 1972) aided in establishing baselines for comparable elemental signatures. Enhanced color formed as 689 nm filter image in red, 415 nm in green, and 321 nm in blue. See the full size demonstration image HERE [NASA/GSFC/Arizona State University]. |
 |
Titanium relative abundance mapped
by Clementine (1994). |
From: EPSC/ASA Joint Meeting 2011
Press Notice - October 7
Subtly Shaded Map of Moon
Reveals Titanium Treasure Troves
"Looking up at the Moon, its surface appears painted with shades of grey -- at least to the human eye. But with the right instruments, the Moon can appear colorful," said Mark Robinson, of Arizona State University. "The maria appear reddish in some places and blue in others. Although subtle, these color variations tell us important things about the chemistry and evolution of the lunar surface. They indicate the titanium and iron abundance, as well as the maturity of a lunar soil."
The Lunar Reconnaissance Orbiter Camera (
LROC) Wide Angle Camera (WAC) is imaging the surface in seven different wavelengths at a resolution of between 100 and 400 metres per pixel. Specific minerals reflect or absorb strongly certain parts of the electromagnetic spectrum, so the wavelengths detected by LROC WAC help scientists better understand the chemical composition of the lunar surface.
Robinson and his team previously developed a technique using Hubble Space Telescope images to map titanium abundances around a small area centred on the Apollo 17 landing site. Samples around the site spanned a broad range of titanium levels. By comparing the Apollo data from the ground with the Hubble images, the team found that the titanium levels corresponded to the ratio of ultraviolet to visible light reflected by the lunar soils.
“Our challenge was to find out whether the technique would work across broad areas, or whether there was something special about the Apollo 17 area,” said Robinson.
Robinson’s team constructed a mosaic from around 4000 LRO WAC images collected over one month. Using the technique they had developed with the Hubble imagery, they used the WAC ratio of the brightness in the ultraviolet to visible light to deduce titanium abundance, backed up by surface samples gathered by Apollo and Luna missions.
The new map shows that in the mare titanium abundances range from about one percent to a little more than ten percent. In the highlands, everywhere TiO2 is less than one percent. The new titanium values match those measured in the ground samples to about one percent.
 |
| From a full-resolution LROC Wide Angle Camera three-color composite (566 nm filter image in red, 360 nm in green, and 321 nm in blue), "Figure 2" accompanying the October 7 press release, highlighting regions with varying mare compositions and certain of the more "enigmatic" small volcanic domes. The area shown is a familiar nearside territory, west longitude from around 340° to 320° and from the equatorial landing sites of Apollo 12 and 14 down to 21° south. View the full size image accompanying the October 7 press release HERE [NASA/GSFC/Arizona State University]. |
 |
| Designated by the letter "H" in 'Figure 2' immediately above is 'the Helmet," apparently the official designation for the enigmatic dome previously known as Agatharchides 1 (and "the Fireman's Hat) for the associated crater group, may be an island of ancient crust 60 km wide floating northeast of Mare Humorum (18.2°S, 328.9°E). Mosaic of three LROC WAC observations in the 643 nm band, January 27, 2011 [NASA/GSFC/Arizona State University]. |
“We still don’t really understand why we find much higher abundances of titanium on the Moon compared to similar types of rocks on Earth. What the lunar titanium-richness does tell us is that the interior of the Moon had less oxygen when it was formed, knowledge that geochemists value for understanding the evolution of the Moon,” said Robinson.
Lunar titanium is mostly found in the mineral ilmenite, a compound containing iron, titanium and oxygen. Future miners living and working on the Moon could break down ilmenite to liberate these elements. In addition, Apollo data shows that titanium-rich minerals are more efficient at retaining particles from the solar wind, such as helium and hydrogen. These gases would also provide a vital resource for future human inhabitants of lunar colonies.
“The new map is a valuable tool for lunar exploration planning. Astronauts will want to visit places with both high scientific value and a high potential for resources that can be used to support exploration activities. Areas with high titanium provide both – a pathway to understanding the interior of the Moon and potential mining resources,” said Denevi, from John Hopkins University.
 |
| Based on it's spectacular rays and highly reflective deeper anatomy Giordano Bruno (35.9°N, 102.8°E) had once been believed the result of a very recent event, perhaps even a famous 12th century phenomena witnessed and recorded by European monks. Though that theory fell by the wayside some time ago, LROC Wide Angle Camera UV imagery has shown optical maturity by solar UV radiation occurs more rapidly than previously understood. In the LROC WAC UV mosaic below, more or less matching the area shown above of global lunar albedo mosaic from the 1994 Clementine mission, the wider area affected by the G. Bruno event is far less dramatic [NASA/DOD/VMA6]. |
 |
| On the other hand, in the LROC global UV mosaic (Figure 3 from the Oct. 7 press release: Color Ratio 321 nm / 415 nm), the full extent of the Goddard/Mare Marginis albedo swirl, contrasts with it's background quite well. The coincident crustal magnetic anomaly is antipodal to Mare Orientale, which, though the youngest of the classic impact basins is still estimated at over 3 billion years old. This image adds evidence to the theory that lunar swirls associated with fossil magnetic fields must result from a more dynamic phenomena than merely deflection of solar radiation by magnetic fields. Shedding and retaining charged sub-micron regolith must, in no small part, be linked with the Moon's "daily" dusty atmospheric cycles [NASA/GSFC/Arizona State University]. |
The new maps also shed light on how space weather changes the lunar surface. Over time, the lunar surface materials are altered by the impact of charged particles from the solar wind and high-velocity micrometeorite impacts. Together these processes work to pulverize rock into a fine powder and alter the surface’s chemical composition and hence its colour. Recently exposed rocks, such as the rays that are thrown out around impact craters, appear bluer and have higher reflectance than more mature soil. Over time this ‘young’ material darkens and reddens, disappearing into the background after about 500 million years.
“One of the exciting discoveries we’ve made is that the effects of weathering show up much more quickly in ultraviolet than in visible or infrared wavelengths. In the LROC ultraviolet mosaics, even craters that we thought were very young appear relatively mature. Only small, very recently formed craters show up as fresh regolith exposed on the surface,” said Robinson.
SCIENCE CONTACTS:
Mark Robinson
Arizona State University
School of Earth and Space Exploration
E-mail: robinson@ser.asu.edu
http://ser.sese.asu.edu/
Brett Denevi
The Johns Hopkins University
Applied Physics Laboratory
Brett.Denevi@jhuapl.edu
 |
| Figure 4 from the October 7 press release compares the familiar Reiner Gamma swirl in the visual with the UV (right), as seen in LROC WAC mosaics. Nearside swirls differ from those on the farside. They are fewer and none are linked with basin-forming impacts on the opposite side of the Moon. The beauty of the swirl at Reiner Gamma and the much more vague bright albedo of the Descartes Formation are associated with the strongest crustal magnetic anomalies yet mapped. Reiner Gamma is almost certainly linked geologically with the Marius Hills. Regardless, in ultra-violet, Reiner y seems too fresh and too superficial for an airless body whose surface is gardened every 2 million years. The Moon's dusty surface may be migrating very slowly, but it is surely on the move [NASA/GSFC/Arizona State University]. |
|
 |
| A seventy kilometer-wide field of view LROC WAC mosaic swept up during two orbital passes last May. The yellow box show the roughly 2.5 km-wide Narrow Angle Camera field of view shown in the last image, below. Something is allowing the radiation-linked maturation of lunar regolith in the dark lanes of Reiner Gamma and continually keeping the dust at the surface of its bright albedo fresh and optically (and UV) "immature." The intense crustal magnetism closely incidental with this very long but very superficial swirl anomaly may be linked to sub-surface flows of melt and remelted materials originating in the Marius Hills, where the swirl has a clear terminus, 200 kilometers to the northeast. Though the local magnetic field may be intense enough to refract solar radiation it is insufficient at repelling more energetic (or, admittedly less frequent) cosmic rays. Though less frequent, the latter would have had sufficient time to mature the brighter regions over the last 900 million years. Instead, it was proposed in 2008 by one of us (and more recently by Carle Pieters, et.al.) that a far more dynamic, seasonal and daily cycle of lunar dust formation, charging, discharging and relentless migration is being disrupted at these locations [NASA/GSFC/Arizona State University]. |
|
 |
| LROC Narrow Angle Camera (NAC) observation M114342150L, LRO orbit 1984, December 1, 2009 [NASA/GSFC/Arizona State University]. |
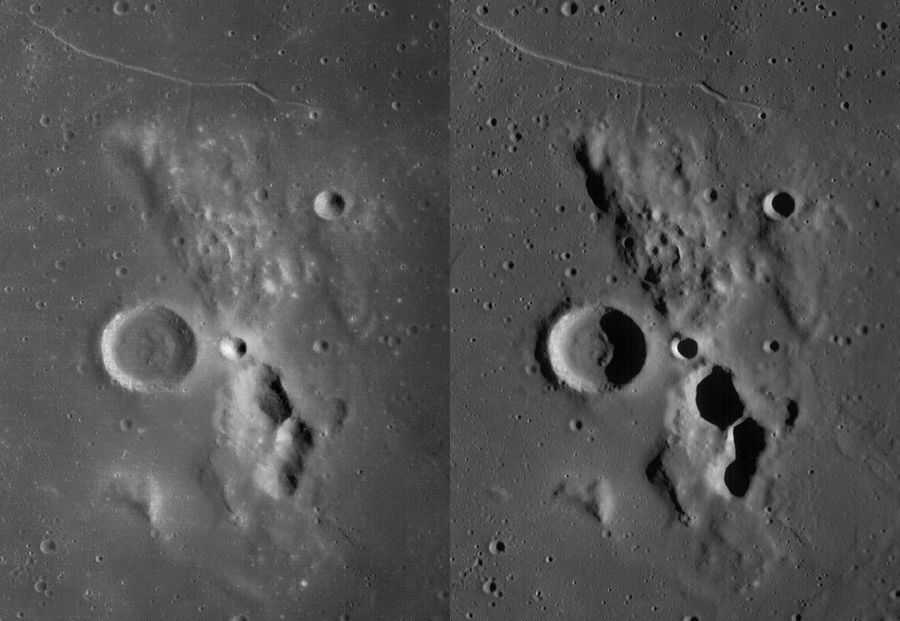 |
| Juxtaposed LROC WAC mosaics of the Lassell dome formation designated with the letter "L" in the third image from the top in this posting, Figure 2 from the October 7 press release. From LRO orbital observations under different angles of incidence. M129350040CE, orbit 4195, May 24, 2010 (phase angle 55.94°) and M147041474CE, orbit 6803, December 15, 2010 (phase angle 76.89°) [NASA/GSFC/Arizona State University]. |