Showing posts with label GLD100. Show all posts

Wednesday, June 11, 2014

The original interplanetary mountaineers

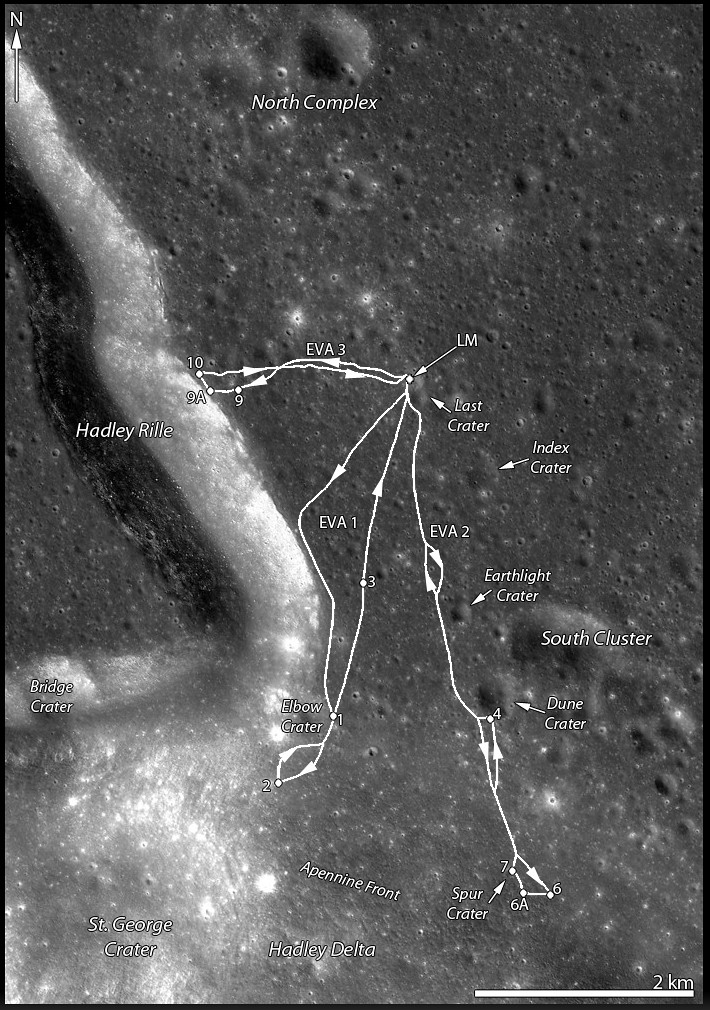
Traverse plots of Apollo 15 EVA 1 & 2 (August 1 and 2, respectively), the routes astronauts Dave Scott and Jim Irwin drove south to the lower slope of Mons Hadley Delta (from the "Elbow" bend in Rima Hadley, southward, toward the left). Elevations above that of the landing site (LM). For scale, the dogleg distance the astronauts travelled from the LM to Elbow crater along the edge of Hadley Rille over EVA 1 is roughly 4.5 km. Oblique LROC NAC mosaic M1123519889RL, LRO orbit 17751, May 18, 2013; spacecraft and camera slew 55.21° from orbital nadir, 76.87° angle of incidence, resolution 2.87 meters from 130.27 km over 26.11°N, 11.15°E  [NASA/GSFC/Arizona State University].
J. Stopar
LROC News System

The lofty Apennine Mountain Range has two prominent peaks near the Apollo 15 landing site: Mons) Hadley (relative height 4 km) to the northeast and Mons Hadley Delta (3.5 km) toward the south.

Between these two peaks lies the "Swann Range," named for Apollo 15 Geology Team Leader Gordon Swann.

The Apennine Mountain Range contains some of the largest peaks on the Moon Mons Hadley rivals the prominences of notable terrestrial mountains like Mt. Rainier and Mt. Fuji, and Mt. Erebus in Antarctica when measured from base to summit.
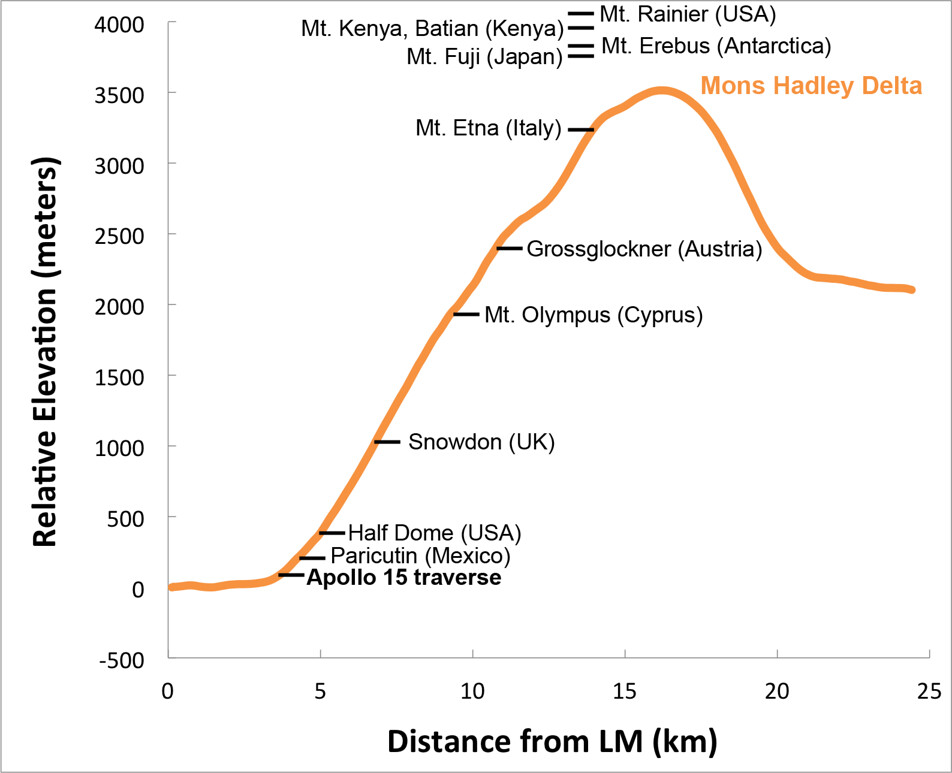
Elevation profile of Mons Hadley Delta, measured from the Apollo 15 landing site (left) through the peak (right); data from the LROC WAC-derived GLD100 Digital Terrain Model (DTM), with relative heights of notable terrestrial mountains shown for scale. Mons Hadley Delta is not the largest peak in the Apennines, and Scott and Irwin scaled only a small portion of the mountain's contact zone with the Hadley Delta plain [NASA/GSFC/Arizona State University].
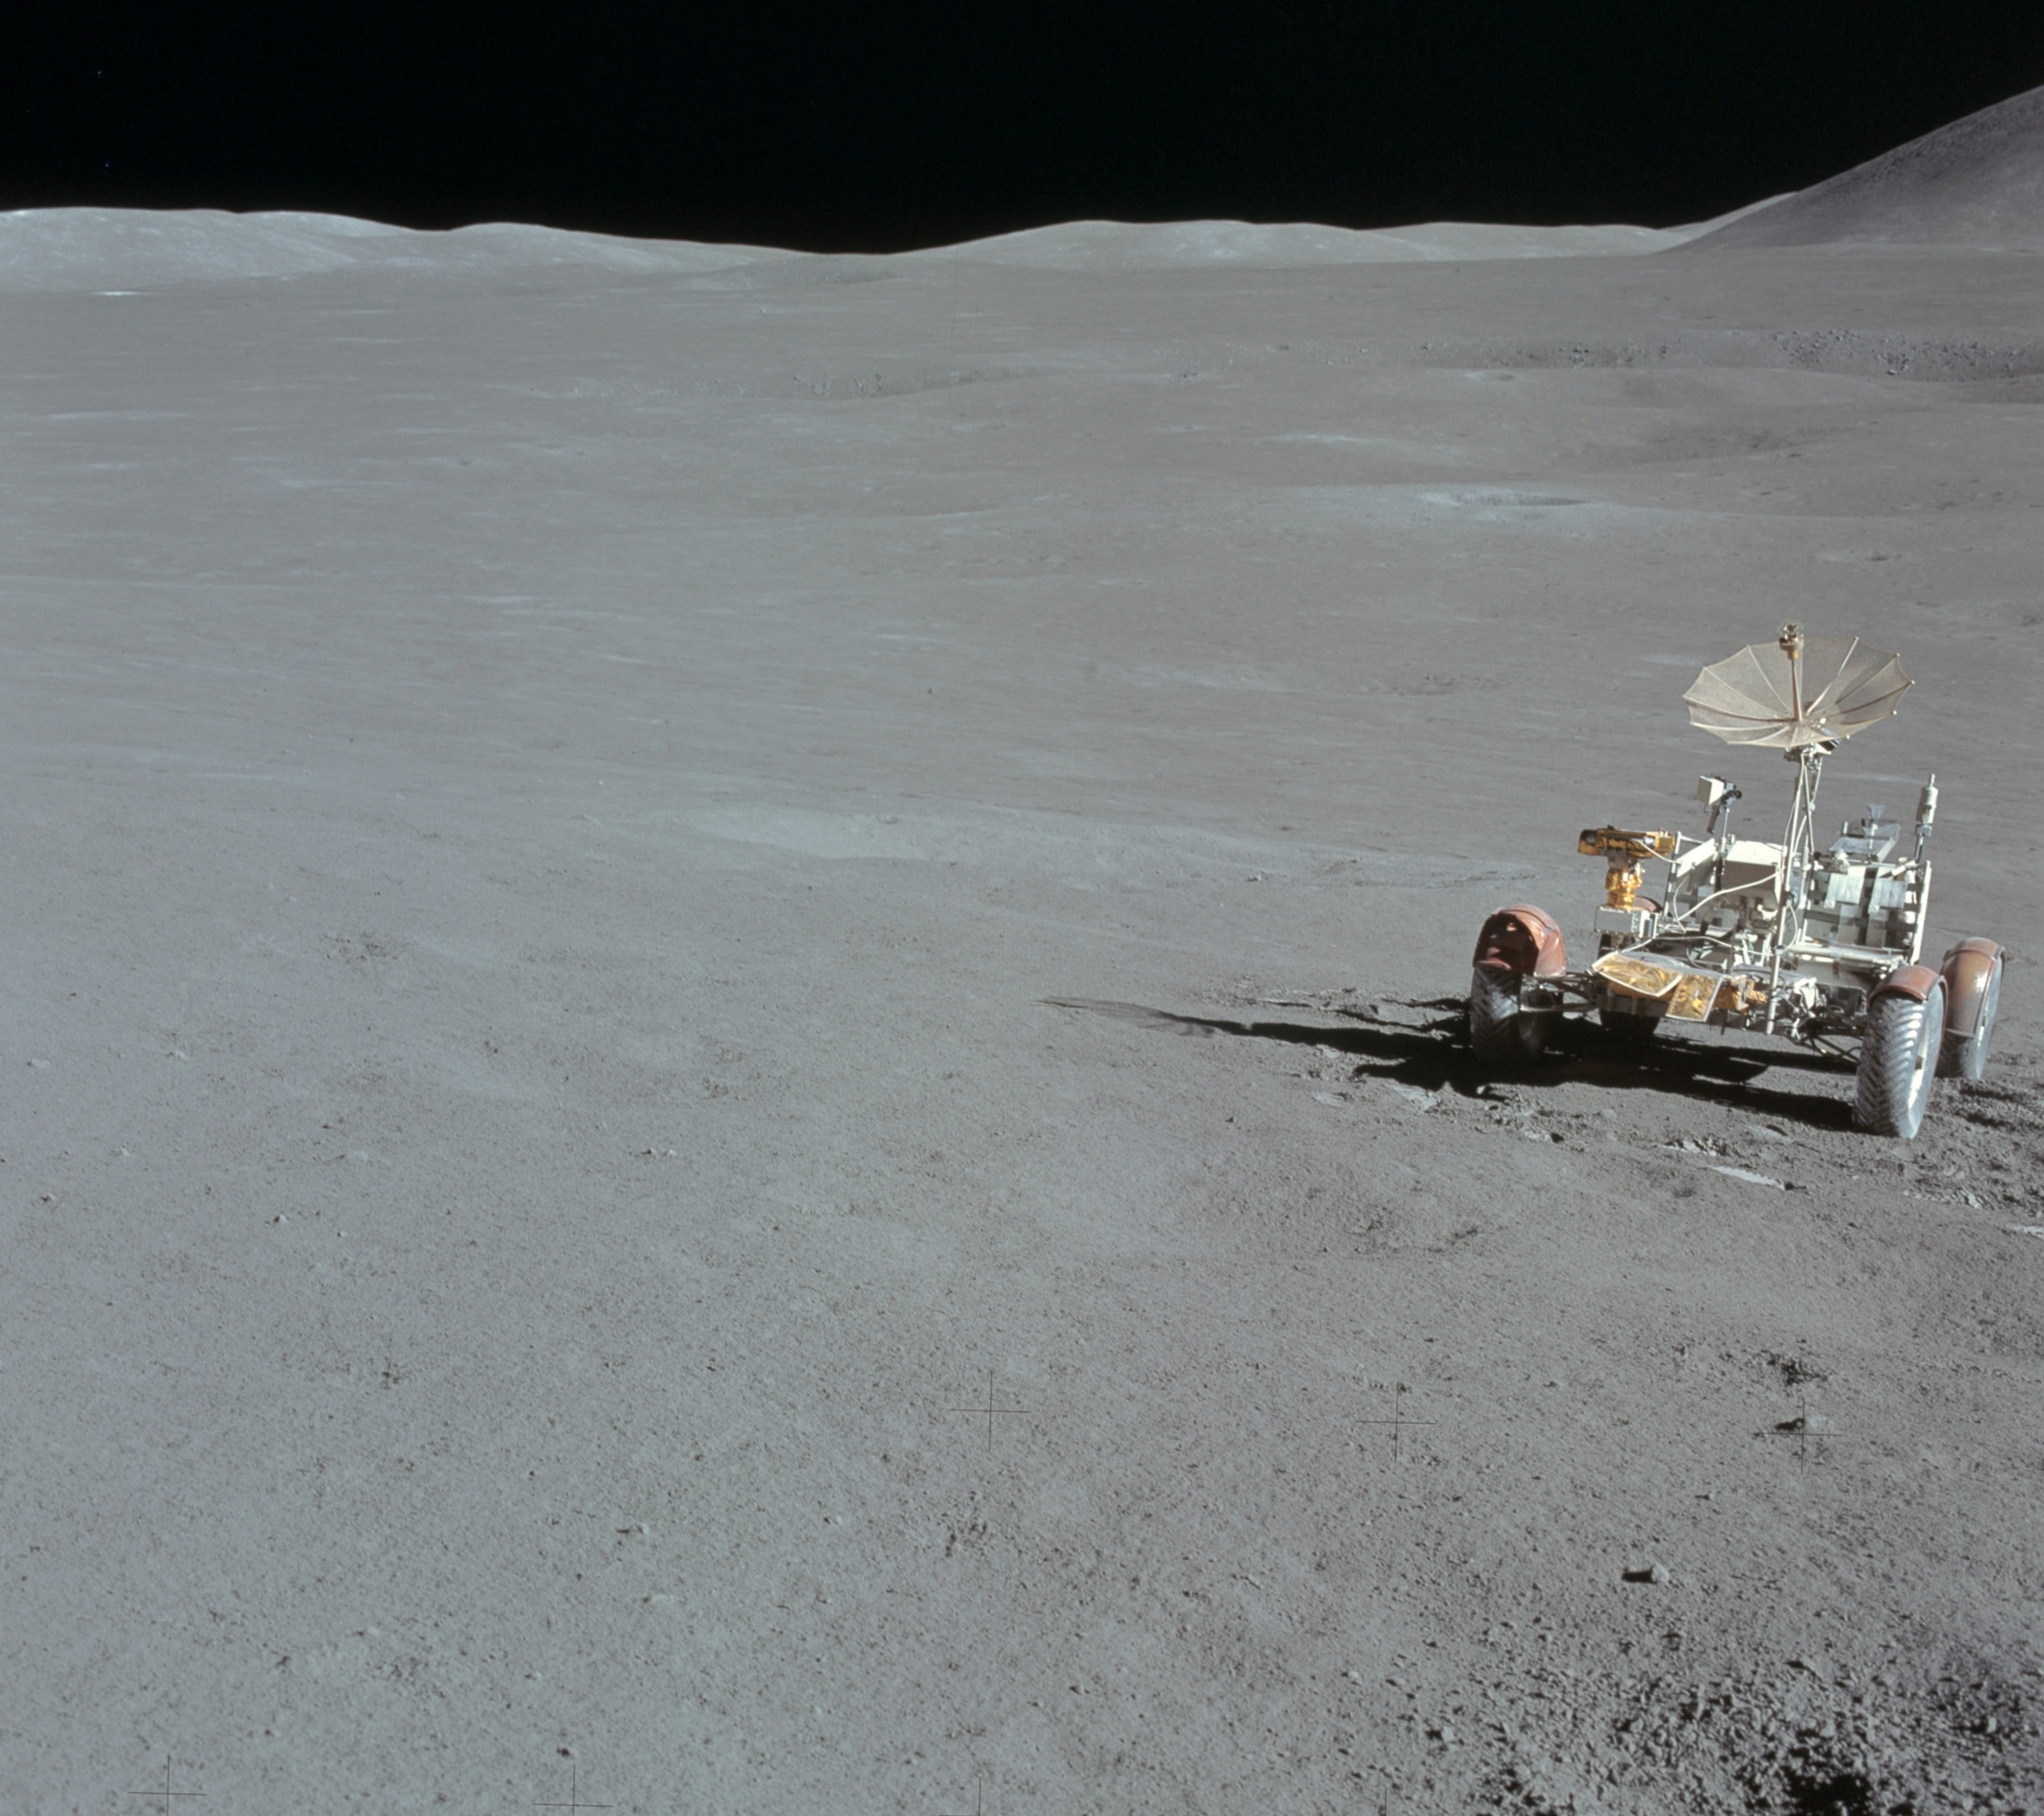
The first Apollo 15 EVA took astronauts David Scott and James Irving southward along the edge of Hadley Rille and to the base of Mt. Hadley Delta near St. George crater. This traverse took them to a height of just over 65 meters above the landing site on the mare plain. At this height, much of the surface material of the mountain comprises debris that, over eons, slid down the upper slopes through mass-wasting. Materials collected in this area primarily consist of regolith, as there are very few surface boulders.

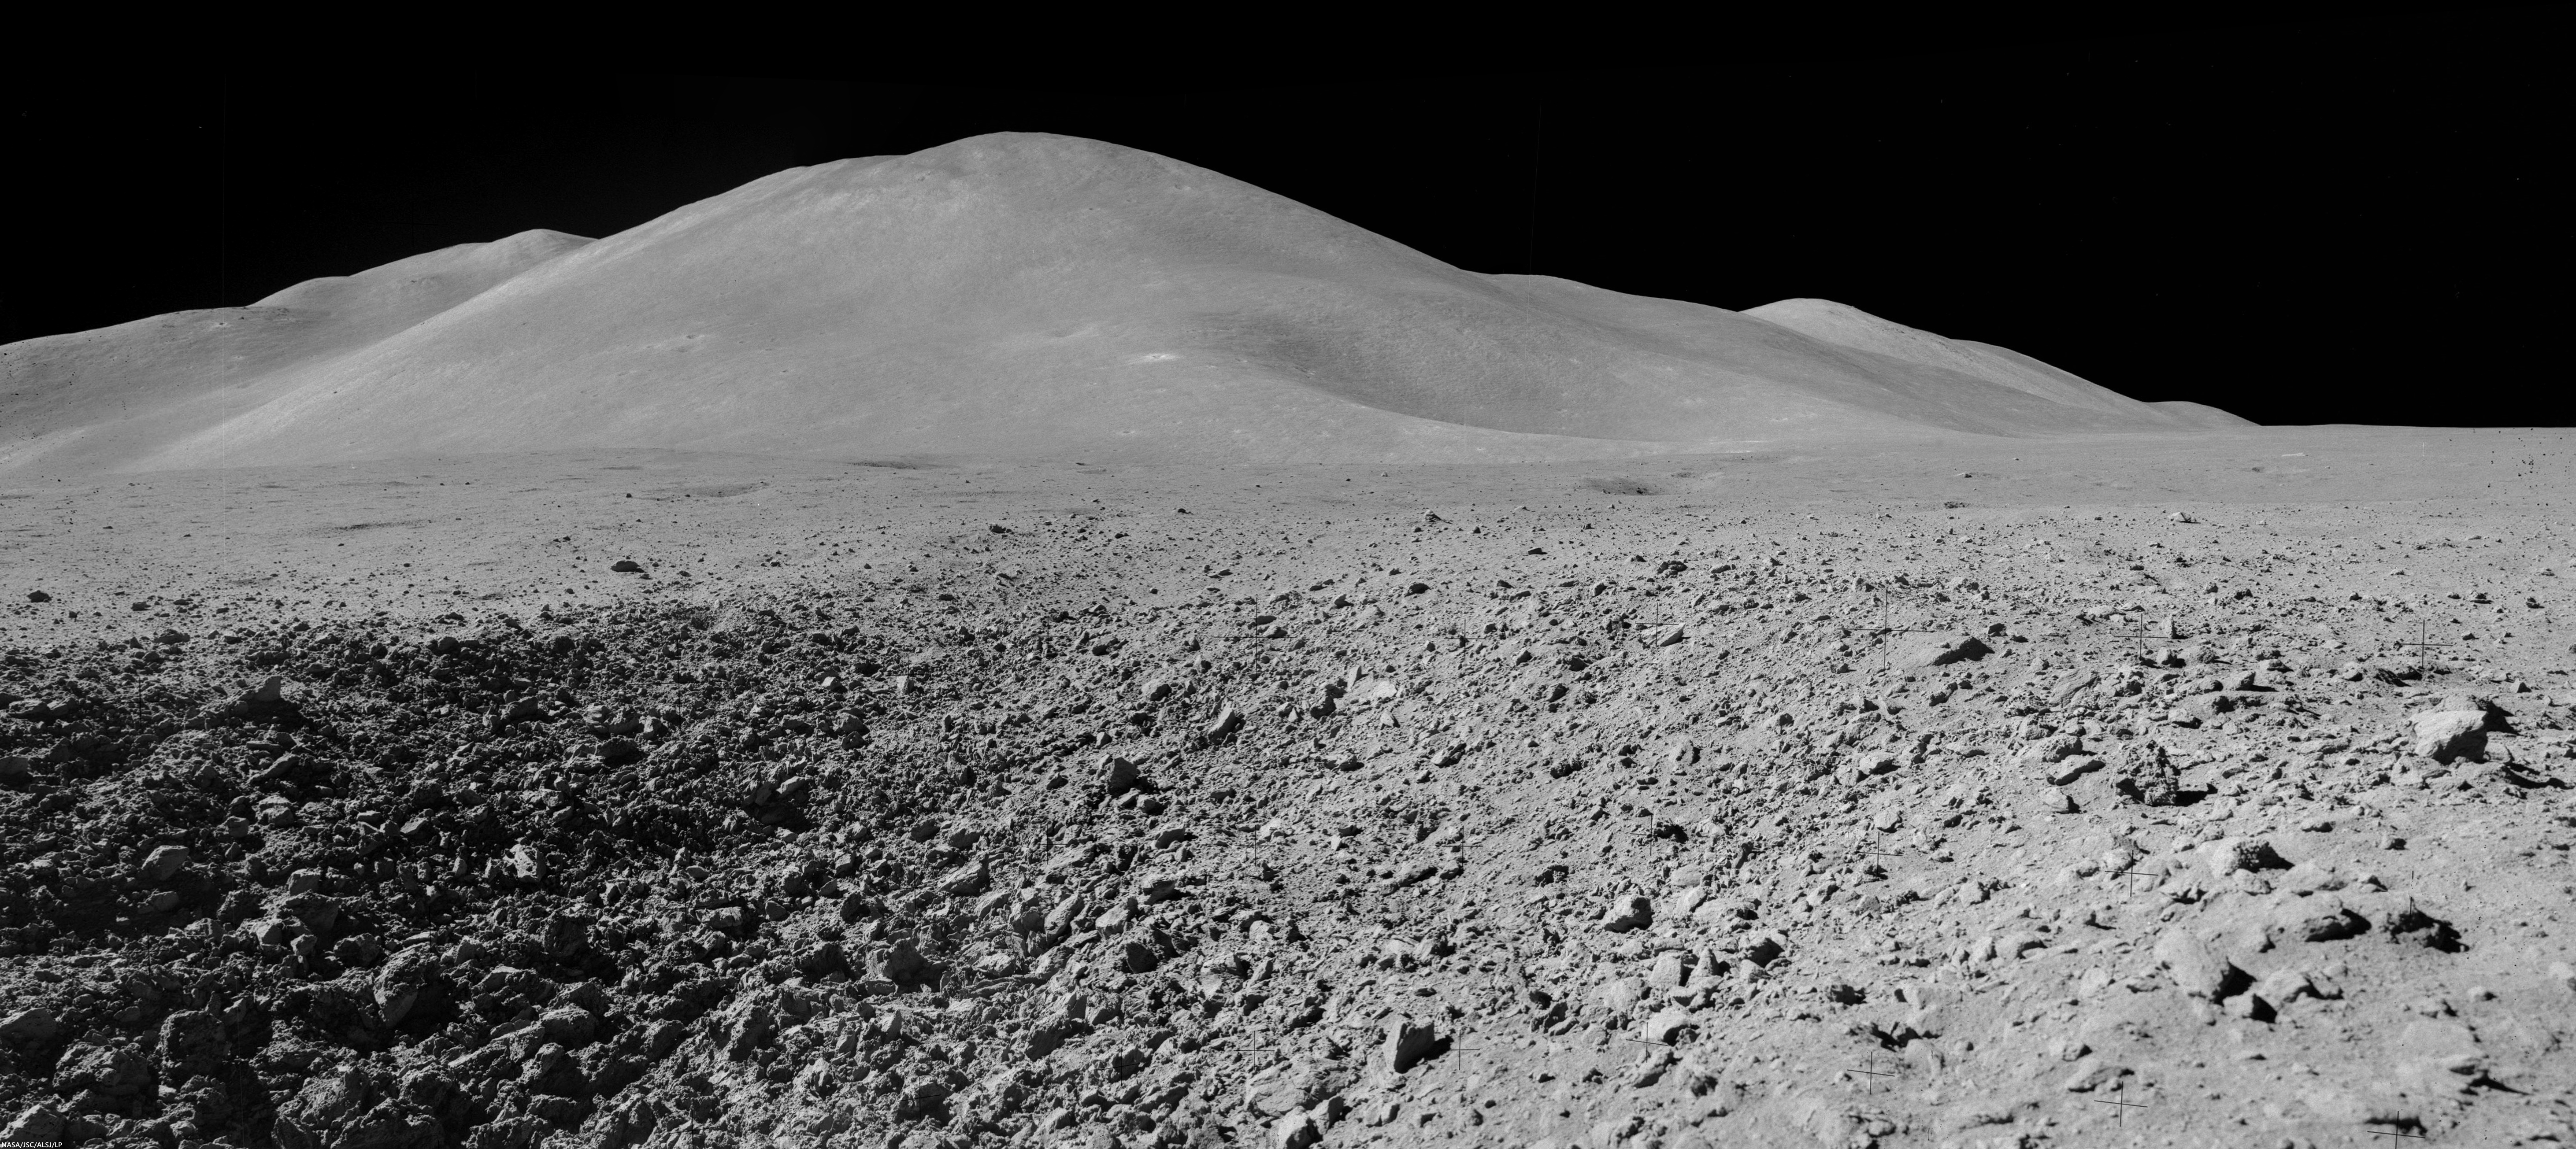
Mons Hadley Delta (high-resolution mosaics HERE); Mosaic of Dave Scott's Station 9 panorama (AS15-82-11084-88), from northeastern wall of the "Station 9 crater," a relatively fresh 15 meter-wide feature characterized by soft clod-like blocks of pressure-pressed regolith formed at small impact. Station 9 crater is about 240 meters immediately northeast of Rima Hadley; Apollo 15 (EVA 3), August 2, 1971 [Dave Scott/NASA/JSC/ALSJ].
The second EVA took the astronauts southeast to "South Cluster" and Spur craters. At Spur crater, a very old crystalline rock fragment was collected, containing evidence of geologic processes more than 4 billion years old and representing a piece of the original anorthositic crust of the Moon. They also discovered an unusual green material composed of volcanic glass.

This traverse ascended about 95 meters in elevation, up the base of Mons Hadley Delta. At times, the slope was steep enough (~ 18°) that the rover had difficulty getting traction, and the mountain peak loomed so high overhead, that the astronauts could not lean back far enough to get it in the frame of their cameras.

Apparent outcrops (arrows) may represent a high-lava mark approximately 85 meter up the south slope of Mons Hadley. AS15 magazine 84. View a more dramatic mosaic from this panorama HERE [NASA/JSC/Apollo 15 Lunar Surface Journal/Arizona State University].
During this traverse, the astronauts commented that they thought they could detect a high-mark where lava might once have filled the basin at the base of nearby Mt. Hadley around a height of 85 meters above the current mare plain.

LROC projection with traverse courses of Apollo 15 expedition to Hadley Delta, July 30-August 2, 1971 [NASA/GSFC/Arizona State University].
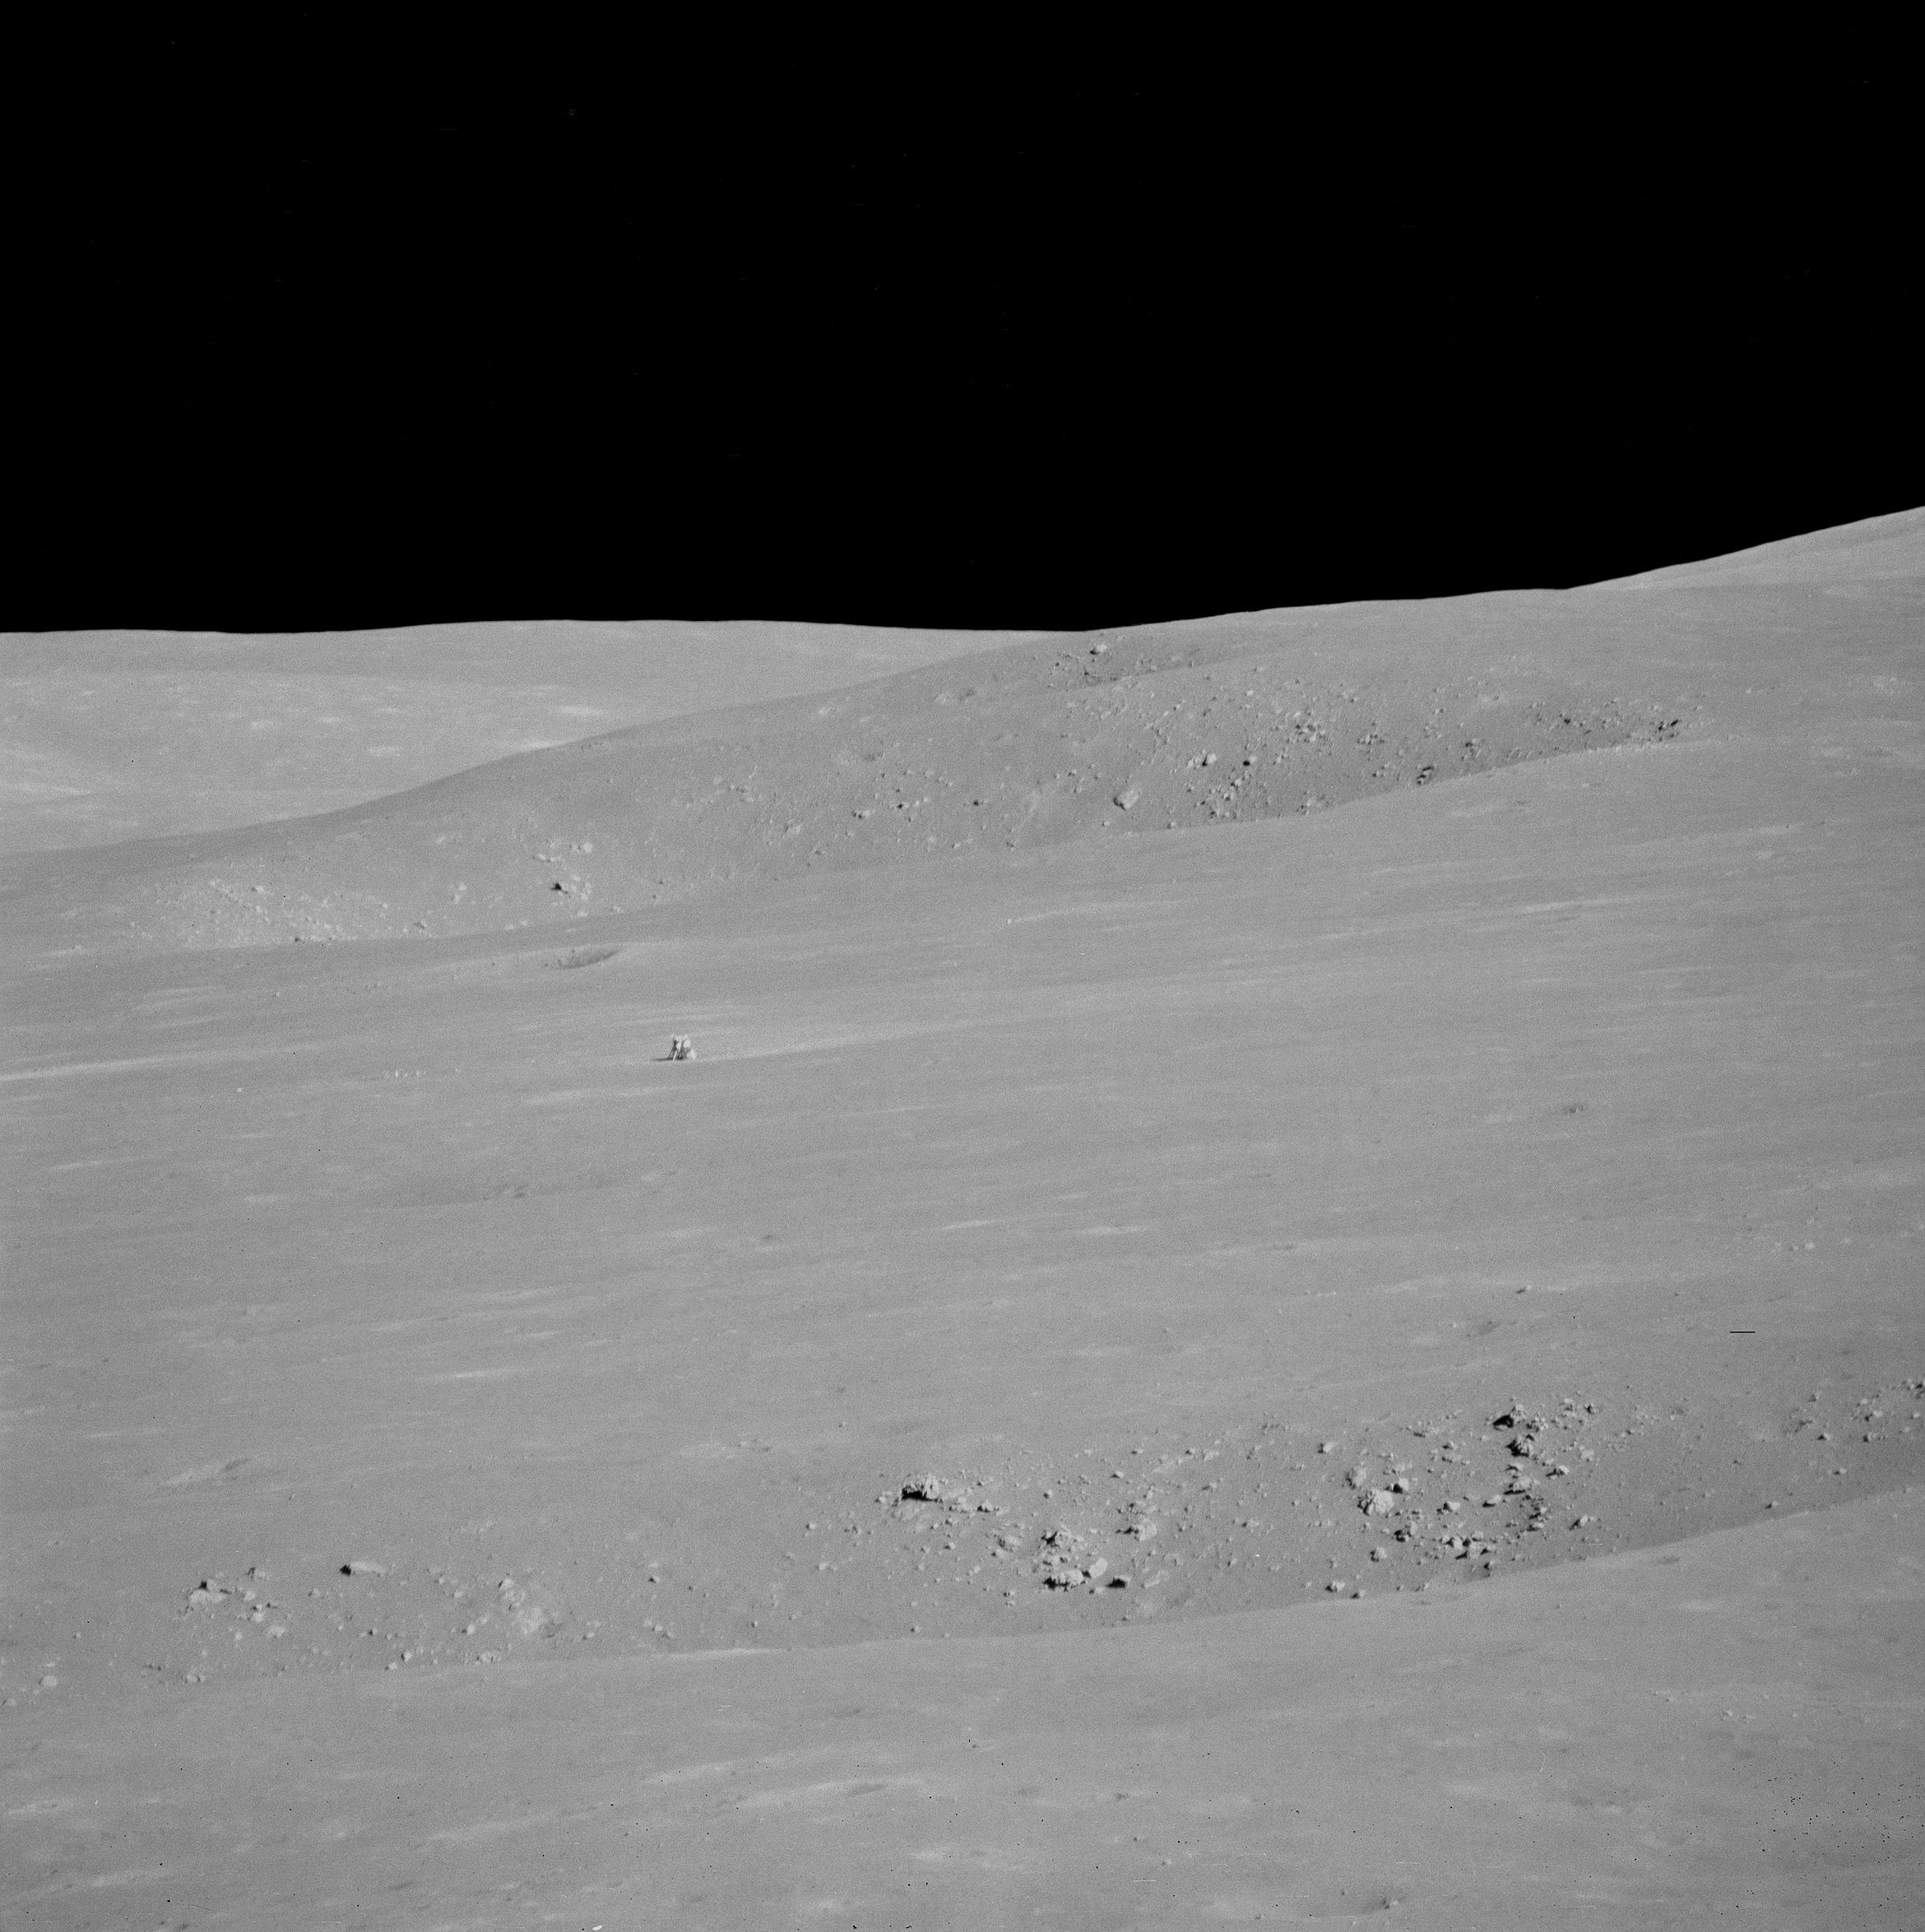
From Science Station 6. It definitely worthwhile to see a larger, high-resolution mosaic of this, reported to be Dave Scott's favorite photograph from the expedition (HERE). Through a 500-mm lens, from Science Station 6 up on the Apennine Front, the lunar module Falcon and ALSEP components are seen from 4.7 km, backdropped by the North Complex crater group and flank of Mons Hadley, on the plain's opposite bank [NASA/JSC].
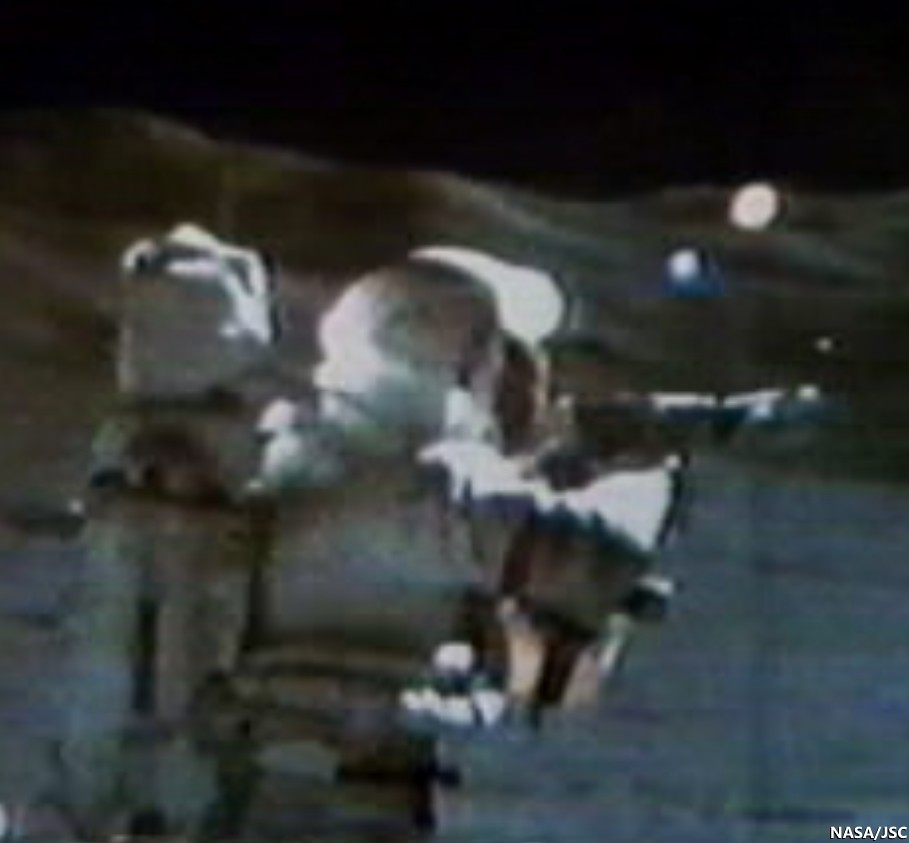
Apollo 15, Science Station 6, Spur Crater, on the Apennine Front, August 1, 1971. Dave Scott employs his 500 mm lens and black and white magazine 84 to capture the image immediately above, the Apollo 15 lunar module Falcon and North Complex crater group in context of the high mountains surrounding the Hadley Delta landing site. Still clipped from live video transmission relayed from remote-operated color TV camera on the lunar rover [NASA/JSC/ALSJ].
After capturing his black and white 500 mm panorama, Cmdr. Scott returned employed color magazine 86 and a less awkward smaller focal length. The reproduction here is too small to see the lunar module, but a much cleaner full resolution version is available HERE. Though it is not as detailed, and coherent backscatter is more problematic than the black and white at 500 mm, the full-resolution color image more closely matches the unaided human eye.  AS15-86-11618 [NASA/JSC/ALSJ].
While the Apollo 15 astronauts scarcely climbed the lower slopes of a lunar mountain, they made many important discoveries. What challenges, findings, and fun (like slope skiing) might future explorers experience on the powdery mountains of the Moon?

Explore the first two of the Apollo 15 traverses in more detail below by panning and zooming. The numbers indicate relative elevations of the paths travelled by the astronauts.

Related Posts:
Soaring Over Mighty Mt. Hadley
Apollo 15 departs Hadley Rille Delta
Water found in the Apollo 15 Genesis Rock
Follow the Tracks (Apollo 15)
Hadley Rille and the Mountains of the Moon
Retracing the Steps of Apollo 15 Constellation Region of Interest
Apollo 15 Laser Ranging Retroreflector: a Fundamental Point on the Moon
LROC's First Look at the Apollo Landing Sites
'Man's first wheels on the Moon' at 41 years
Bowditch Lava Terraces
Lunar Kipuka
Remnants of the Imbrium Impact
Hadley-Apennine: the Apollo 15 Landing Site
The Mighty Apennine Mountain Range
Layers near Apollo 15 Landing Site
LROC Explores Apollo 15 (YouTube video)
Kaguya captures Rima Hadley

Tuesday, October 15, 2013

Synthetic view of the Moon

201310151700z_syntheticview_1000b
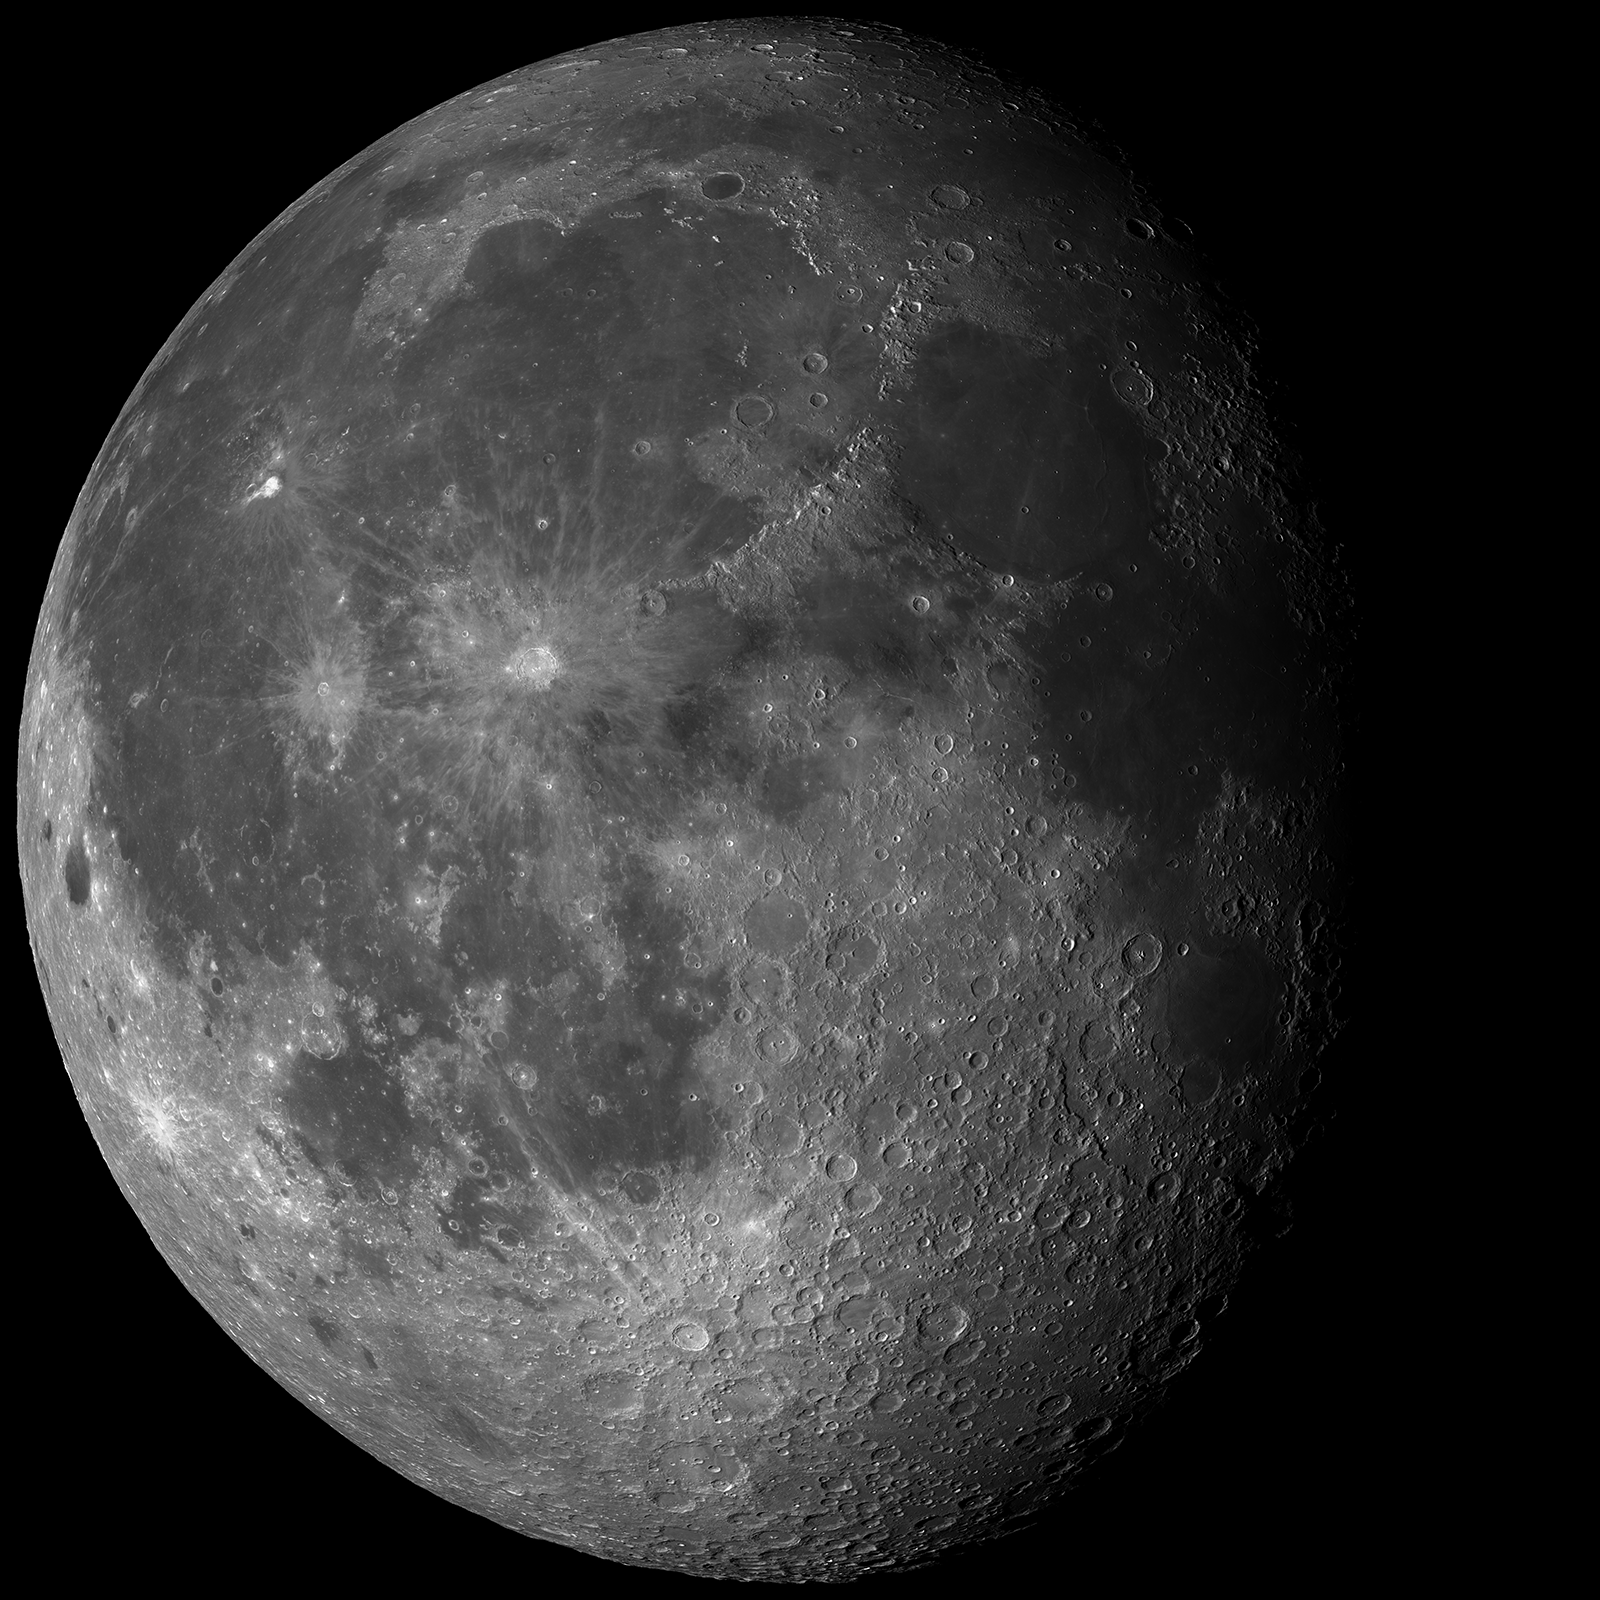
Synthetic view of the waxing Moon, created using a ray trance algorithm and data collected since 2009 by the enduring lunar orbiter LRO, including over 110,000 LROC Wide Angle Camera (WAC) observations. Simulated perspective from Earth, October 15, 2013, 17:00:00 UT [NASA/GSFC/Arizona State University].
Raquel Nuno
LROC News System

Today’s Featured Image is a simulated view of the Moon as seen from the Earth on Tuesday 15 October 2013 at 10 AM Mountain Standard Time (1700 UT, the time this blog post was released).

The Moon will not be in the sky over North America, but this is what the Moon will look like over Mumbai, India, where the local time in Tempe, Arizona will be 10:30 AM. This synthetic view was generated using a ray-tracing algorithm to place shadows and shading into the LROC WAC normalized reflectance map based on the topography portrayed by the WAC Global Lunar DTM (Digital Terrain Model) 100 m topographic model, or GLD100, and the LRO Lunar Orbiter Laser Altimeter (LOLA) topographic model of the lunar poles.

The normalized WAC reflectance map was generated from 110,000 WAC images, removing the effects of varying lighting geometries on the reflectance by calculating (or normalizing) reflectance at common illumination and viewing angles everywhere on the Moon (at the resolution of a 100 meter grid). For a detailed explanation of how the normalized map was generated check out this Featured Image post (and this spectacular rotation movie (100 plus mg .mov file) of the same map).


The second data product used to generate today’s synthetic view of the Moon was a global topographic map, that is a combination of two digital elevation models: the GLD100, and the LOLA topographic model of the lunar poles. We then combine the topography and the normalized images by draping the normalized reflectance map over the global topographic map; this step places the reflectance pixels in 3D space (latitude, longitude, radius). At this point the location and orientation of each pixel is known relative to the Sun such that shadows and shading can be accurately added to the reflectance map. A ray-tracing algorithm steps back from each pixel to the location of the Sun, and if it encounters another pixel along the way, the pixel is shadowed (see image below).

Finally, the relative reflectance is computed for each unshadowed pixel based on the calculated illumination and viewing angles. In a nutshell, we can generate a new view of the Moon at any lighting condition. Since the location of the Sun relative to the Moon is known through time, we can generate an image of how the Moon looked, or will look, on any date, like today's Featured Image!

Visual representation of how the ray tracing algorithm determines if a pixel is or is not in shadow. [Hanger, et al., 2013].

So why bother making synthetic images of the Moon when we can take images? We can see what the lighting will be for a certain feature along LRO’s flight path, and the ideal lighting conditions can be chosen to observe it, allowing us to optimize NAC targeting.

Check out the full synthetic image HERE.

Related Posts:
A Unique View Of The Moon (July 17, 2013)
LROC's new Global Lunar Topography (November 16, 2011)
Farside! And all the way around (March 11, 2011)

Tuesday, August 20, 2013

Karpinskiy, superpositioned on the farside north

Karpinskiy WACGLD 100m
LROC Wide Angle Camera (WAC) mosaic overlaid with WAC and NAC-derived GLD100 color-coded digital elevation model. Karpinskiy crater is approximately 90 kilometers across and nested within the remains of an even larger and more ancient crater [NASA/GSFC/Arizona State University].
Raquel Nuno
LROC News System


Karpinskiy crater, at 72.609°N, 166.801°E and (officially 91.403 km) in diameter, rests within a larger and far older unnamed crater. How do we know which crater is older? Stratigraphic studies, or the study of superposition of rock layers (or in this case, craters), will help determine the relative ages of craters here. Geologists derive relative ages between geological features by observing how they overlap - young formations will always overlie older formations, and on airless bodies, such as the Moon and Mercury, this method becomes particularly useful. Without wind to erode its surface, only four factors affect the lunar surface: space weathering, impacts, tectonism, and volcanic resurfacing. With respect to today’s Featured Image, the Moon accumulates impact craters over time. From the cratering record we can investigate not only stratigraphic relationships (which crater formed first), but we can also derive a quantifiable measure, or crater density, to determine relative ages on the Moon.

Karpinskiy passes under Kaguya
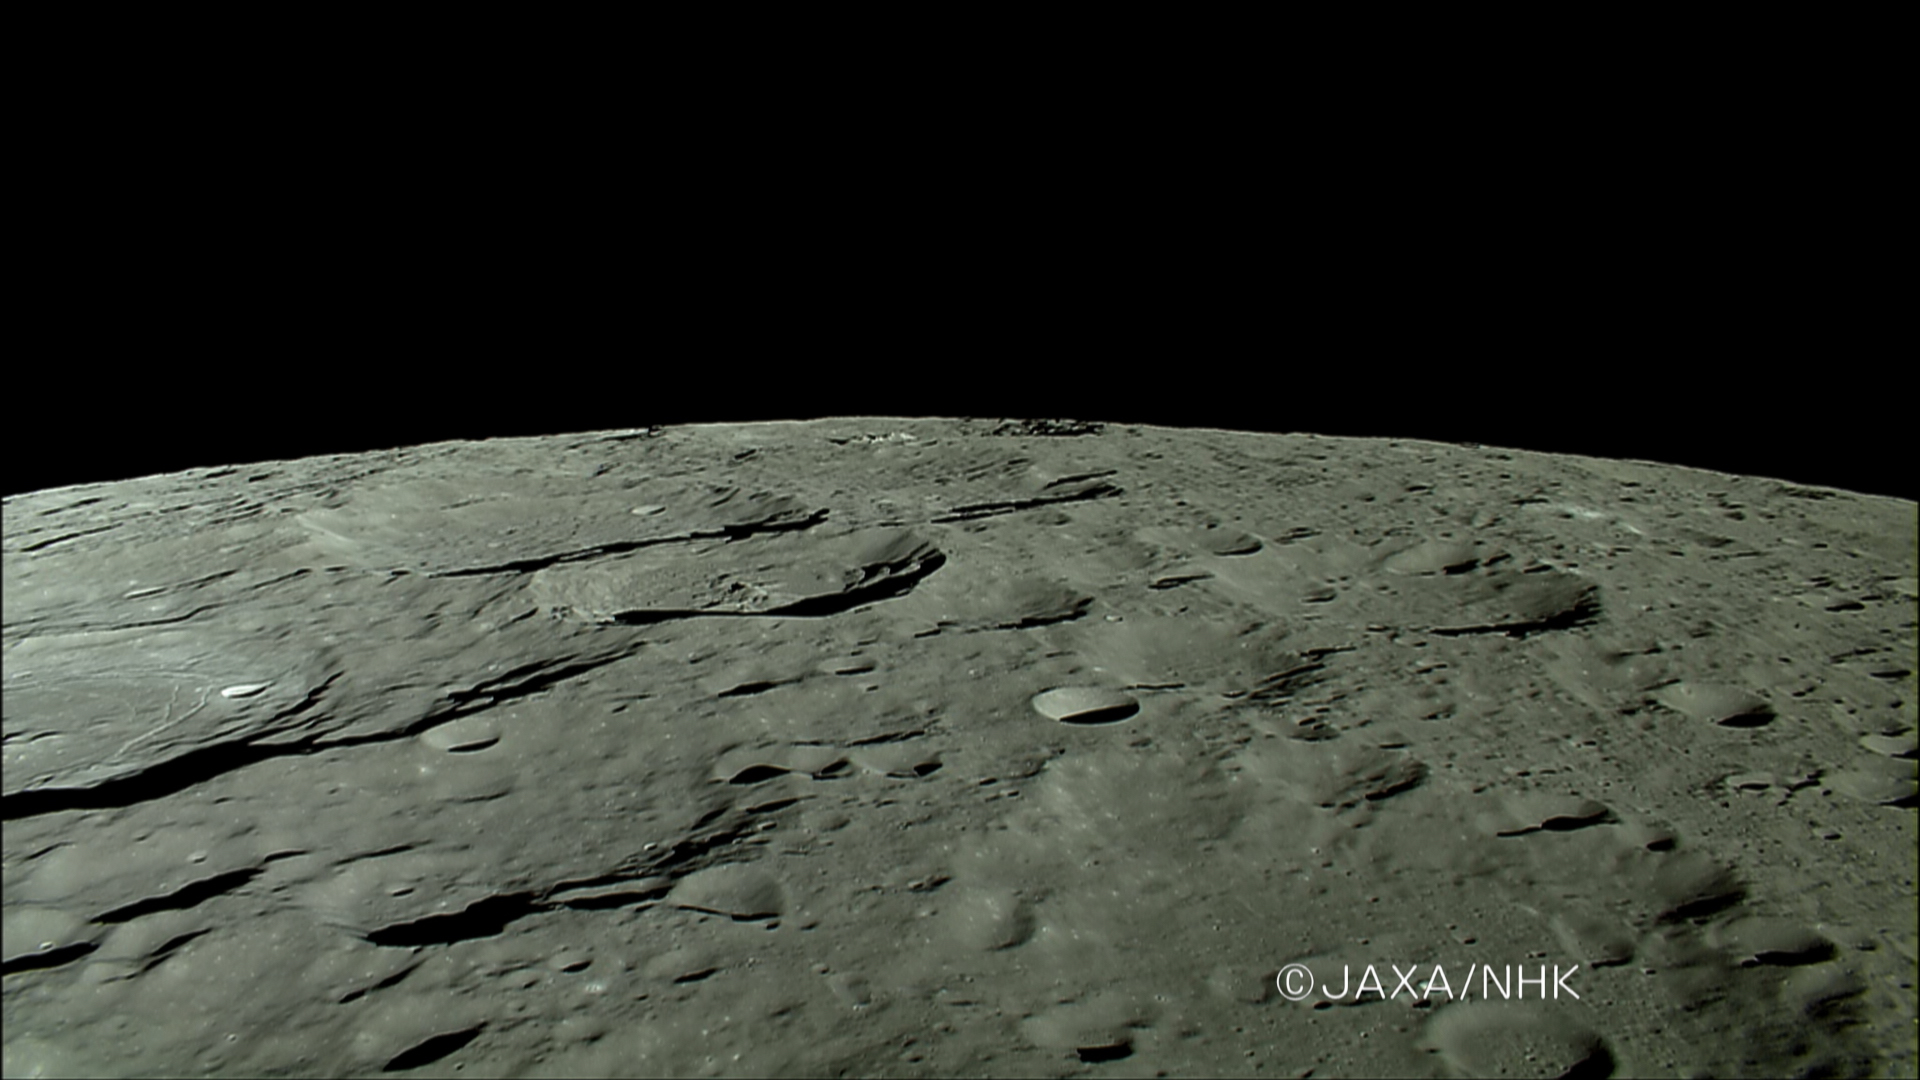
The HDTV camera onboard Japan's lunar orbiter Kaguya (SELENE-1) anticipates a rising Earth in 2007, looking north toward the Moon's north pole as it passes ancient craters of the Farside Highlands Terrain, including Karpinskiy, nested in a much older crater, passing out of view at left, followed by Milankovic and Plaskett. View the full-size image HERE [JAXA/NHK/SELENE].
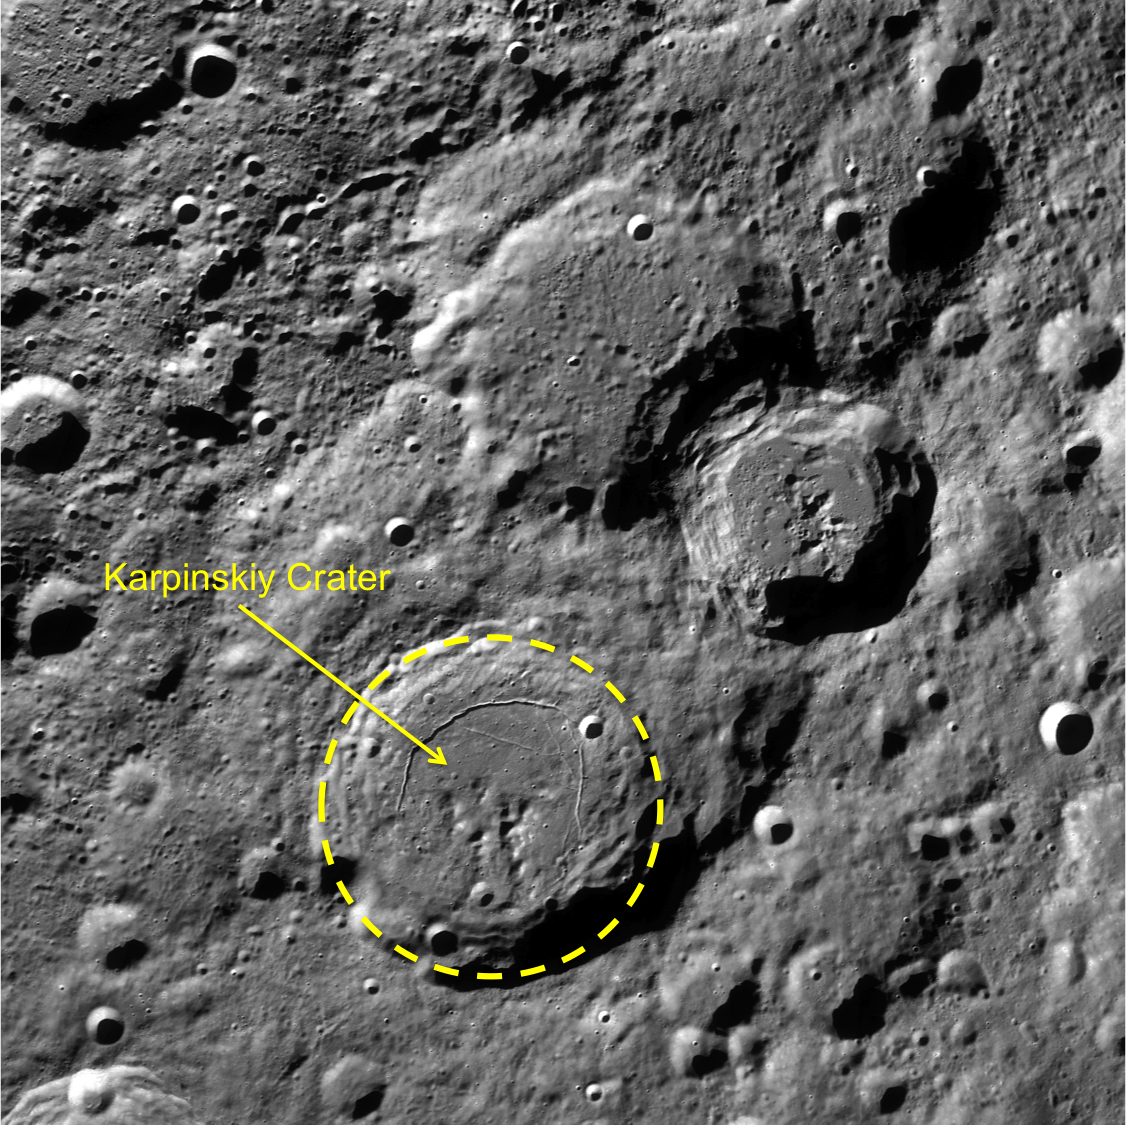
Today’s Featured Image is a great example for stratigraphic studies. The LROC WAC mosaic of Karpinskiy crater overlaid with the GLD100 color topography presents a clearer outline of the older crater (WAC mosaic below). The top portion of the image is black because the GLD100 product does not have coverage at that latitude (>79°N). Karpinskiy crater is located inside a much older, degraded crater that does not have a well-defined rim and is somewhat difficult to see in the WAC mosaic. Karpinskiy is younger because it superposes, or formed on top, of the unnamed older crater. There are younger craters superposed on the floor of Karpinskiy, that must have formed later and are therefore younger based on the relative age relationships. Thus, using stratigraphic relations we are able to derive a relative age for Karpinskiy, but what if we want to determine the absolute age? The number of craters that formed on Karpinskiy can be used to estimate its absolute age, however with such a small area the crater size frequency distribution absolute age estimate has a large uncertainty. To accurately determine the absolute age of Karpinskiy crater we have to go there and acquire samples of impact melt rock that we can radiometrically date!

Karpinskiy WAC superposition context
LROC WAC context image. Karpinskiy crater outlined in yellow, with the two neighboring craters to the north and east are Ricco, Milankovic and Milankovic E[NASA/GSFC/Arizona State University].
Explore the full image, HERE.

Related Posts:
Absolute Time
Copernicus Crater and The Lunar Timescale
Dating an Impact

Wednesday, July 17, 2013

A Unique View of the Moon

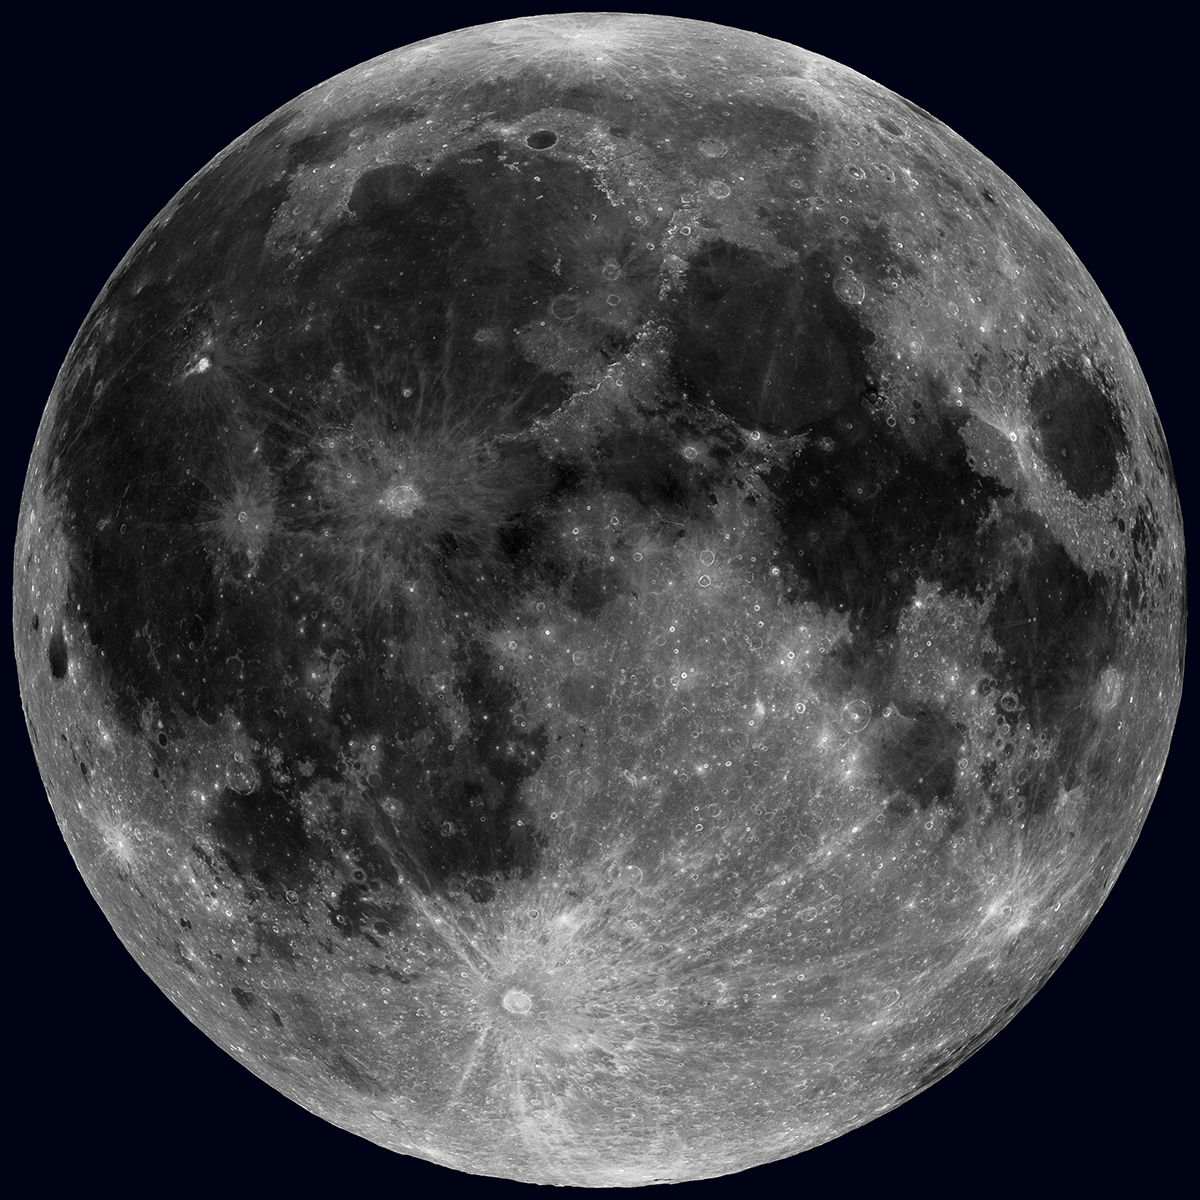
Nearside LROC WAC Reflectance - The Sun overhead, across the whole Moon! Of course this is not possible in real life, but 36 nearly complete WAC mosaics make this view possible [NASA/GSFC/Arizona State University].
Mark Robinson
Principal Investigator
Lunar Reconnaissance Orbiter Camera
Arizona State University

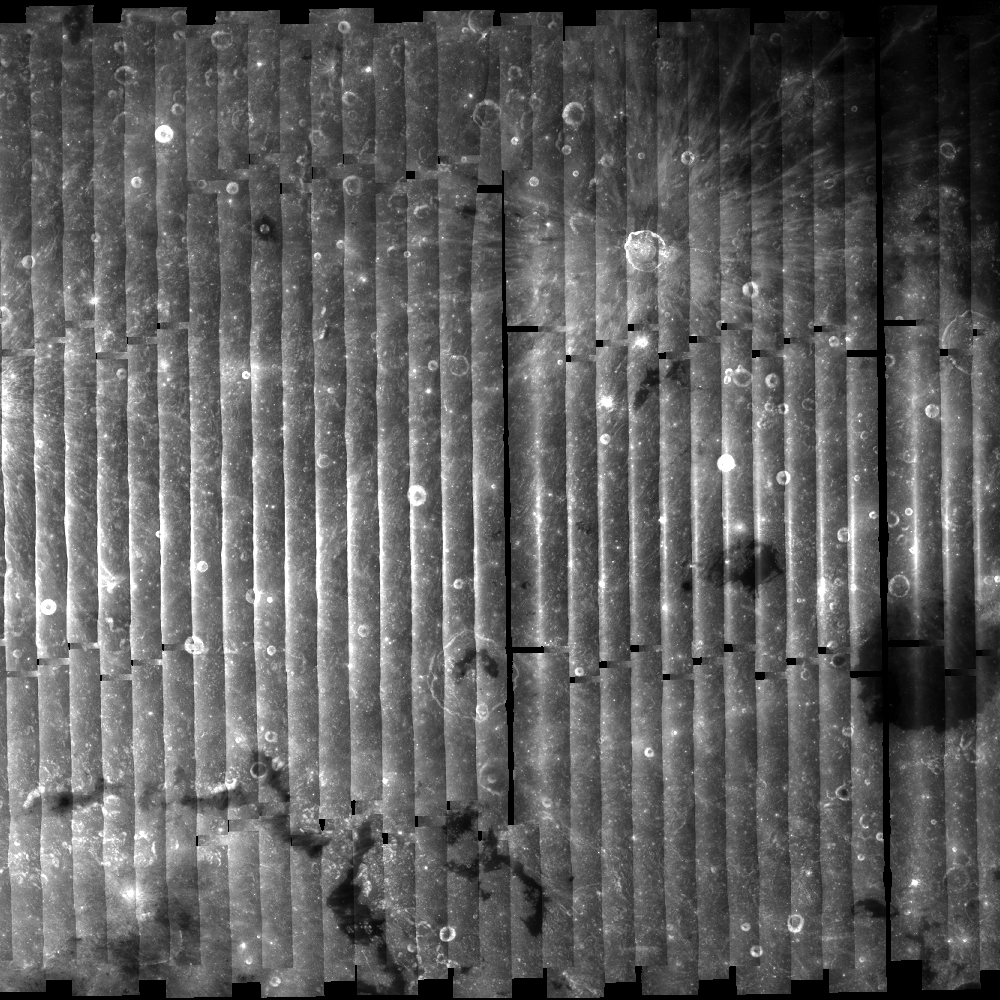
A huge payoff from the longevity of the LRO mission is the repeat coverage obtained by the LROC Wide Angle Camera (WAC). The WAC has a very wide field-of-view (FOV), 90° in monochrome mode and 60° in multispectral mode, hence its name. On the one hand, the wide FOV enables orbit-to-orbit stereo, which allowed LROC team members at the DLR to create the unprecedented 100 meter scale near-global (0° to 360° longitude and 80°S to 80°N latitude) topographic map of the Moon (the GLD100)! However, the wide FOV also poses challenges for mosaicking and reconstructing lunar colors because the perspective changes plus- and minus-30° from the center to the edges of each frame. The problem lies in the fact that the perceived reflectance of the Moon changes as the view angle changes. So for the WAC, the surface appears to be most reflective in the center of the image and less so at the edges, which is quite distracting! This effect results in a pole-to-pole striped image when making a "not-corrected" mosaic.

No photometry WAC mosaic  - Large area WAC mosaic illustrating reflectance differences due to 30° change in view angle from the center of a WAC frame to each edge (without photometric correction). Mosaic composed of around 30 WAC orbital image strips [NASA/GSFC/Arizona State University].
What to do?

Easy - simply take 36 nearly complete global mosaics (110,000 WAC images) and determine an equation that describes how changes in Sun angle and view angle result in reflectance changes. Next step, for each pixel in those 110,000 WAC images compute the Solar angle and the viewpoint angle (using the GLD100 to correct for local slopes), and adjust the measured brightness to common angles everywhere on the Moon. For this mosaic the LROC Team used the 643 nm band, a Solar angle 10° from vertical (nearly noon), and a viewing angle straight down. Well, perhaps easy is a bit of an exaggeration!

Imagine the number of pixels to consider! To reduce the computational load we use only a subset of the pixels to fit. The most challenging aspect is determining the best photometric model for this huge dataset. Using existing knowledge of lunar reflectance, many iterations, and a variety of classes of mathematical solutions, we ended up using a combination of output from a least-squares fit on a linear model as starting parameters to a minimum search algorithm on a non-linear model. This technique adds robustness to the non-linear model and enables us to more quickly converge on a solution. Or in other words, there were a lot of calculations over many starts and restarts. So perhaps the process was not that easy in practice, but in the end, it was successful! This type of study is known as photometry, and has a rich history going back to the first half of the 20th century.

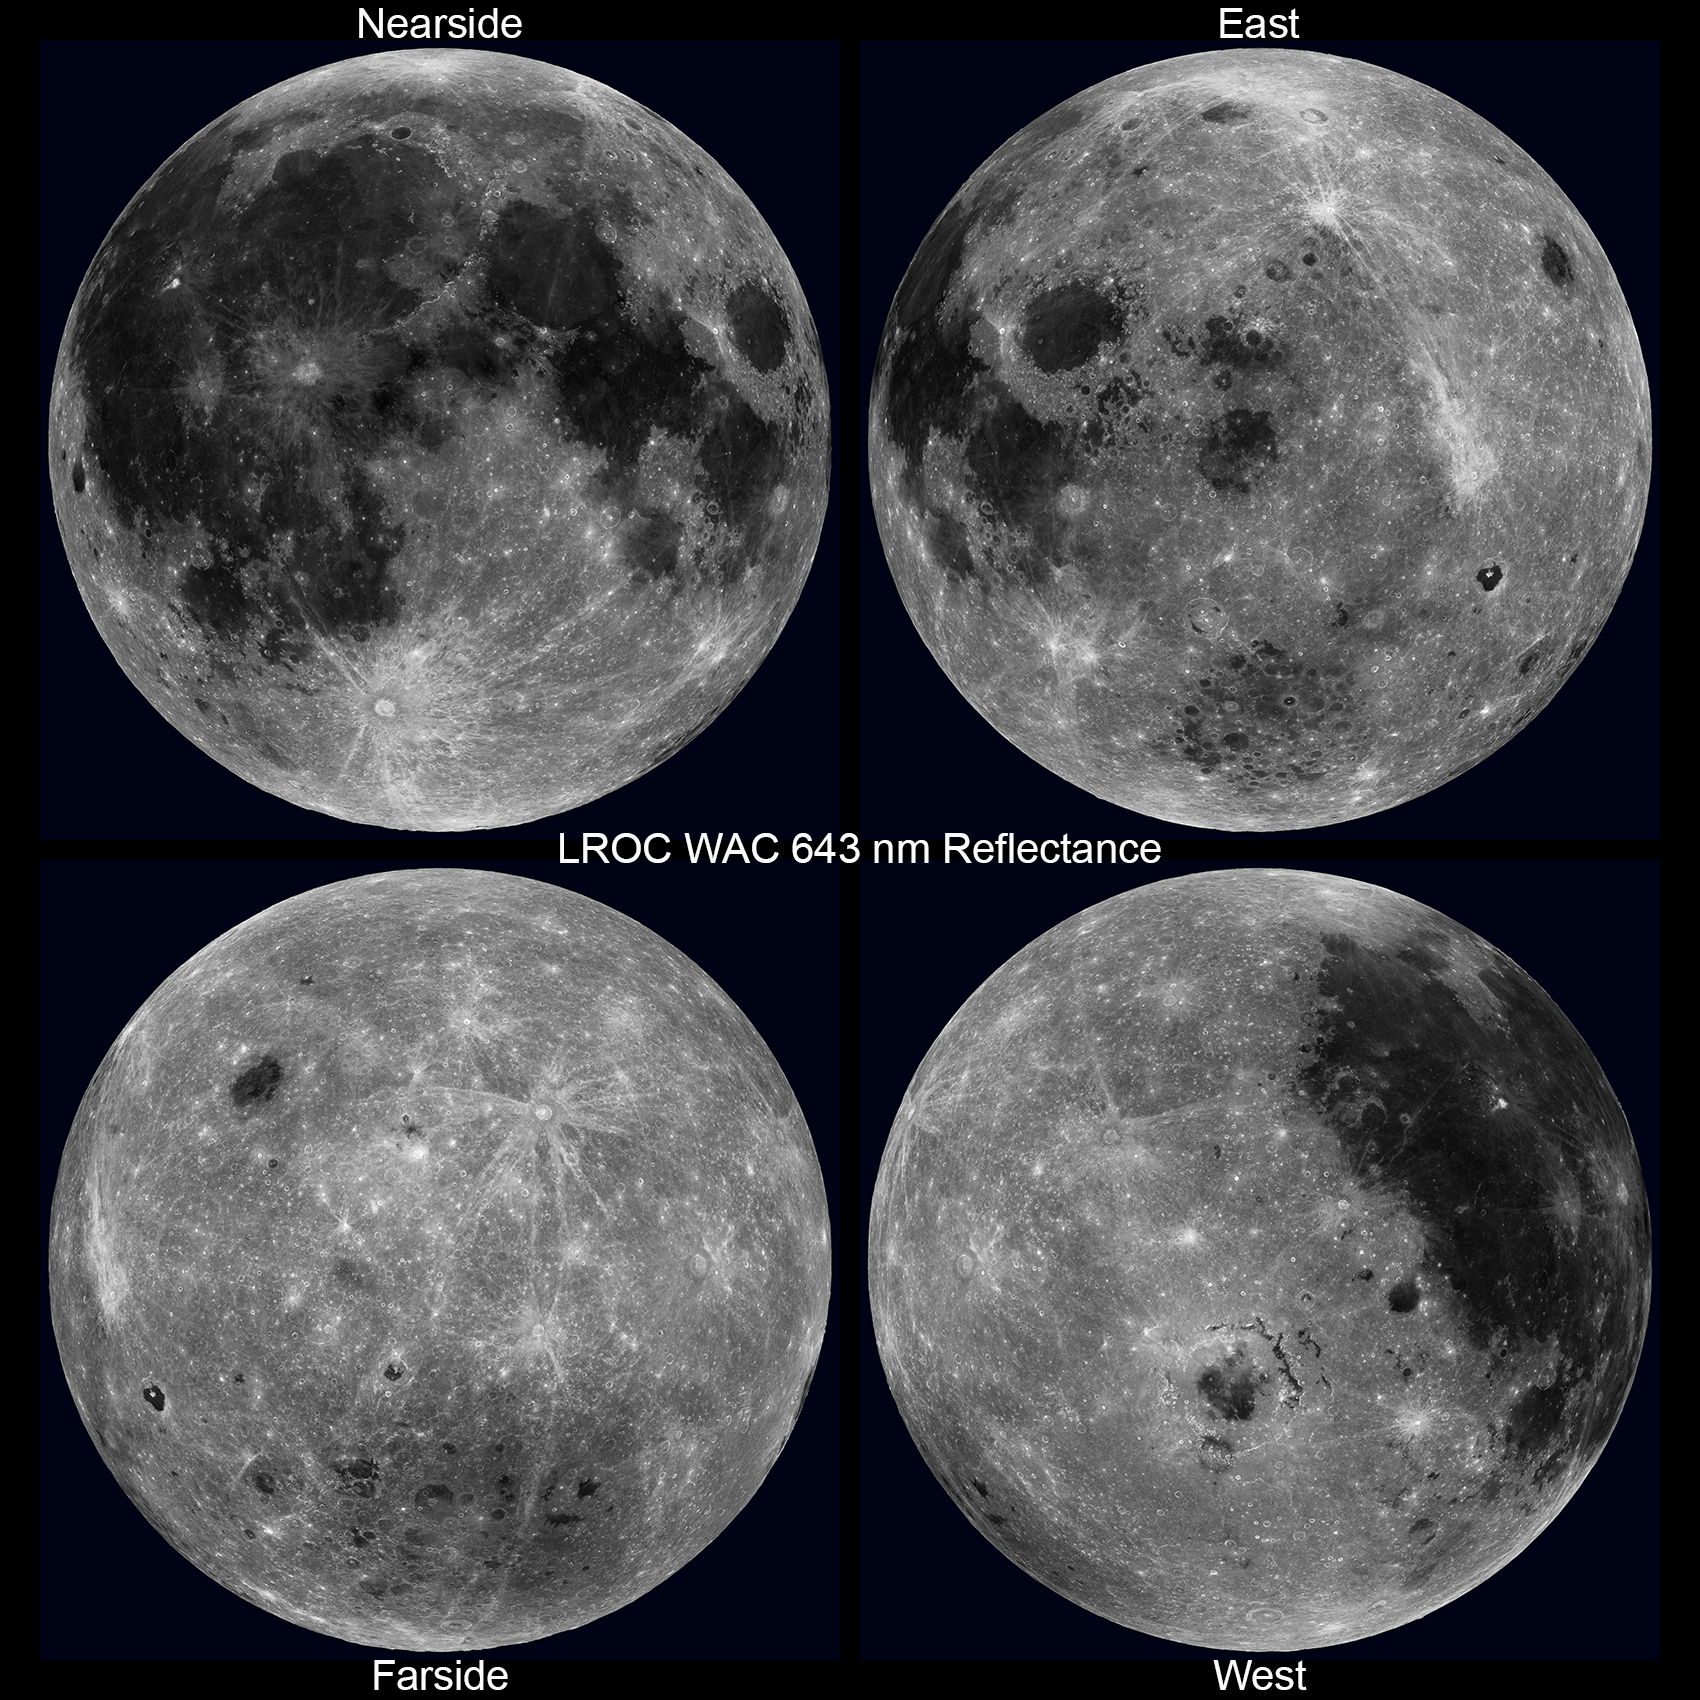
Four Views of the Moon - from the new WAC 643 nm reflectance mosaic. Upper left: nearside (0°N, 0°E); Upper right: eastern hemisphere (0°N, 90°E); Lower left: farside (0°N, 180°E); Lower right: western hemisphere (0°N, 270°E) [NASA/GSFC/Arizona State University].
With the Sun overhead, topography variations are hard to see, but differences in albedo (relative reflectance) are enhanced. Look closely at the reflectance map (above) versus a version of the same map but with natural shading added back (using the WAC topography, below). In the purely reflectance map, mare (low reflectance) and crater rays (high reflectance) really stand out! The mare appear as they do because of their high abundance of iron (iron [Fe2+] in minerals such as pyroxene, and iron metal [Fe0] as a product of space weathering), and in many areas titanium (in the mineral ilmenite). Both elements are strongly absorbing in visible wavelengths. Crater rays are generally composed of the same materials upon which they rest, but they have not undergone as much space weathering, yielding a reflectance contrast. Space weathering lowers the reflectance over time, so just wait around a few hundred million years and watch Tycho's rays disappear!

WAC nearside reflectance shaded - WAC reflectance map with natural shading applied [NASA/GSFC/Arizona State University].
Stay tuned. Late this fall, full seven-color WAC mosaics will be available resulting from this same photometric solution. Read more on the empirical normalization process.

Related:
Large version of the nearside reflectance map, HERE.
Please view the spectacular rotation movie in HD (MOV) format, HERE.

Related Posts:
LROC WAC Global Topography (GLD100)
WAC Global Mosaic

Tuesday, February 7, 2012

LROC: A Recent Journey

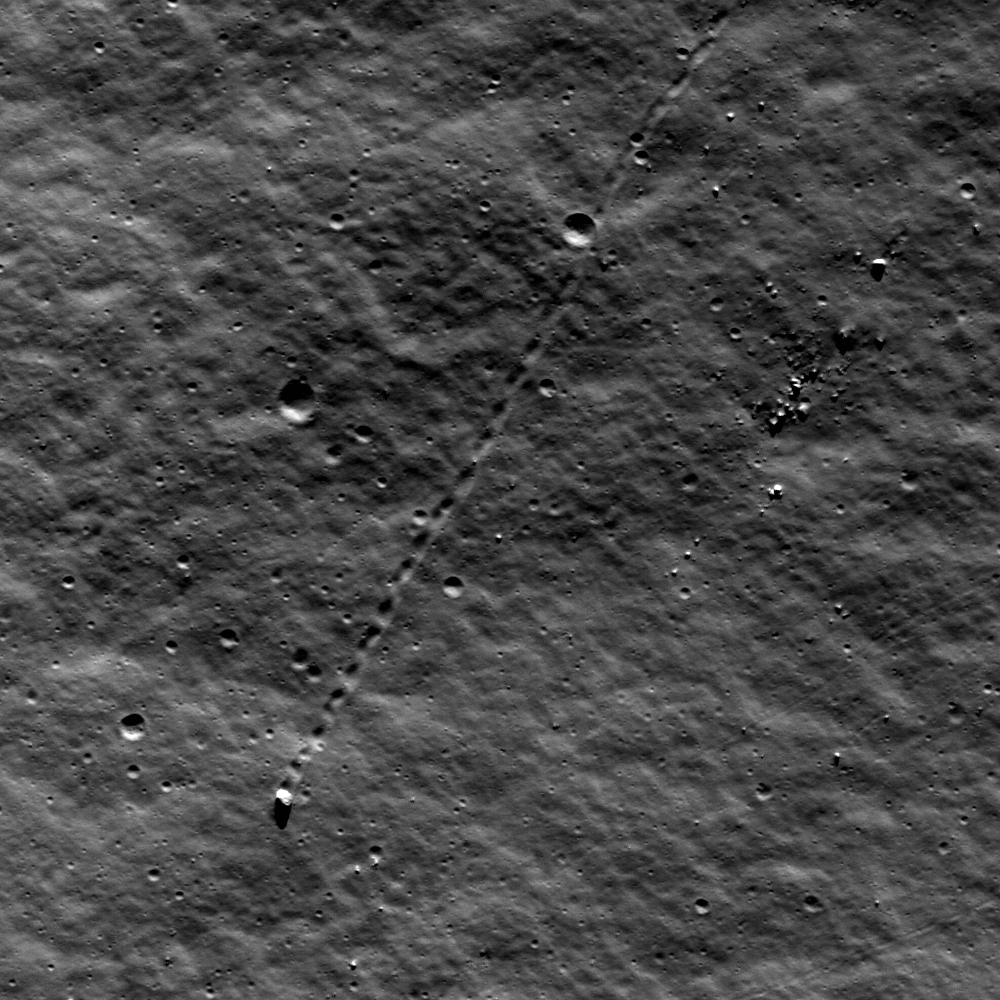
A large boulder stopped on its way down a sloping wall in the central peak complex of Schiller crater (51.8°S, 320.0°E). Illumination from the north, image is ~500 m across, LROC Narrow Angle Camera (NAC) observation M109502471L LRO orbit 1271, October 6, 2009. See the more detailed full size LROC Featured Image HERE  [NASA/GSFC/Arizona State University].
James Ashley
LROC News System

The lonely journey of this large boulder is apparent from its track in a sloping regolith surface. A casual glance might suggest that it happened last week, or even that its rolling might resume at any moment. However, closer inspection will detect a few craters that clearly superpose and therefore post-date the track, showing that this 9-meter diameter boulder stopped rolling some time ago. Impacts are used in this way to provide a relative sense for the timing of events on planetary surfaces across the solar system. The procedure assumes a steady flux of impacting bodies in each size range, with smaller impacts being much more frequent than large impacts.

Though long ago to humans, however, this boulder's journey was made in geologically recent times. Studies suggest that regolith development from micrometeorite impacts will erase tracks like these over time intervals of tens of millions of years. If rate estimates are accurate, this boulder track might not be older than 50-100 million years. Eventually its track will be erased completely. What might have caused the rock to roll so recently? Perhaps this boulder was sent on its way by ground-shaking caused by the violence of a nearby impact. Perhaps a direct hit by a small meteoroid did the job.

Wide Angle Camera (WAC) mosaic image covering a portion of Schiller crater, north is up, image is ~80 km across [NASA/GSFC/Arizona State University].
The LROC WAC Global 100 meter mosaic draped over the laser altimetry (LOLA) digital elevation model as seen from an imaginary point 65 kilometers over the elongated crater's southeast. ILIADS application from NASA Lunar Mapping and Modeling Project (LMMP). South-southeast of center darker surface indicates the location of a localized pyroclastic volcanic dome, with a very low profile. The unusual Schiller crater formation may indicate the formation's progenitor was a highly oblique impact, perhaps along the northern inner rim of an older, much larger impact basin further southwest. Schiller is roughly 108 km wide and 184 km long [NASA/GSFC/Arizona State University].
The WAC-derived GLD100 Digital Elevation Model (DEM) of the area, shown in the inset below, offers a sense for topographic relief unavailable in the WAC mosaic alone. We can see that the location of today's Featured Image is in a zone of relatively gradual slope, just beyond the steeper slopes of the Schiller central peak complex. Thus, it is unlikely that our boulder will continue rolling anytime soon. It's arrived in an area with too gentle a slope.

Color LOLA DEM of Schiller environs, with an inset showing the central peak complex region in three dimensions. The yellow arrow designates the Featured Image location [NASA/GSFC/Arizona State University]

Look for other boulder tracks in the full NAC image.

Additional examples of boulder behavior can be seen in A Gathering in Lacus Mortis, Sampling Schrödinger, and Frozen in Time.