Showing posts with label DLR. Show all posts

Tuesday, August 5, 2014

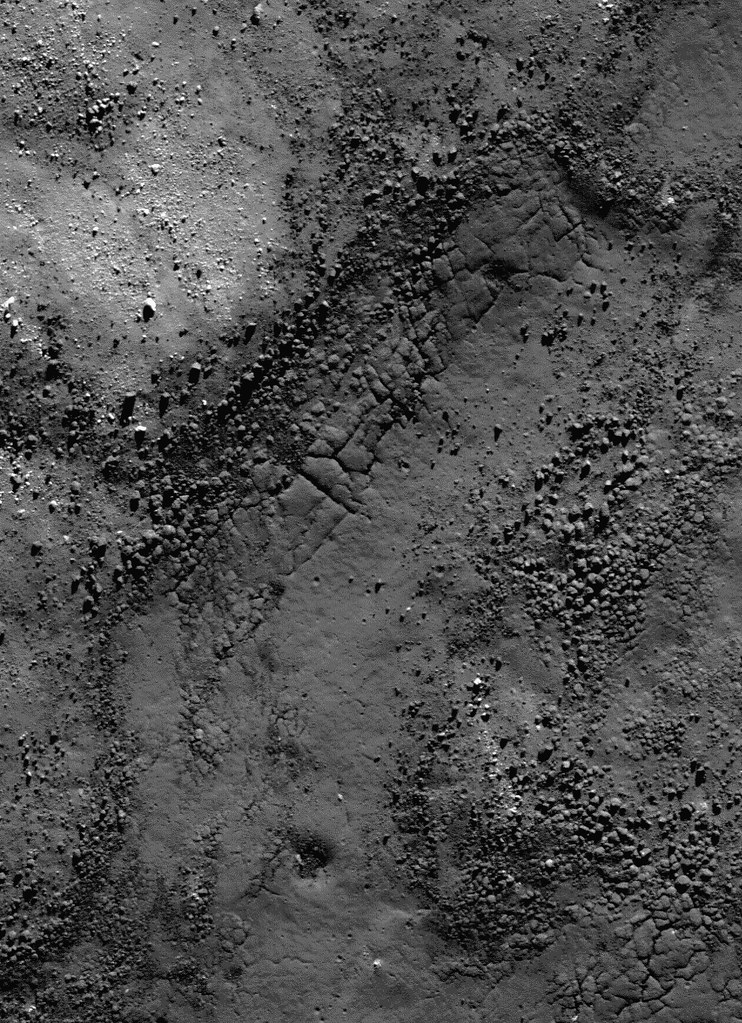
Fractures and boulders on the floor of De Forest

Fractured impact melt left the interior of De Forest crater (56.25 km; 76.94°S, 196.67°E) lined with boulders. 665 meter-wide field of view from LROC NAC observation M125650563L, 665 meter-wide field of view from LRO orbit 3650, April 11, 2010; 78.87° incidence angle, resolution 57 cm from 55.16 km over 77.1°S, 197.94°E [NASA/GSFC/Arizona State University].
Hiroyuki Sato
LROC News System

Today's Featured Image highlights a portion of the interior of De Forest crater (56.25 km; 76.94°S, 196.67°E), which is located inside the South Pole–Aitken basin.

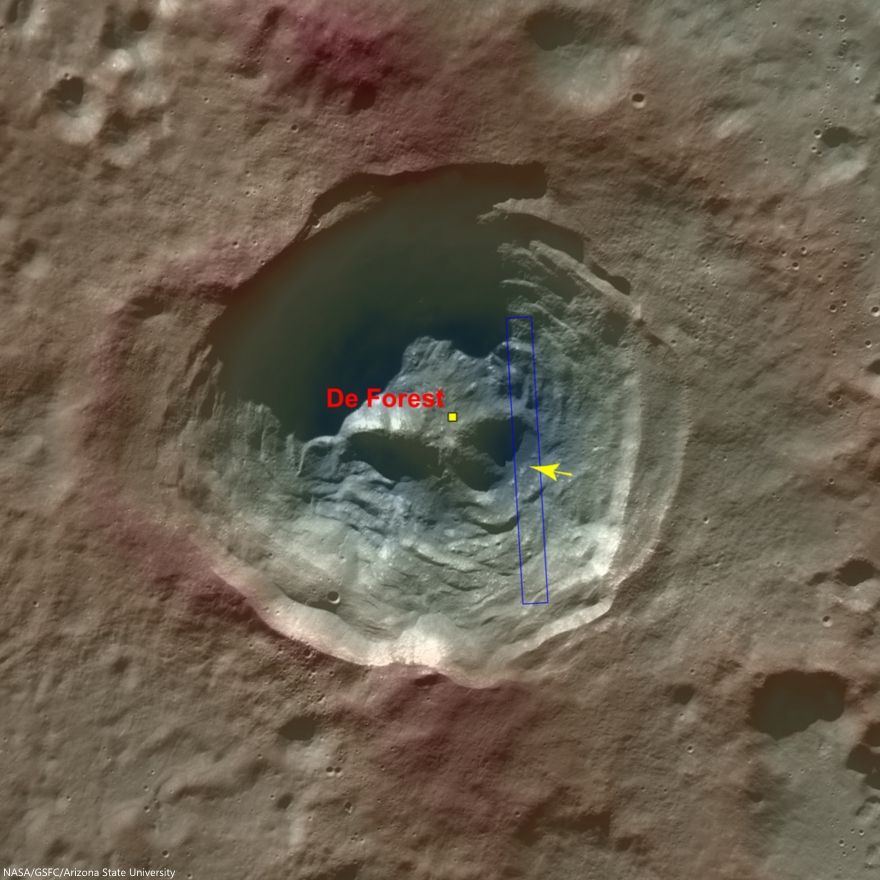
The cavity of De Forest crater exhibits prominent terraces of collapsed materials surrounding the central peak (see context imagery following).

The topographic low, east of the central peak, was largely coated with hot impact melt which formed a hard crust as it cooled; a portion of this melt is seen in the opening image. 

Context view of De Forest crater (56.25 km; 76.94°S, 196.67°E) consisting of LROC WAC monochrome mosaic (100 m/pix) overlain with colorized WAC stereo DTM (GLD100, Scholten et al., 2012). View centered on 76.92°S, 197.51°E. Footprint of LROC NAC observation M125650563L, April 11, 2010, outlined in blue, source of high-resolution view of the area designated with a yellow arrow (LROC Featured Image released August 5, 2014) [NASA/GSFC/Arizona State University]. 
Much of the area of the opening image is covered by numerous boulders, some of which are up to approximately 15 meters across.

The smooth surface extending in lower-left to upper-right is impact melt that cooled to form solid rock, and is now fractured in regular patterns along the edge. Impact melt that was splashed on the crater's walls and its central peak formed a coating that quickly cooled to solid rock.

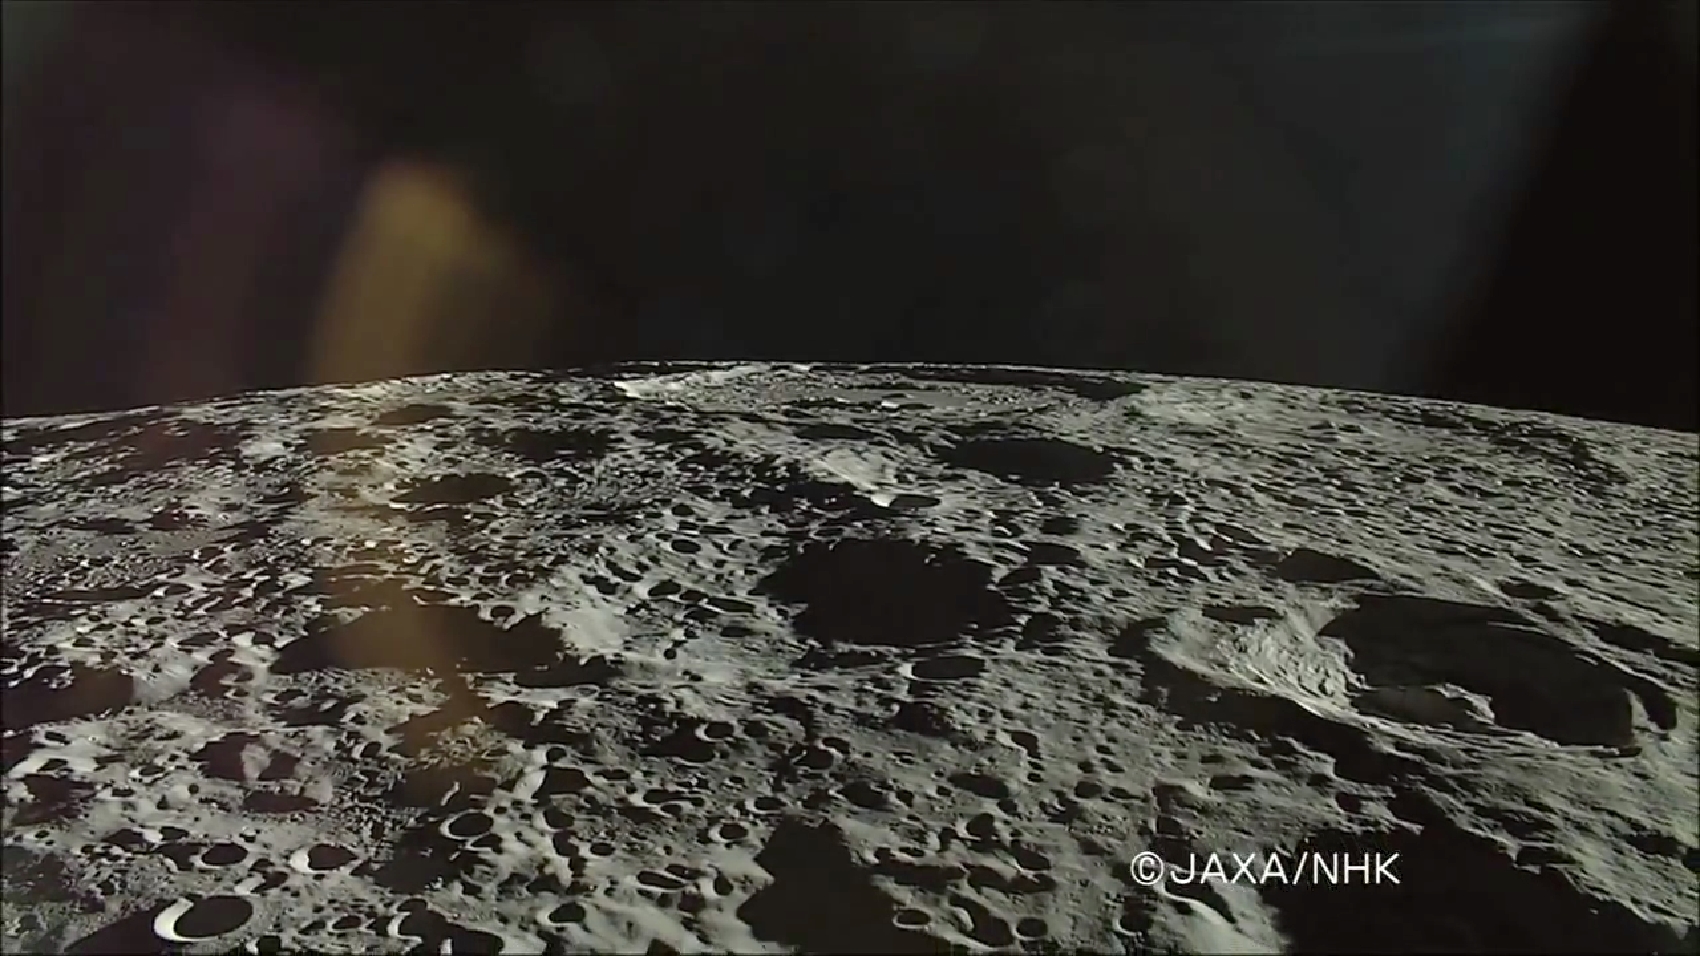
On the true "backside" of the Moon, De Forest (right) is situated well inside South Pole-Aitken impact basin, between Antoniadi (upper left, near horizon), host of the Moon's lowest elevation (-9094 meters) and Shackleton (not pictured), host of the Moon's south pole. HDTV still from Japan's lunar orbiter Kaguya (SELENE-1) in 2008 [JAXA/NHK/SELENE].
Later, it is likely that nearby moonquakes caused these brittle rock coatings to fracture, providing the source of boulders we now see on the lower reaches of the crater floor.

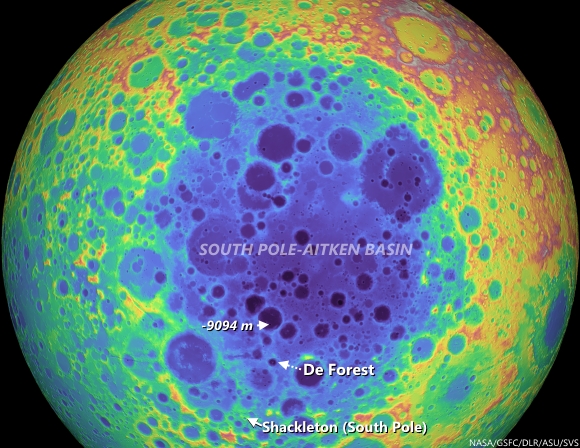
De Forest's position in the far south Farside is an area hosting Permanently Shadowed Regions (PSR's). The neutron detection experiment on-board LRO (LEND) has built up signatures consistent with cold-trapped volatiles, like water ice, in the vicinity. Image from Science Visualization Studio tour of SPA, larger image HERE [NASA/GSFC/Arizona State University/DLR/SVS]. 
As you can see in the following full NAC frame, an enormous number of similar boulders are found along the smooth melt deposits on the floor of De Forest crater. 

Explore this boulder-rich crater in the full NAC frame, HERE.

Related Posts:

Thursday, June 12, 2014

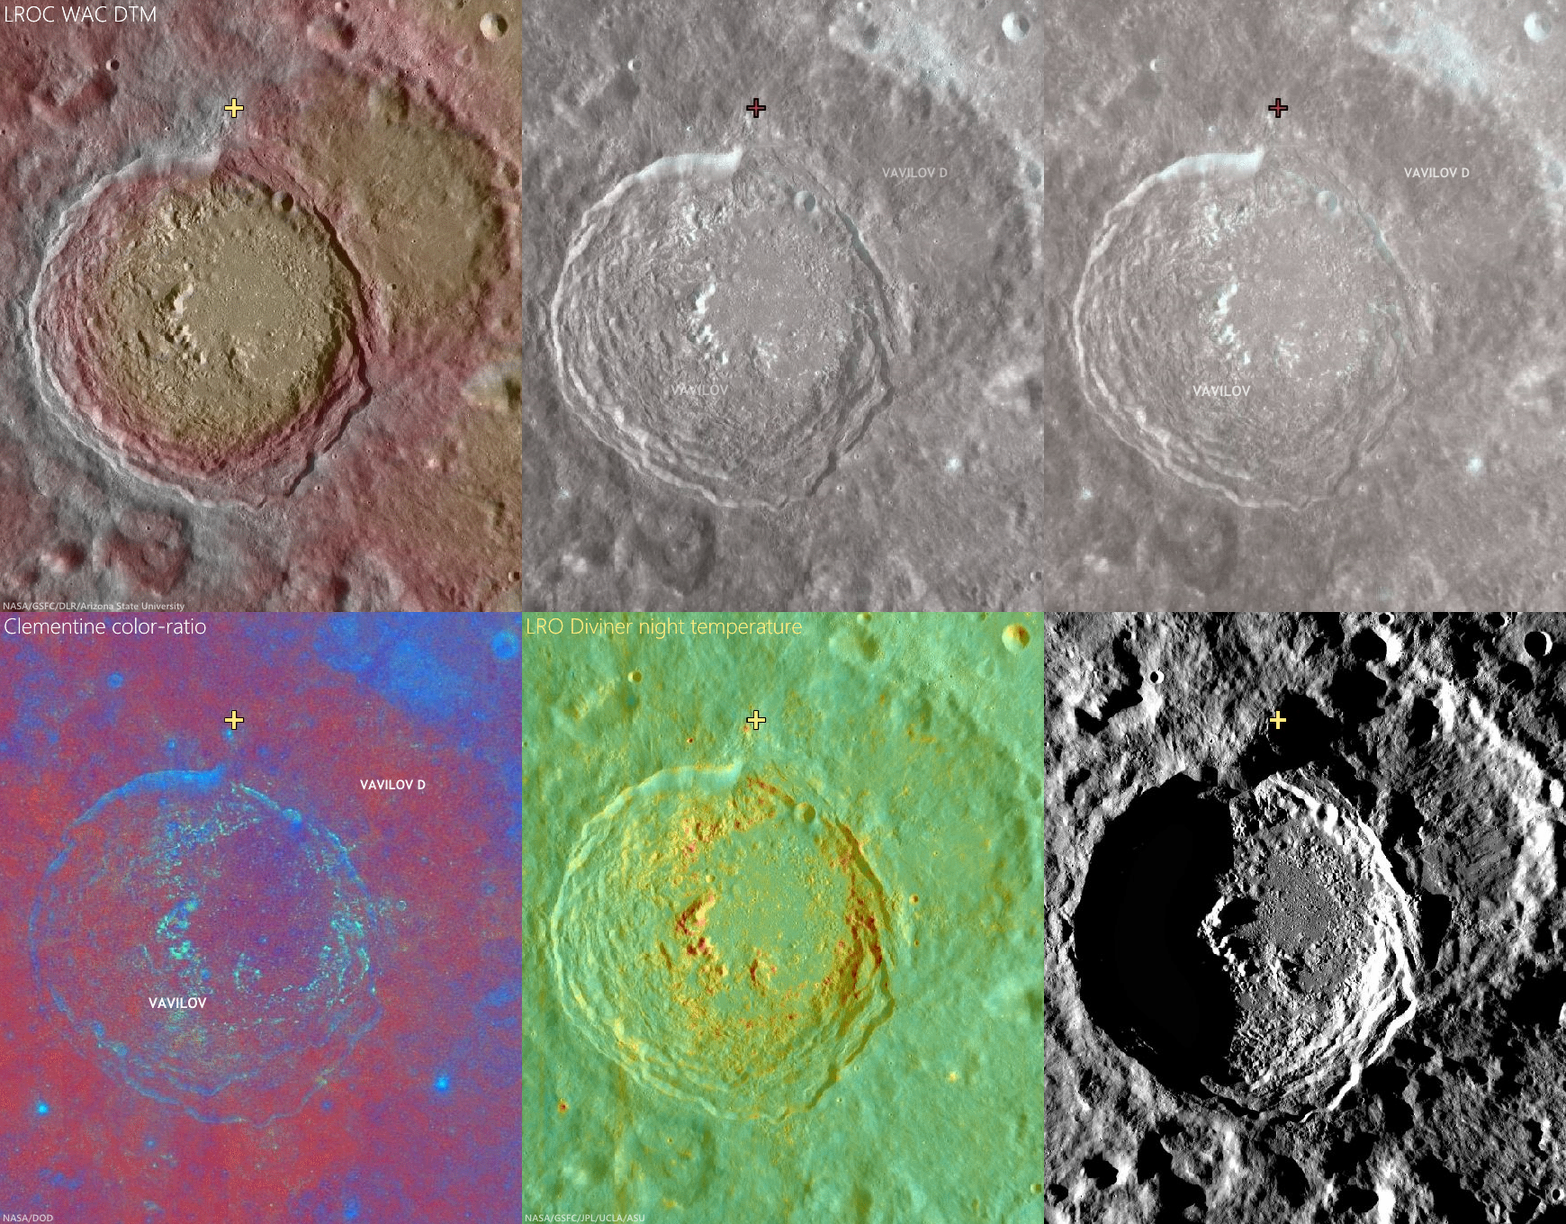
Study in superpositioning at Vavilov D

Sunrise, sunset. LROC NAC observations 10 months apart, one at local sunset and the other after local sunrise, both from nearly identical altitudes and resolutions, capture these views of double "dingleberries," drops of hot melt, very likely from the impact that created Vavilov crater, sit where they quickly flattened and cooled, just inside the steep slope of ancient Vavilov D. The Vavilov craters are a study in stratigraphy and superposition [NASA/GSFC/Arizona State University].
Immediately inside the northwest rim of highly degraded Vavilov D, twin disks of impact melt, likely from the formation of Vavilov, came to a standstill at the upper end of a contiguous slope of 5000 meters elevation, over about 40 km, into the complex floor of the latter Eratosthenian crater. This 1400 meter field of view (down slope is to the lower right, centered on 1.14°N, 221.536°E) from LROC NAC observation M1128031686L, LRO orbit 18385, July 9, 2013; 61° incidence angle, resolution 1.17 meters from 114.6 km [NASA/GSFC/Arizona State University]. 
Hiroyuki Sato
LROC News System

Vavilov D is an heavily degraded crater (96.1 km; 0.026°N, 220.93°E) sits between the Orientale basin and Jackson crater, both of which it may pre-date.

The later formation of the nearly identical, over-lapping Vavilov crater (98.2 km; 0.87°S, 221.23°E) eradicated the entire southwestern half of Vavilov D.

The second image above spotlights a spot on the northwestern curve of the wall of Vavilov D near where the Eratosthenian Vavilov erased the older crater's anatomy. The relatively smooth textured area in the upper left corresponds to the outside of Vavilov D, and the rest of rough/craggy surface is the interior crater wall's steep slope. 

The two degraded craters (~280 m in diameter) near the middle of the opening image exhibit fascinating overlying smooth features that may have formed as material flowed downslope (arrows).

View the full-resolution original HERE. The twin melt disks are located where the rim of Vavilov superseded that of Vavilov D, in the farside equatorial highlands,  where Vavilov is etched into terrain 8000 meters above the global mean elevation. It's possible an astronaut could walk from this location south into the interior of Vavilov. 5.6 km-wide field of view from LROC NAC observation M1128031686L [NASA/GSFC/Arizona State University].
Other morphologic pits/dents on this slope also have similar textures. What we are seeing here are most likely remnant impact melt that was thrown out of the Vavilov crater. Craggy sloped surfaces with patches of smooth material are often found associated with young impact craters -- formed as impact melt flowed over and around the newly formed crater.

The deepest material brought to the surface by impacts on the Moon is found on the resulting crater's rim. A fresh crater near our area of interest, on the rim of Vavilov D (cross), exposes material excavated by that ancient impact, and Vavilov D, in turn, is nested on the Hertzsprung basin. The larger region is also at the outside range of the majority of secondary craters from the Orientale basin-forming impact. LROC Quickmap mosaic [NASA/GSFC/Arizona State University].
Depth of field in lunar photography is a fleeting quality. With the LROC WAC-derived elevation model (GLD100), however, the super-positioning of Vavilov D (and an aeon or two later, Vavilov) on Hertzsprung is much easier to detect, along with some of the most extreme elevation ranges, some 9 km above the global mean [NASA/GSFC/DLR/Arizona State University].
Related Posts:

Wednesday, July 31, 2013

ESA prepares for LADEE

LADEE approaches lunar orbit
Artist's view of NASA's Lunar Atmosphere and Dust Environment Explorer (LADEE) observatory as it approaches lunar orbit [NASA].
An advanced laser system offering vastly faster data speeds is now ready for linking with spacecraft beyond our planet following a series of crucial ground tests. Later this year, ESA’s observatory in Spain will use the laser to communicate with a NASA Moon orbiter.

The laboratory testing paves the way for a live space demonstration in October, once NASA’s Lunar Atmosphere and Dust Environment Explorer – LADEE – begins orbiting the Moon.

LADEE carries a terminal that can transmit and receive pulses of laser light. ESA’s Optical Ground Station on Tenerife will be upgraded with a complementary unit and, together with two US ground terminals, will relay data at unprecedented rates using infrared light beams at a wavelength similar to that used in fiber-optic cables on Earth.

“The testing went as planned, and while we identified a number of issues, we’ll be ready for LADEE’s mid-September launch,” says Zoran Sodnik, manager for ESA’s Lunar Optical Communication Link project.

“Our ground station will join two NASA stations communicating with the LADEE Moon mission, and we aim to demonstrate the readiness of optical communication for future missions to Mars or anywhere else in the Solar System.”

Read the illustrated ESA article, HERE.

Laser from Optical Ground Station on Tenerife
ESA's Optical Ground Station (OGS) is 2400 meter above sea level on the volcanic island of Tenerife, in the Canary Islands. Visible green laser beams are used for stabilizing the sending and receiving telescopes on Tenerife and neighboring La Palma. The OGS facility is utilized for extensive experiments with entangled photons, quantum communication and teleportation. OGS is also used for standard laser communication with satellites, tracking space debris and finding new asteroids. The image above includes Tenerife's Teide volcano with the Milky Way in the background [ESA/IQOQI Vienna, Austrian Academy of Sciences].

Wednesday, July 17, 2013

A Unique View of the Moon

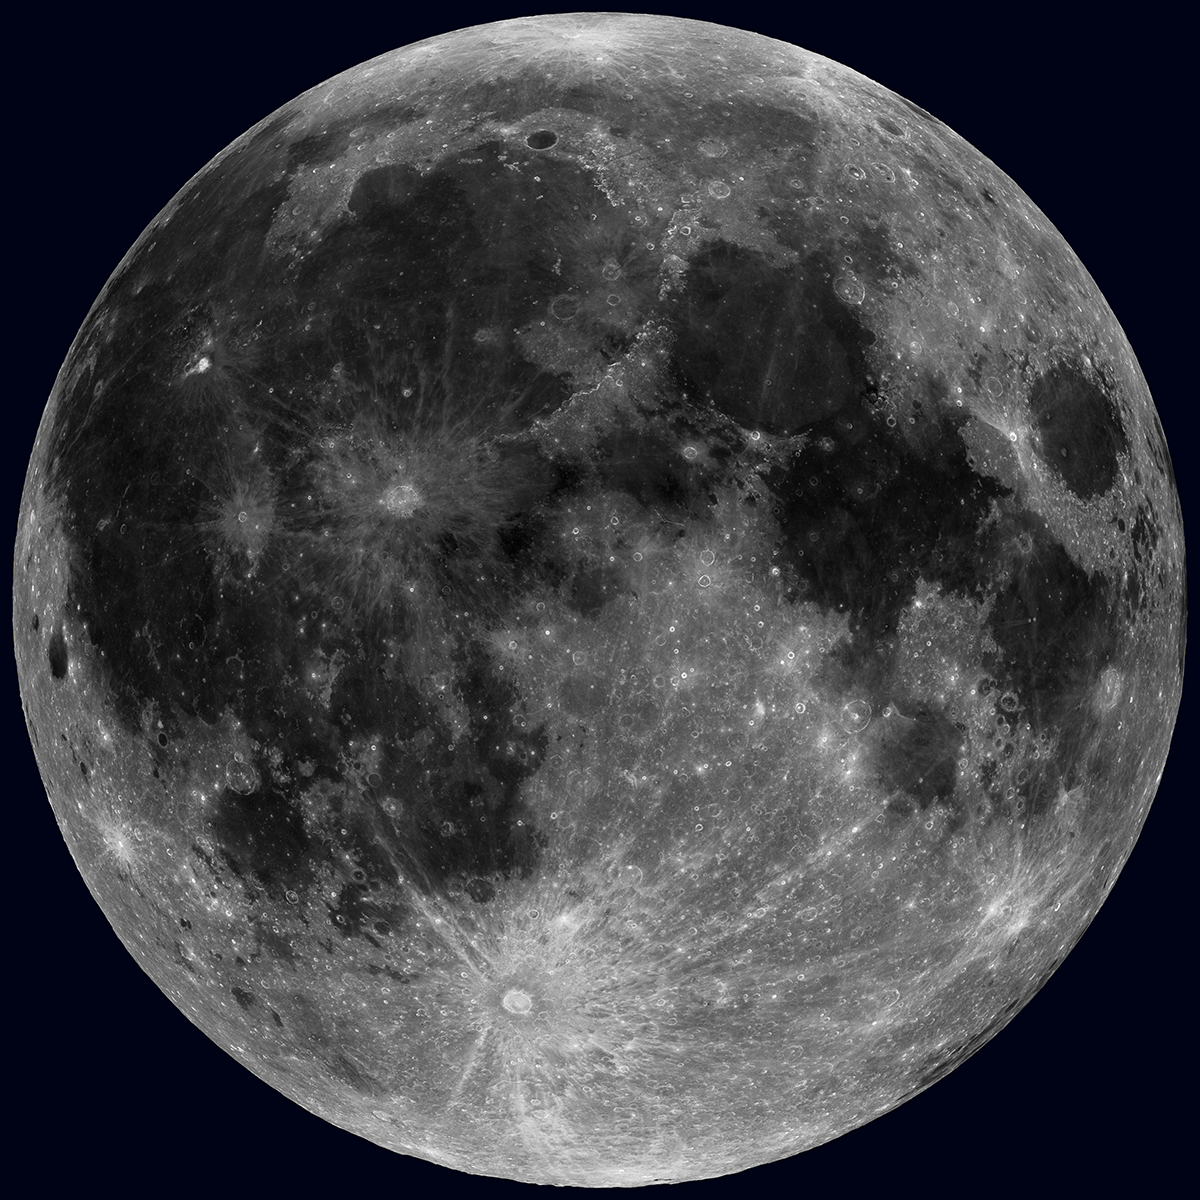
Nearside LROC WAC Reflectance - The Sun overhead, across the whole Moon! Of course this is not possible in real life, but 36 nearly complete WAC mosaics make this view possible [NASA/GSFC/Arizona State University].
Mark Robinson
Principal Investigator
Lunar Reconnaissance Orbiter Camera
Arizona State University

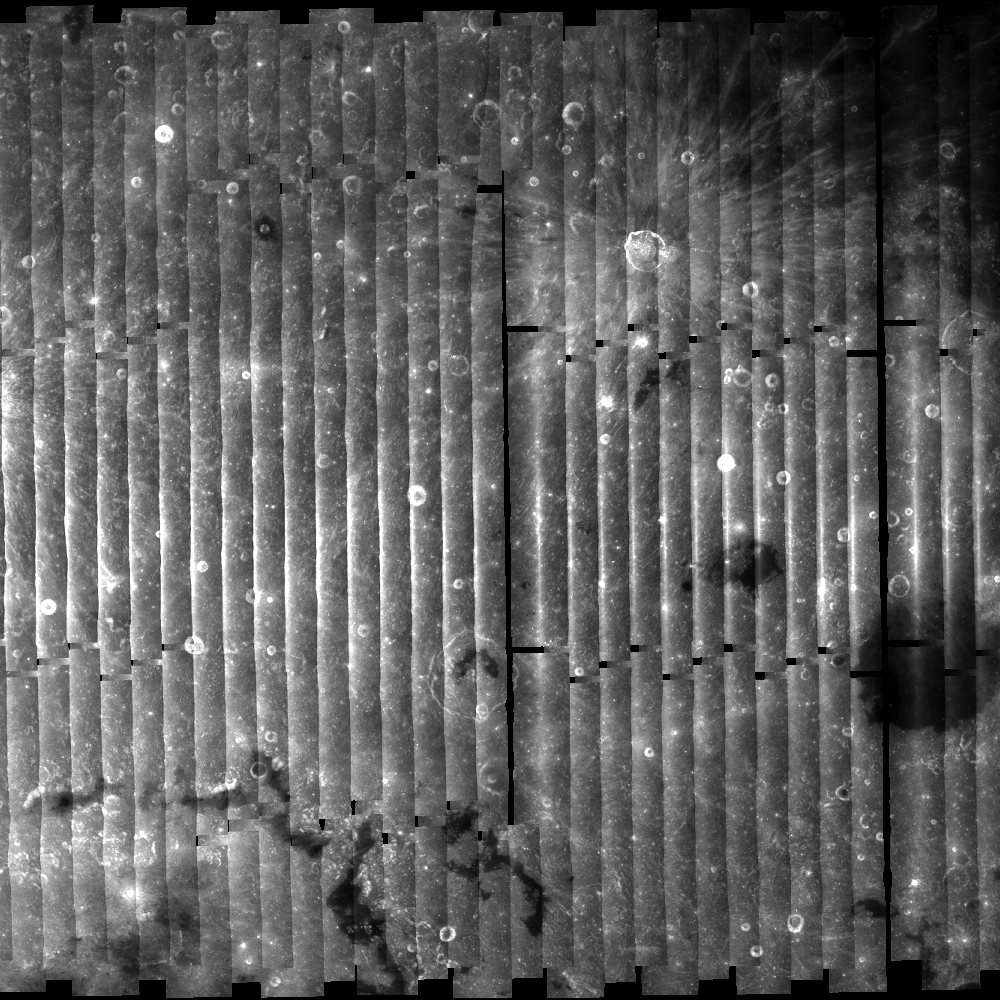
A huge payoff from the longevity of the LRO mission is the repeat coverage obtained by the LROC Wide Angle Camera (WAC). The WAC has a very wide field-of-view (FOV), 90° in monochrome mode and 60° in multispectral mode, hence its name. On the one hand, the wide FOV enables orbit-to-orbit stereo, which allowed LROC team members at the DLR to create the unprecedented 100 meter scale near-global (0° to 360° longitude and 80°S to 80°N latitude) topographic map of the Moon (the GLD100)! However, the wide FOV also poses challenges for mosaicking and reconstructing lunar colors because the perspective changes plus- and minus-30° from the center to the edges of each frame. The problem lies in the fact that the perceived reflectance of the Moon changes as the view angle changes. So for the WAC, the surface appears to be most reflective in the center of the image and less so at the edges, which is quite distracting! This effect results in a pole-to-pole striped image when making a "not-corrected" mosaic.

No photometry WAC mosaic  - Large area WAC mosaic illustrating reflectance differences due to 30° change in view angle from the center of a WAC frame to each edge (without photometric correction). Mosaic composed of around 30 WAC orbital image strips [NASA/GSFC/Arizona State University].
What to do?

Easy - simply take 36 nearly complete global mosaics (110,000 WAC images) and determine an equation that describes how changes in Sun angle and view angle result in reflectance changes. Next step, for each pixel in those 110,000 WAC images compute the Solar angle and the viewpoint angle (using the GLD100 to correct for local slopes), and adjust the measured brightness to common angles everywhere on the Moon. For this mosaic the LROC Team used the 643 nm band, a Solar angle 10° from vertical (nearly noon), and a viewing angle straight down. Well, perhaps easy is a bit of an exaggeration!

Imagine the number of pixels to consider! To reduce the computational load we use only a subset of the pixels to fit. The most challenging aspect is determining the best photometric model for this huge dataset. Using existing knowledge of lunar reflectance, many iterations, and a variety of classes of mathematical solutions, we ended up using a combination of output from a least-squares fit on a linear model as starting parameters to a minimum search algorithm on a non-linear model. This technique adds robustness to the non-linear model and enables us to more quickly converge on a solution. Or in other words, there were a lot of calculations over many starts and restarts. So perhaps the process was not that easy in practice, but in the end, it was successful! This type of study is known as photometry, and has a rich history going back to the first half of the 20th century.

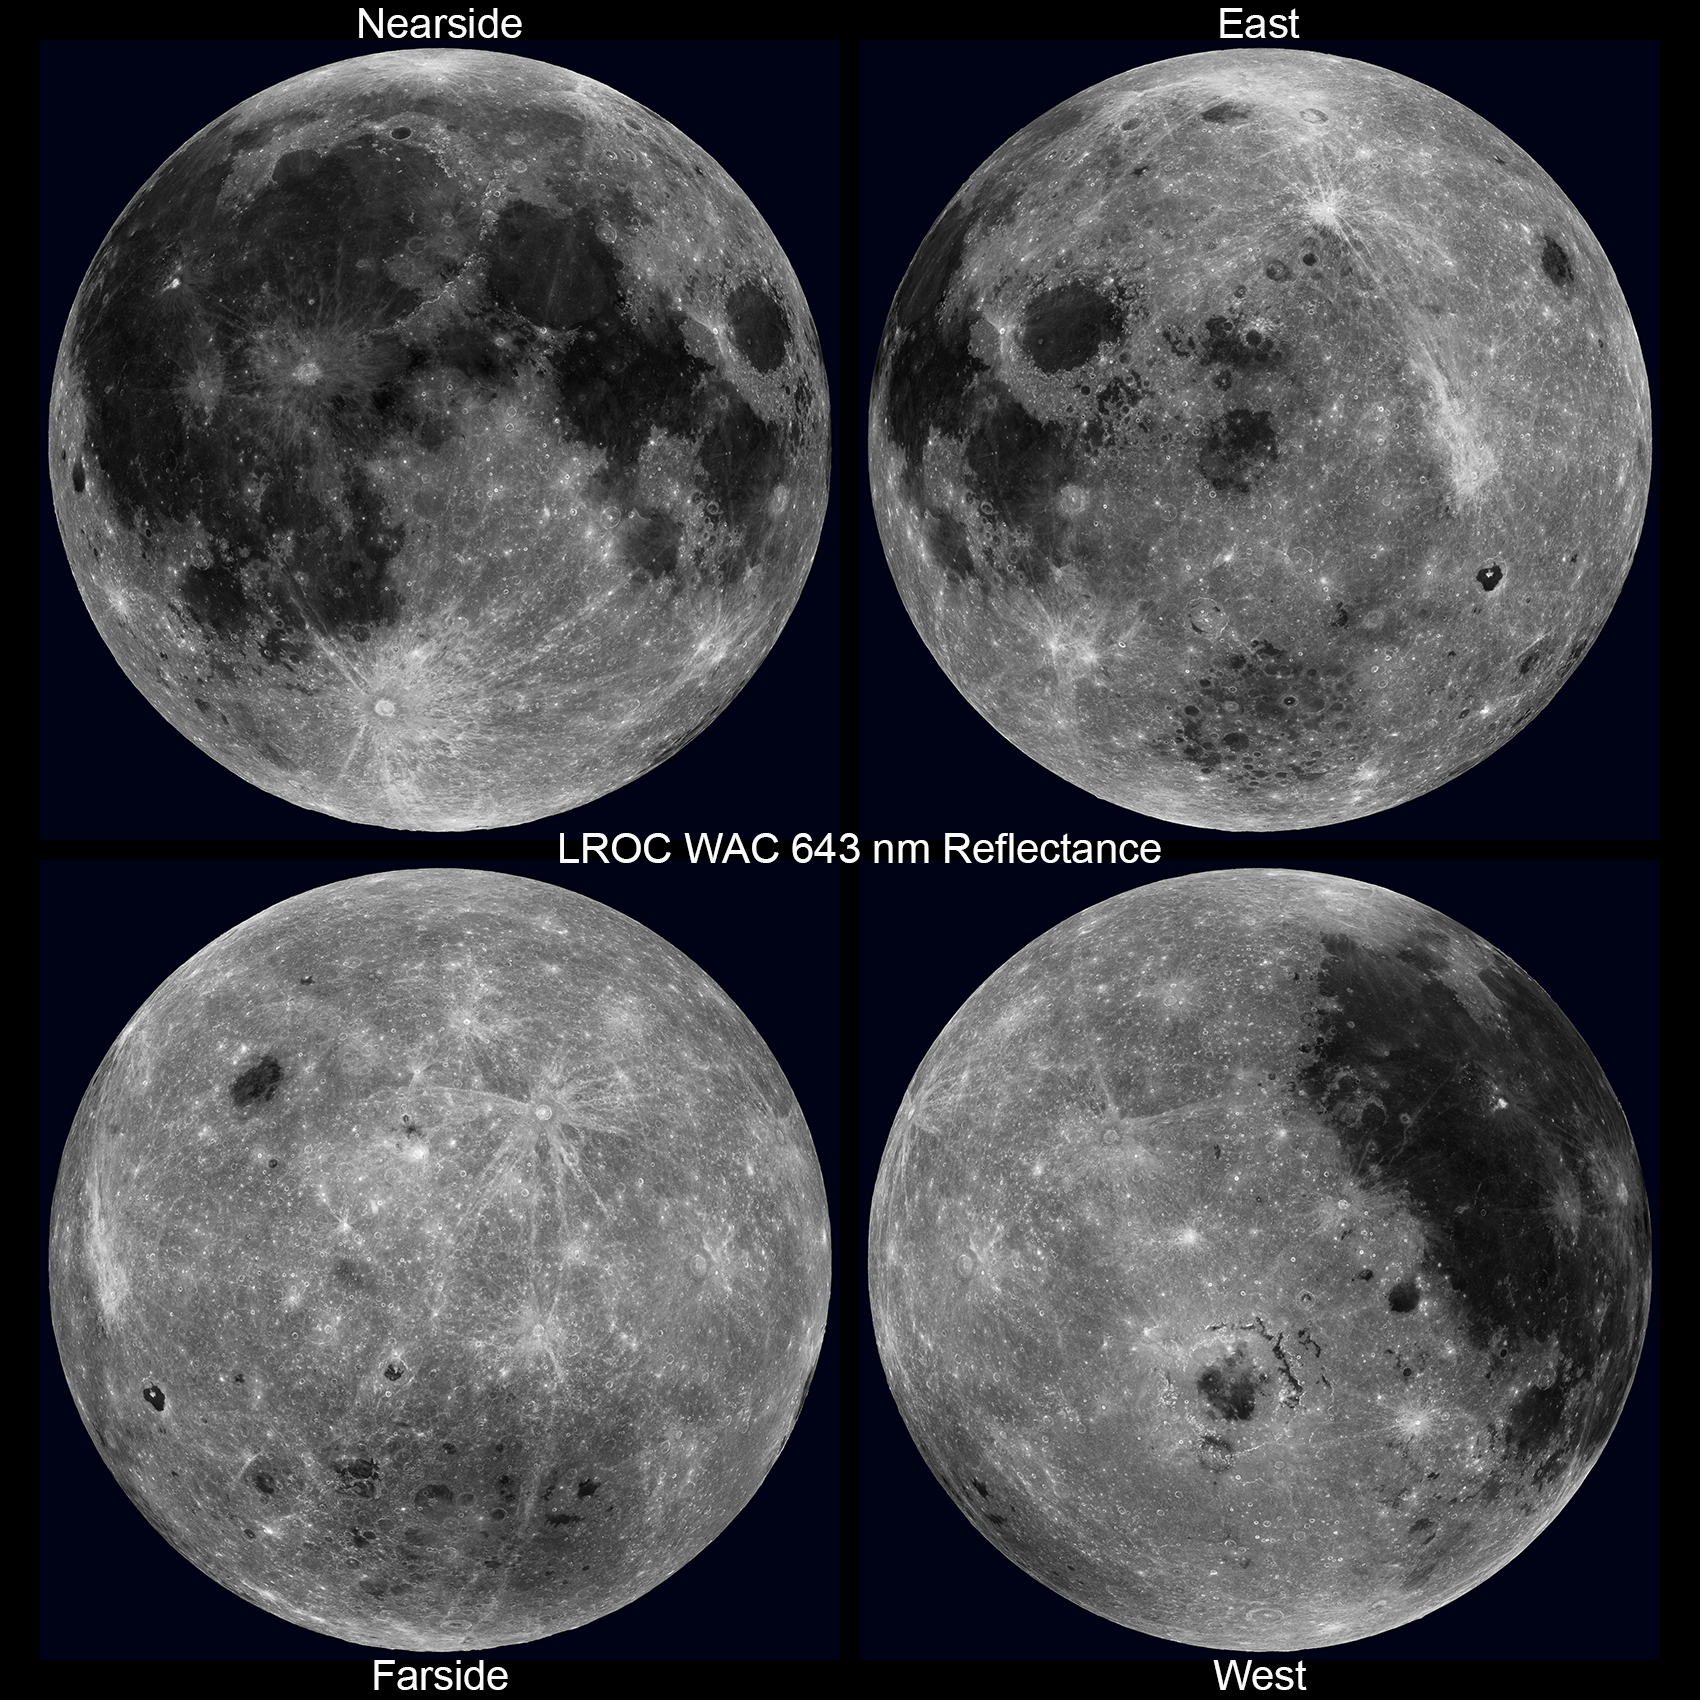
Four Views of the Moon - from the new WAC 643 nm reflectance mosaic. Upper left: nearside (0°N, 0°E); Upper right: eastern hemisphere (0°N, 90°E); Lower left: farside (0°N, 180°E); Lower right: western hemisphere (0°N, 270°E) [NASA/GSFC/Arizona State University].
With the Sun overhead, topography variations are hard to see, but differences in albedo (relative reflectance) are enhanced. Look closely at the reflectance map (above) versus a version of the same map but with natural shading added back (using the WAC topography, below). In the purely reflectance map, mare (low reflectance) and crater rays (high reflectance) really stand out! The mare appear as they do because of their high abundance of iron (iron [Fe2+] in minerals such as pyroxene, and iron metal [Fe0] as a product of space weathering), and in many areas titanium (in the mineral ilmenite). Both elements are strongly absorbing in visible wavelengths. Crater rays are generally composed of the same materials upon which they rest, but they have not undergone as much space weathering, yielding a reflectance contrast. Space weathering lowers the reflectance over time, so just wait around a few hundred million years and watch Tycho's rays disappear!

WAC nearside reflectance shaded - WAC reflectance map with natural shading applied [NASA/GSFC/Arizona State University].
Stay tuned. Late this fall, full seven-color WAC mosaics will be available resulting from this same photometric solution. Read more on the empirical normalization process.

Related:
Large version of the nearside reflectance map, HERE.
Please view the spectacular rotation movie in HD (MOV) format, HERE.

Related Posts:
LROC WAC Global Topography (GLD100)
WAC Global Mosaic

Friday, May 31, 2013

Cosmic ray threat to manned spaceflight tested on MSL

The MSL cruise phase as unmanned proxy for Orion, testing the deep space radiation environment [NASA].
Employing present, proven technology manned space travel to Mars exceeds NASA’s own limits on astronaut radiation exposure. That limit is calculated in terms of risk of “Radiation Exposure Induced Death,” or “REID,” over an individual astronaut’s life expectancy.

Ironically, as astronauts age their risk of eventually dying from causes unrelated to radiation exposure steadily increase. It’s the kind of risk coldly calculated by insurance providers. Though dying of undiagnosed heart disease is fed into the calculus, such other threats to the older astronaut's long-term survival overshadow their cumulative risk of REID.

None of this is news. This fly in the ointment in need of being overcome before humans can safely experience long-duration spaceflight beyond Earth’s magnetic field was starkly spelled out in the influential “ (2007),” a report put together by the National Academy of Science before the Constellation program was cancelled. The hard numbers have been gathered from the opening of the Space Age, from Explorer 1 through Apollo, from the Voyagers through the International Space Station.

Now these projections have been verified again by an instrument that traveled to Mars with Curiosity.

The lead investigators for these sensors announced their results during a NASA audio press conference Thursday. Dr. Cary Zeitlin, a principal scientist in the Southwest Research Institute’s (SwRI) Space Science and Engineering Division discussed detailed measurements of energetic and highly-ionizing particle radiation gathered during the 253 day, 560 million km journey to deliver the Mars Science Laboratory (MSL) “Curiosity” rover to the floor of Gail crater on Mars.

The Radiation Assessment Detector (RAD) made detailed measurements of the energetic particle radiation environment inside the spacecraft, providing important insights for future human missions to Mars.

NASA/JPL/SwRI
"In terms of accumulated dose, it's like getting a whole-body CT scan once every five or six days," said Dr. Cary Zeitlin, a principal scientist in SwRI's Space Science and Engineering Division and lead author of Measurements of Energetic Particle Radiation in Transit to Mars on the Mars Science Laboratory, scheduled for publication in the journal Science on May 31.

"Understanding the radiation environment inside a spacecraft carrying humans to Mars or other deep space destinations is critical for planning future crewed missions," Zeitlin said. "Based on RAD measurements, unless propulsion systems advance rapidly, a large share of mission radiation exposure will be during outbound and return travel, when the spacecraft and its inhabitants will be exposed to the radiation environment in interplanetary space, shielded only by the spacecraft itself."

Titanium alloy in the hull of a manned spacecraft is a good shield
against most solar particle events, but counter-productive against
the heaviest cosmic rays. These heavy nucleons split and shower
damage into human tissue.
Two forms of radiation pose potential health risks to astronauts in deep space: a chronic low dose of galactic cosmic rays (GCRs) and the possibility of short-term exposures to the solar energetic particles (SEPs) associated with solar flares and coronal mass ejections. Radiation dose is measured in units of Sievert (Sv) or milliSievert (1/1000 Sv). Long-term population studies have shown that exposure to radiation increases a person's lifetime cancer risk; exposure to a dose of 1 Sv is associated with a 5 percent increase in fatal cancer risk.

GCRs tend to be highly energetic, highly penetrating particles that are not stopped by the modest shielding provided by a typical spacecraft. These high-energy particles include a small percentage of so-called heavy ions, which are atomic nuclei without their usual complement of electrons. Heavy ions are known to cause more biological damage than other types of particles.

The solar particles of concern for astronaut safety are typically protons with kinetic energies up to a few hundred MeV (one MeV is a million electron volts). Solar events typically produce very large fluxes of these particles, as well as helium and heavier ions, but rarely produce higher-energy fluxes similar to GCRs. The comparatively low energy of typical SEPs means that spacecraft shielding is much more effective against SEPs than GCRs.

"A vehicle carrying humans into deep space would likely have a 'storm shelter' to protect against solar particles. But the GCRs are harder to stop and, even an aluminum hull a foot thick wouldn't change the dose very much," said Zeitlin.

"The RAD data show an average GCR dose equivalent rate of 1.8 milliSieverts per day in cruise. The total during just the transit phases of a Mars mission would be approximately .66 Sv for a round trip with current propulsion systems," said Zeitlin. Time spent on the surface of Mars might add considerably to the total dose equivalent, depending on shielding conditions and the duration of the stay. Exposure values that ensure crews will not exceed the various space agencies standards are less than 1 Sv.

"Scientists need to validate theories and models with actual measurements, which RAD is now providing. These measurements will be used to better understand how radiation travels through deep space and how it is affected and changed by the spacecraft structure itself," says Donald M. Hassler, a program director at Southwest Research Institute and principal investigator of the RAD investigation. "The spacecraft protects somewhat against lower energy particles, but others can propagate through the structure unchanged or break down into secondary particles."

Only about 5 percent of the radiation dose was associated with solar particles, both because it was a relatively quiet period in the solar cycle and due to shielding provided by the spacecraft. Crew exposures during a human mission back and forth to Mars would depend on the habitat shielding and the unpredictable nature of large SEP events. Even so, the results are representative of a trip to Mars under conditions of low to moderate solar activity.

"This issue will have to be addressed, one way or another, before humans can go into deep space for months or years at a time," said Zeitlin.

SwRI, together with Christian Albrechts University in Kiel, Germany, built RAD with funding from the NASA Human Exploration and Operations Mission Directorate and Germany's national aerospace research center, DLR.


Scientific Context for the Exploration of the Moon (2007)
Space Studies Board
National Research Council

Wednesday, December 5, 2012

A Tiny, Glancing Blow

An oblique impact created a beautiful asymmetrical ejecta pattern on the farside highlands, photographed from LRO October 10. LROC Narrow Angle Camera (NAC) observation M1104509842L, spacecraft orbit 15079, resolution 1.2 meters per pixel over a field of view 696 meters wide. With the Sun high, sheer reflectance, hinting at rough and fresh terrain, is emphasized. In an earlier, closer observation below reflectance gives way to topography under a high angle of incidence [NASA/GSFC/Arizona State University].
Sarah Braden
LROC News System

The ~220 meter diameter impact crater, located at 6.258°N, 215.101°E , just east of the unnamed crater highlighted in yesterday's Featured Image, was caused by an obliquely impacting asteroid or comet.

What is an oblique impact, and how do we know that this crater was formed by an oblique strike? 

The term oblique impact implies an impact angle of 15 degrees or less. The impact angle is the angle between the surface and the vector that represents the direction of travel of the impactor. 

A slightly closer look, under a greater angle of incidence (71.25°), at the rough ejecta and pressure wave pattern immediately beyond the north rim of the small glancing impact, from an earlier LROC NAC observation that unfortunately only overlaps the Featured Image at these points. The smaller grooves overlap those from the unnamed crater to the west (upper left). LROC NAC M118444752L , orbit 2589, January 18, 2010; resolution 1.09 meters from 52.43 kilometers [NASA/GSFC/Arizona State University].
The greater than 15 degree impact angle results in a number of diagnostic features including asymmetric ejecta and non-circular crater shapes. In the Featured Image, it is clear that this impact has asymmetric ejecta since the area immediately to the south of the crater is "missing" its high reflectance ejecta. 

The asymmetry of the small impact, its missing south half, are clearly seen in this LROC Wide Angle Camera (WAC) mosaic of sequential LROC WAC observations in orbits 11104 and 11105, November 18, 2011; 62 meters resolution over a roughly 30 km-wide field of view [NASA/GSFC/Arizona State University].
The small crater's location, high amidst the highest elevations on the Moon, in the Farside Highlands Terrain (FHT), is indicated by the arrow at center, that also shows slope angles throughout the region are not as level as they might seem in close photography. LROC WAC Digital Terrain Model (DTM) hemispheric orthographic projection centered on 240° E (below) [NASA/GSFC/DLR/Arizona State University].
The region in hemispheric context, orthographic projection centered on 0°N, 240°E [NASA/GSFC/DLR/Arizona State University].
Due to the low angle of impact, the ejecta has more momentum in the direction of travel of the impact, which causes the asymmetric ejecta patterns. The area with the least ejecta is sometimes called the "zone of avoidance," and it indicates the impactor flight direction. In this case, the impactor was traveling from the south to the north when it hit the lunar surface (north is up in the Featured Image).

Explore the entire NAC frame HERE for more impact features.

Related Images:
Slice of Mare
How did I form?
Asymmetric Ejecta

Wednesday, November 21, 2012

ESA Lunar Lander mission axed

The EADS Astrium - European Space Agency (ESA) Lunar Lander, clinging to a 2018 landing, possibly on the rim of lunar South Pole crater Shackleton, is likely scrubbed [EAS/Astrium].
Germany's DLR has reportedly given up advocating the 2018 south polar Lunar Lander mission as ESA member nations struggle with dire discretionary budget constraints in the midst of an on-going sovereign debt crisis.

Germany dropped further efforts to secure joint European funding for Lunar Lander at an ESA budget meeting in Naples in favor of upgrades to the Ariane 5.

Meanwhile, following NASA's exit from the ExoMars orbiter-rover mission, in development since 2005, Russia's Federal Space Agency Roscosmos has become ESA's new launch partner, set to launch the orbiter half of that mission in 2016 and its tandem six-wheeled rover two years later.

Related Posts:
ESA input sought on multi-purpose lunar lander (March 2, 2009)
Astrium study of ESA NEXT lunar lander underway (June 10, 2009)
Remembering SMART-1 (September 17, 2009)
ESA: Fly us to the Moon's South Pole (March 31, 2010)
NEXT step for ESA's first lunar lander (September 16, 2010)
Astrium tests ESA Lunar Lander thrusters (March 5, 2012)
ESA's MoonNEXT boosted by ATV development (April 30, 2012)
ESA Lunar Lander still on target for 2018 (July 27, 2012)

Tuesday, September 25, 2012

A cluster of dark-haloed secondary craters

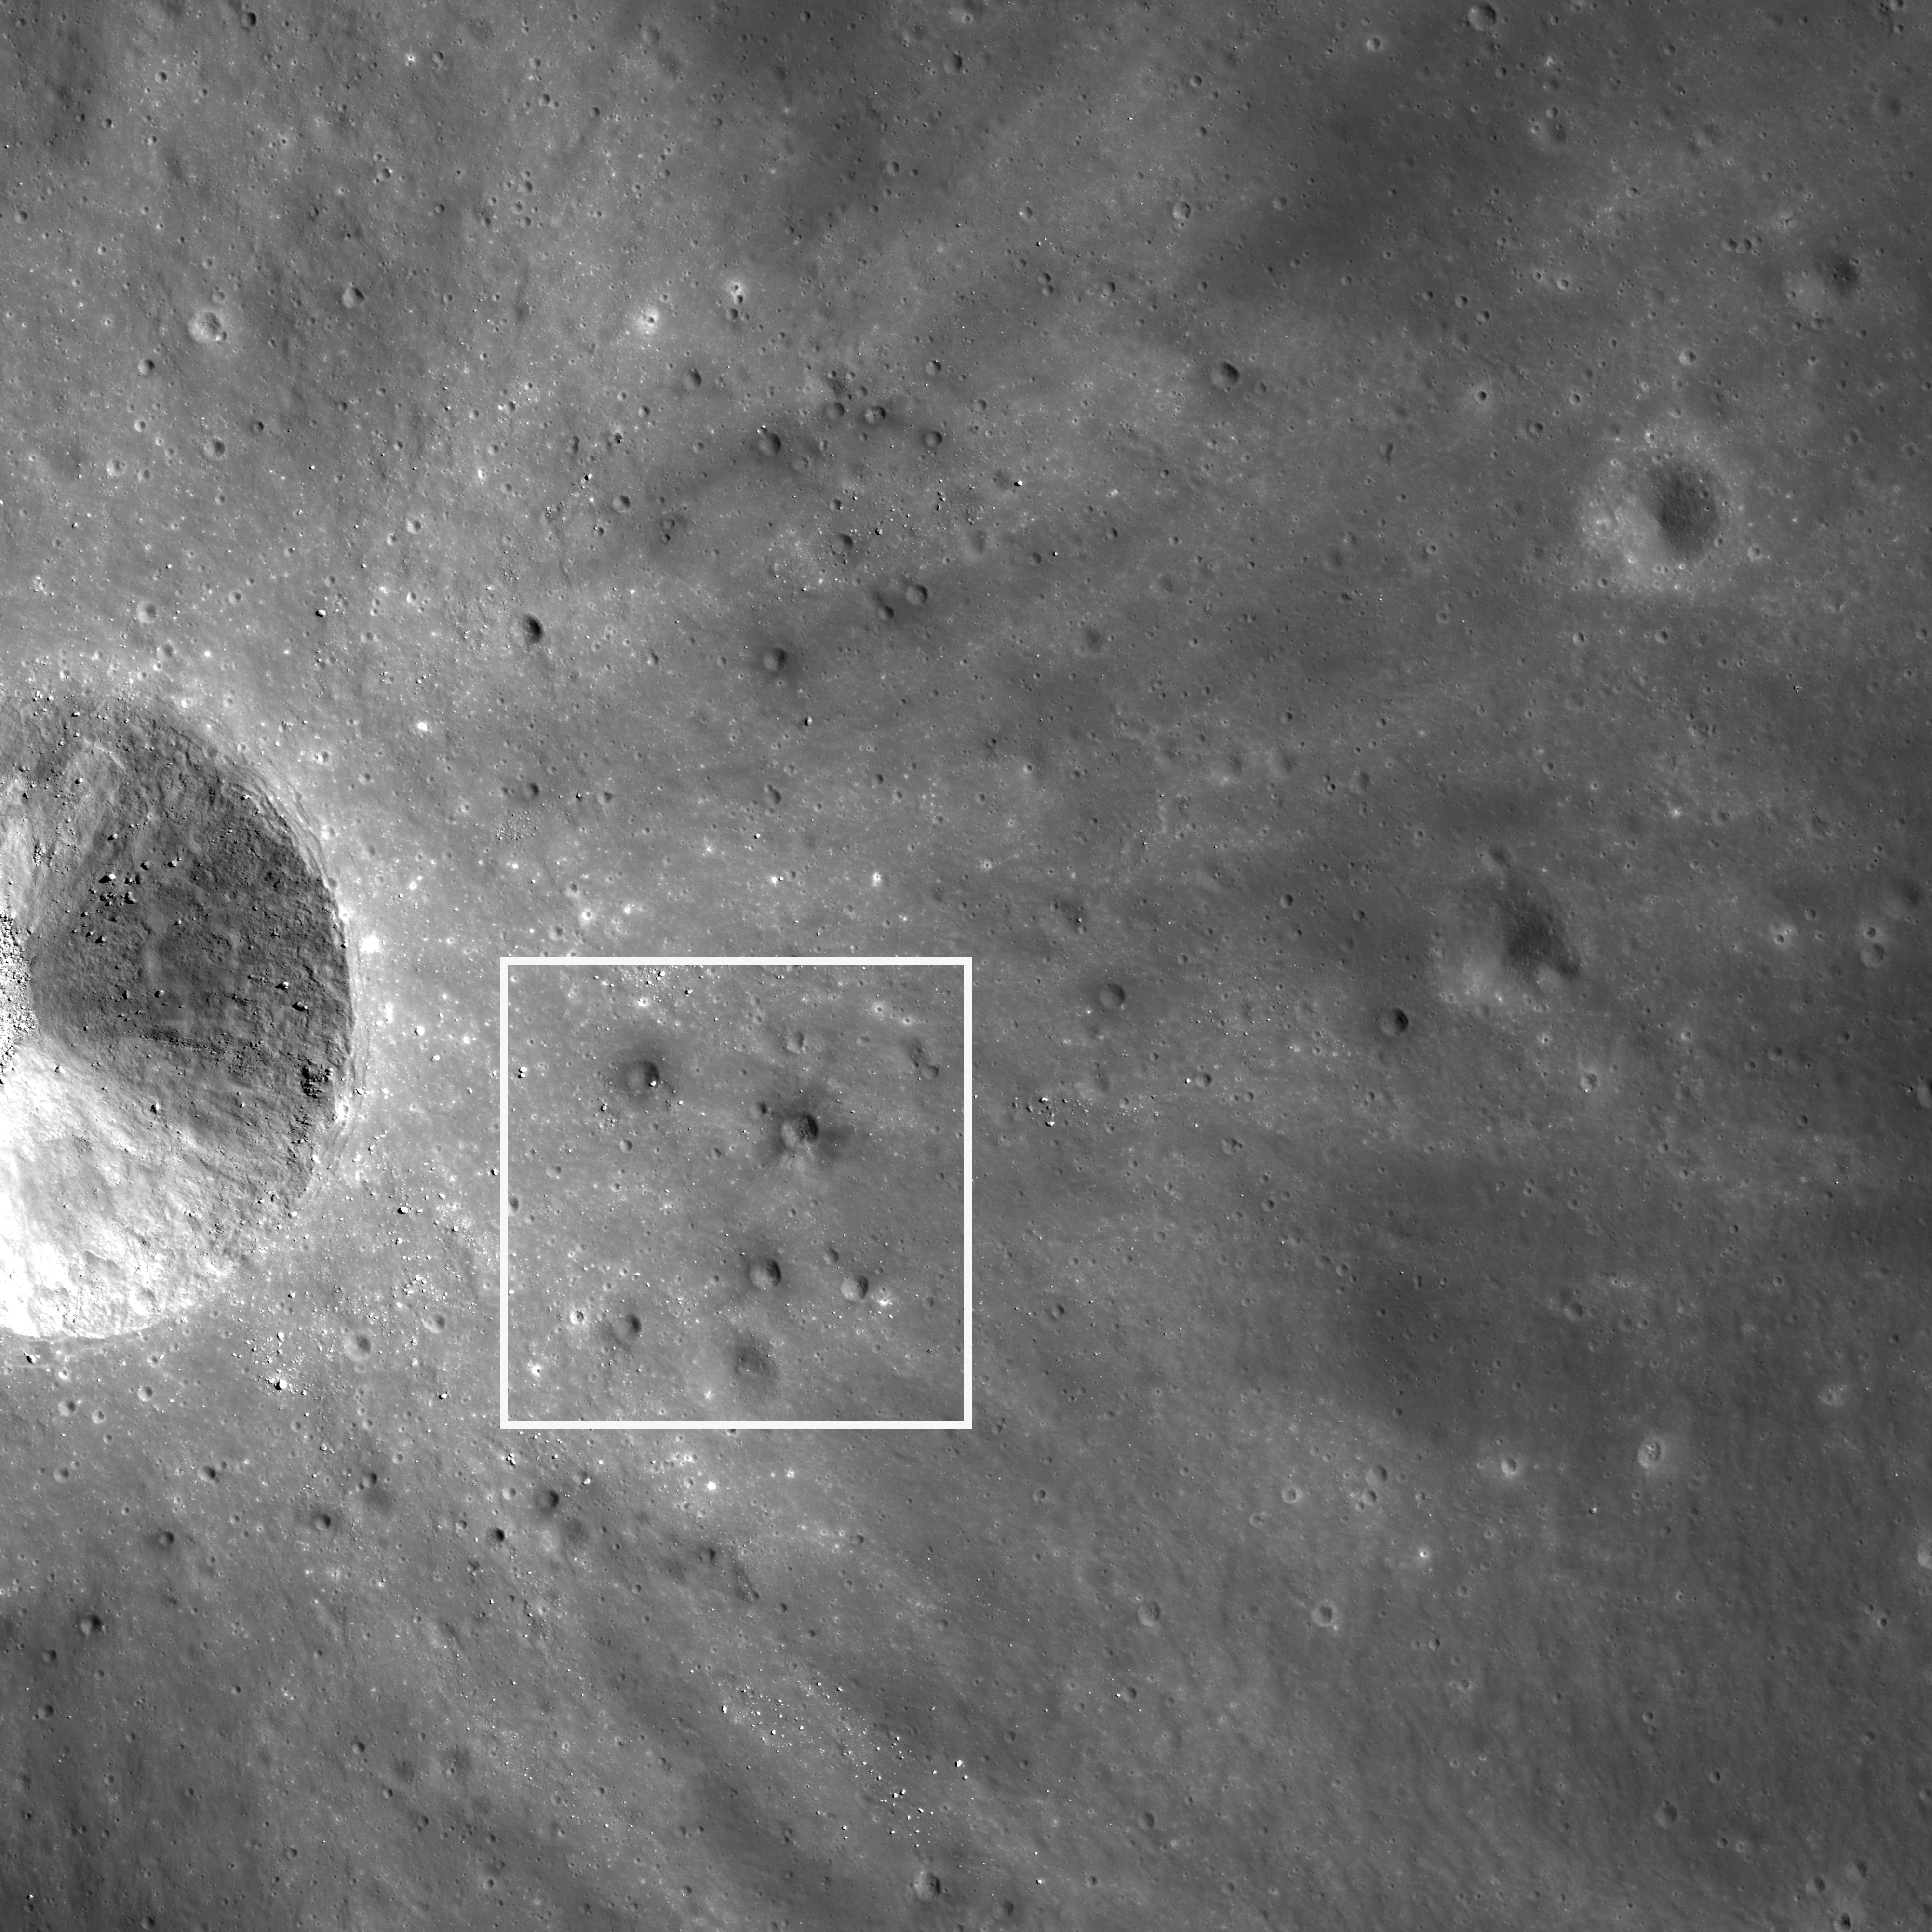
A collection of dark-haloed craters lines a sloping crater rim southwest of Sklodowska crater (19.21°S; 93.56°E). North is up; illumination is from the west-southwest, field of view image is about 625 meters. From LROC Narrow Angle Camera (NAC) observation M174665969R LRO orbit 10974, October 31, 2011; full resolution 0.65 meters from 63.53 km [NASA/GSFC/Arizona State University].
James Ashley
LROC News System

The explanation for the origin of dark-haloed craters on the Moon is usually straightforward: Low-reflectivity material (rock or regolith) is overlain by more reflective and more recent deposits (usually ejecta from a relatively fresh impact), and then the underlying deposit is exhumed by even more recent impacts.

This stratigraphy tends to present the darker material as ejecta overlying the lighter material in high contrast. Such is the case for the dark-haloed craters in today's Featured Image.Zooming out to the context frame below reveals their relationship to the crater responsible for the light ejecta.

But why do we see such a high number of these features here, and why do they seem to be grouped close to the rim of this small, unnamed crater located outside Sklodowska crater?

The wider NAC frame around the field of view selected for the LROC Featured Image (white square) in broader context. Field of view ~2.7 km [NASA/GSFC/Arizona State University].
The similarity in ejecta albedo suggests that the time between individual crater impacts was not great, and they are therefore likely to be secondary craters having a single larger impact as their source. The main question is whether the bolides that formed this group of craters arrived from an impact some distance away, or whether they are examples of so-called "self-secondaries." In the latter case, the blocks that created these features would have been ejected almost vertically during excavation of the large crater in the context image. They would have remained aloft long enough for the main ejecta blanket to be emplaced before returning to the surface and creating the pattern we see. Some recent studies are suggesting that more self-secondary craters are to be found closer to the main crater rim. This new finding can explain why there appear to be more of these dark-halo craters closer to the main crater rim, if they are indeed self-secondaries.

If, however, these secondary impacts originate with another, more-distant impact, then the clustering we think we see may be illusory. Perhaps this apparent grouping depends more on the location of the low-reflectance deposits than on the locations of the impacts. In that case many other craters in the region might also be related by formation time to these dark-haloed craters, but do not show dark haloes because they missed those deposits.

A wider view of the full LROC NAC frame with the local elevation, derived from LROC Wide Angle Camera (WAC) interferometry, puts the bright crater in context with the wide ejecta blanket outside Sklodowska, from 222 meters above to 132 meters below global mean elevation  [NASA/DLR/GSFC/Arizona State University].
The WAC mosaic context image shows few bright-rayed craters in the region; field of view 144 km, north is up [NASA/GSFC/Arizona State University].
The WAC mosaic reveals the broader context of the Featured location. What other craters can you find in this area that might be responsible for the secondary impacts? Why or why not? Which theory seems to have the most validity? Can you think of other scenarios that could account for today's Featured Image?

Click HERE to review the full NAC image. Additional examples of secondary features can be found in The Rays of Messier A, the Chain of Secondaries in Mare Orientale, and in Scouring Secondary Ejecta.

Simulated orbital view of the vicinity of southwest Sklodowska crater, from 37 km over a point 70 km from the bright unnamed crater (below center) outside the older crater rim. NASA ILIADS application, LMMP [NASA/GSFC/LMMP/Arizona State University].

Thursday, June 21, 2012

Shackleton harbors ice after all

Spoke too soon! When JAXA released this Kaguya Terrain Camera image, showing the deep interior of Shackleton crater for the first time in 2008, scientists claimed it disappointingly showed no indication of ice, though no one yet can say how a slurry of lunar volatiles might appear. Now, however, researchers analyzing laser altimetry returned by the LOLA instrument on-board the Lunar Reconnaissance Orbiter (LRO) cite strong evidence of ice content in the permanently shadowed interior.  The Moon's south pole is serendipitously situated on Shackleton's rim, directly under all of LRO's nearly twenty thousand polar orbits since 2009, affording extraordinary study [JAXA/SELENE]..
Jennifer Chu

If humans are ever to inhabit the moon, the lunar poles may well be the location of choice: Because of the small tilt of the lunar spin axis, the poles contain regions of near-permanent sunlight, needed for power, and regions of near-permanent darkness containing ice — both of which would be essential resources for any lunar colony.

The area around the moon’s Shackleton crater could be a prime site. Scientists have long thought that the crater — whose interior is a permanently sunless abyss — may contain reservoirs of frozen water. But inconsistent observations over the decades have cast doubt on whether ice might indeed exist in the shadowy depths of the crater, which sits at the moon’s south pole.

Now scientists from MIT, Brown University, NASA’s Goddard Space Flight Center and other institutions have mapped Shackleton crater with unprecedented detail, finding possible evidence for small amounts of ice on the crater’s floor. Using (the LOLA) laser altimeter on the Lunar Reconnaissance Orbiter (LRO) spacecraft, the team essentially illuminated the crater’s interior with laser light, measuring its albedo, or natural reflectance. The scientists found that the crater’s floor is in fact brighter than that of other nearby craters — an observation consistent with the presence of ice, which the team calculates may make up 22 percent of the material within a micron-thick layer on the crater’s floor.
 

The group published its findings today in the journal Nature.

In addition to the possible evidence of ice, the group’s map of Shackleton reveals a “remarkably preserved” crater that has remained relatively unscathed since its formation more than three billion years ago. The crater’s floor is itself pocked with several smaller craters, which may have formed as part of the collision that created Shackleton.

The crater, named after the Antarctic explorer Ernest Shackleton, is more than 12 miles wide and two miles deep — about as deep as Earth’s oceans. Maria Zuber, the team’s lead investigator and the E.A. Griswold Professor of Geophysics in MIT’s Department of Earth, Atmospheric and Planetary Sciences, describes the crater’s interior as “extremely rugged … It would not be easy to crawl around in there.”

Mapping the dark. Slipping past the Moon's south pole on the brightly lit rim of Shackleton crater, the dark of the permanently shadowed interior of the crater quickly overtakes a very steep crater wall, like the terrestrial oceans. LRO has skipped through thousands of polar orbits eventually carrying the vehicle over every area on the Moon's surface and over Shackleton, high at the top of everyone's list of priority targets, during every orbit,   LROC Narrow Angle Camera (NAC) M142464150L, LRO orbit 6128, October 23, 2010, 89.21° angle of incidence, 0.87 meters resolution from 41.91 kilometers [NASA/GSFC/Arizona State University].
The group was able to map the crater’s elevations and brightness in extreme detail, thanks in part to the LRO’s path: The spacecraft orbits the moon from pole to pole as the moon rotates underneath. With each orbit, the LRO’s laser altimeter maps a different slice of the moon, with each slice containing measurements of both poles. The upshot is that any terrain at the poles — Shackleton crater in particular — is densely recorded. Zuber and her colleagues took advantage of the spacecraft’s orbit to obtain more than 5 million measurements of the polar crater from more than 5,000 orbital tracks.

“We decided we would study the living daylights out of this crater,” Zuber says. “From the incredible density of observations we were able to make an extremely detailed topographic map.”

The team used the (LOLA) to map the crater’s elevations based on the time it took for laser light to bounce back from the moon’s surface: The longer it took, the lower the terrain’s elevation. Through these measurements, the group mapped the crater’s floor and the slope of its walls.

A quaking theory.The researchers also used the laser altimeter to measure the crater’s brightness, sending out pulses of infrared light at a specific wavelength. The crater’s surface absorbed some light based on its own natural albedo, reflecting the rest back to the spacecraft. The researchers calculated the difference, and mapped the relative brightness throughout the crater’s floor and walls.

While the crater’s floor was relatively bright, Zuber and her colleagues observed that its walls were even brighter. The finding was at first puzzling: Scientists had thought that if ice were anywhere in a crater, it would be on the floor, where very little sunlight penetrates. The upper walls of Shackleton crater, in comparison, are occasionally illuminated, which could evaporate any ice that accumulates.

How to explain the bright walls? The team studied the measurements, and came up with a theory: Every once in a while, the moon experiences seismic shaking brought on by collisions, or gravitational tides from Earth. Such “moonquakes” may have caused Shackleton’s walls to slough off older, darker soil, revealing newer, brighter soil underneath.
Until very recently luna incongnita, the permanently shadowed 10.3 km-wide interior of Shackleton, shouldering the Moon's south pole (blue arrow), today seems much like hundreds of other lunar craters of similar age and dimension. Its ink-black interior has steadily been brightly unveiled in a steady build-up of laser data points collected over the course of three years in polar orbit by the LOLA instrument on LRO. As it is on Earth, however, in Real Estate, "location is everything" [NASA/GSFC/LOLA].

Zuber says there may be multiple explanations for the observed brightness throughout the crater: For example, newer material may be exposed along its walls, while ice may be mixed in with its floor. Her team’s ultra-high-resolution map, she says, provides strong evidence for both.

Ben Bussey, staff scientist at Johns Hopkins University’s Applied Physics Laboratory, says the group’s evidence for ice in Shackleton crater may help determine the course for future lunar missions.

“Ice in the polar regions has been sort of an enigmatic thing for some time … I think this is another piece of evidence for the possibility of ice,” Bussey says. “To truly answer the question, we’ll have to send a lunar lander, and these results will help us select where to send a lander.”

Zuber adds that the group’s topographic map will help researchers understand crater formation and study other uncharted areas of the moon.

“I will never get over the thrill when I see a new terrain for the first time,” Zuber says. “It’s that sort of motivation that causes people to explore to begin with. Of course, we’re not risking our lives like the early explorers did, but there is a great personal investment in all of this for a lot of people.”

The research was supported by the Lunar Reconnaissance Orbiter Mission under the auspices of NASA’s Exploration Systems Mission Directorate and Science Mission Directorate.

Japan's scientists may have leaped to conclusions when they over-confidently announced there was no ice inside Shackleton (upper left), after releasing the first image of the crater's interior a few years ago, but their iconic high-definition image of an orbital Earthrise from November 2007 still takes the breath away [JAXA/NHK/SELENE].

Thursday, April 26, 2012

"Our view of the Moon has turned upside down"

Ralf Jaumann, Head of the Planetary Geology
Department, DLR Institute of Planetary Research
Elisabeth Mittelbach
DLR (HT: NLSI)

Interview with DLR's Ralf Jaumann

On 19 and 20 April, 170 international experts met to discuss present and future lunar research

The Moon continues to be a fascinating research objective for scientists from around the world. The DLR Institute of Planetary Research collaborated with NASA’s Lunar Science Institute to hold a two-day Lunar Symposium, which took place on 19 and 20 April 2012 at the Adlershof Forum in Berlin. 170 participants, primarily from Europe, the United States, Japan and Russia, exchanged the latest scientific insights gained about Earth’s natural satellite.

In a brief interview, Ralf Jaumann, Head of the Planetary Geology Department at the DLR Institute of Planetary Research, tells us what this European summit meeting of Moon researchers was all about.

Why did DLR and four other partners convene this Lunar Symposium?

A great deal has occurred in the field of lunar research in the last three years. Since the two latest lunar missions, Chandrayaan-1, India’s first Moon mission in 2008, and NASA’s Lunar Reconnaissance Orbiter (LRO) that launched in 2009, our view of the Moon has been turned upside down. Before these missions, we thought that Earth’s celestial companion was extremely dry, but now we are aware that it contains water. Even if it only exists in small amounts, this is quite sensational news. We have found water at the south pole, in what are known as ‘cold sinks’. These are very deep impact craters, into which light never penetrates, and which therefore never experience heating. Furthermore, water can arise on the surface of the Moon as a result of the reaction between hydrogen protons from solar wind and the oxygen in lunar rock. Indeed, thanks to modern research methods, we have also been able to discover water in the rock samples brought back to Earth by the Apollo missions. Consequently, the theory of a ‘dry Moon’ is no longer a tenable one, and it opens up new questions regarding the origin of our satellite. The Moon is particularly fascinating for me because it is the only celestial object that we are able to observe with the naked eye, and also because it has a direct influence in our life, for example through the monthly calendar and the ocean tides.

What were the objectives of this symposium?

Read the full, brief interview, HERE.

Tuesday, January 31, 2012

View from Vavilov

Vavilov (0.8°S, 138.8°W), the 'relatively recent' 98 km crater straddles a crossroads in the violent timeline of the Moon's history and sports some of the Moon's highest elevations on the northern and western rim. Interestingly, Vavilov formed nearly on top of a similarly sized and much older crater whose rim is still visible as a semicircle immediately northeast. Both craters carved out the same unique notch in the west wall of Hertzsprung impact basin. Image from 160 kilometer wide field of view cropped from a LROC Wide Angle Camera monochrome (566 nm) mosaic stitched from eight June 3, 2010 orbital viewing opportunities averaging 76 meters per pixel with an incidence angle of 64.5° from 55 km altitude [NASA/GSFC/Arizona State University].
WAC-derived elevation model (GLD100) Scene elevation (meters)
minimum = 2131.00, maximum = 9317.00 NASA/GSFC/Arizona State
University].
The elevation models of the Moon, built up during the record-breaking first 10,000 orbits by the Lunar Reconnaissance Orbiter (LRO), are finally allowing us to see the lunar surface in definitive detail. Naturally, this is especially true of the farside, invisible from Earth, and the polar regions. Even the vast highlands of the farside, unseen before 1959, have either been imaged at very wide angles or at low angle in part.

The Lunar Reconnaissance Orbiter Camera (LROC) in particular has been a spectacular success at imaging nearly half the Moon's surface at very high resolution and in surveying the entire Moon under a wide range of lighting conditions. One result is a highly accurate digital terrain model that just keeps getting better.

A weak attempt to represent a 100 degree wide panorama of the Vavilov interior and southern rim from its highest elevations situated along that crater's north rim. For the first time LROC is allowing us to imagine what that view might be, but it still does such a scene little justice to squeeze it into a 580 pixel-wide image [NASA/GSFC/ILIADS/Arizona State University].
Until LRO, many, but not all, of the wide angle views of the lunar farside have been focused on low resolution wavelength analysis, albedo, mineral and some low light relief. And even millions of laser altimetry measurements haven't matched the number of points recorded by LOLA during the LRO's present mission, already in lunar orbit far longer than any previous spacecraft. The record of the location of places photographed and measured hasn't been helped by the simple fact that no one really knew the Moon's actual shape and size with a high accuracy until Japan's Kaguya (SELENE-1) mission.

The Moon's highest elevations (10,761 meters) are now believed to be more than 600 km northwest of Vavilov, on the rounded wide rim of the crater Engel'gardt, but as we round the Moon's western rim, past Oceanus Procellarum and north of Mare Orientale where the farside highlands begin, and continue to proceed westward along the Moon equator the first very highest elevations encountered are on the north and western rim of Vavilov.

Easily among the highest elevations east of Engle'gardt East is on the upper reaches of the slumping wide north wall of Vavilov. We can only guess whether those heights could have once been much higher. The chaotic terraces of the western interior of Vavilov testify to a high degree of slumping, massive landslides underway since the crater formed. LROC WAC observation M130205287C (566 nm), orbit 4321, June 3, 2003; incidence 64.67° with a resolution of 77.11 meters per pixel, from an altitude of 55.31 km [NASA/GSFC/Arizona State University].
That Vavilov is deeply notched into the west-southwestern wall of the vast Hertzsprung impact basin is not something one can easily tell from Clementine (1994) albedo imagery, for example. So many craters with extended ray systems, like Jackson, overlap over the farside highlands, already bright for their relative lack of the mare-filled basins that dominate the nearside, that getting a gauge on elevations has remained elusive until the LRO mission. With the human eye alone its nearly impossible. But there is a reason why Vavilov is different, and higher, in one half than the other.

The west-southwest of Vavilov is not as stark a contrast in elevations as its north wall but the elevations are still respectable. The highest point along that rim is 9317 meters, among the Moon's highest places, and the high ejecta blanket, outside Hertzsprung on this side of the crater, tapers off less dramatically as well. The interior on the west side of Vavilov is more dramatically terraced, and this was probably not the original rim, its original circumference having collapsed, probably many times. The view seen in high detail in LROC Narrow Angle Camera (NAC) M151440688L shows a couple of kilometers-wide strip near this high elevation, and that along with other detailed images seem to show the process of slumping is still, slowly, underway. LROC WAC  observation imaged at the same opportunity, LRO WAC observation M151440362C, orbit 7451 February 4, 2011; incidence angle 51.43° at a resolution of 81.2 meters per pixel from 58.55 km [NASA/GSFC/Arizona State University].
The Vavilov impact event was not the first to carve out a place on the wall of Hertzsprung. The crater is offset just a little to the southwest from the crater, of almost identical size, that first made the notch and first interrupted the full circle of the 590 km-wide Hertzsprung impact basin. Vavilov's progenitor came close to erasing it's sister sometime after, and all that remains of the older crater is a semicircle like a cup handle attached to Vavilov's northeast.

The LROC WAC-derived Digital Elevation Model (GLD100) brings Vavilov out of the glare, in false color. The terrain was already on the rise from the southeast before the Hertzsprung or Korolov (further westward along the farside equator) because the formation of the Moon's oldest, deepest and largest known South Pole Aitken impact basin, further southeast may have help to lift the whole wider area along its perimeter here 4 billion years ago. The uplift of the third ring of mountains around Hertzspring rose still higher, first interrupted here by the arrival of Vavilov D. The area carries the deep scars and secondary craters of what some believe to be the most recent mare-filled basin-forming impact at Orientale, to the southeast. Vavilov probably formed after that event, superimposed on all those more ancient happenings. Vavilov is about seven kilometers deep, from its floor to the heights on its north and west rims [NASA/GSFC/DLR/Arizona State University].
The high western side of Vavilov perched on the southwestern outer ring of Hertzsprung and, on closer examination, the scaring and secondary crater chains radiant from the energetic impact that formed Mare Orientale, straddling the Moon's west limb and visible on edge from Earth. The most influential morphology that lifted this area is mostly invisible from Earth, the wide and deep 4 billion year old South Pole Aitken (SPA) basin at lower left. Orthographic projection over the intersection of the Moon's equator and its 240th meridian east [NASA/GSFC/DLR/Arizona State University].
Vavilov was unfavorable placed for the Apollo mapping cameras, and not well situated, nor a priority, for the Lunar Orbiter photography before Apollo. Other than the polar regions, this area of the Moon received less attention than most other areas until Clementine, and then from a low-resolution experimental remote sensing standpoint. LRO has changed that, however, and so much else. We now know that the view, and from the standpoint of science, the excavation performed by the Vavilov progenitor warrants more attention.

Even from orbit Vavilov must be spectacular.

Courtesy of the NASA ILIADS application, the LROC 100m WAC Global Mosaic draped over the LOLA 128 px DEM (v.2), the simulated "orbital view" of Vavilov from 65 km over the center of Hertzsprung basin.