Showing posts with label LROC. Show all posts

Wednesday, February 18, 2015

Hell Q

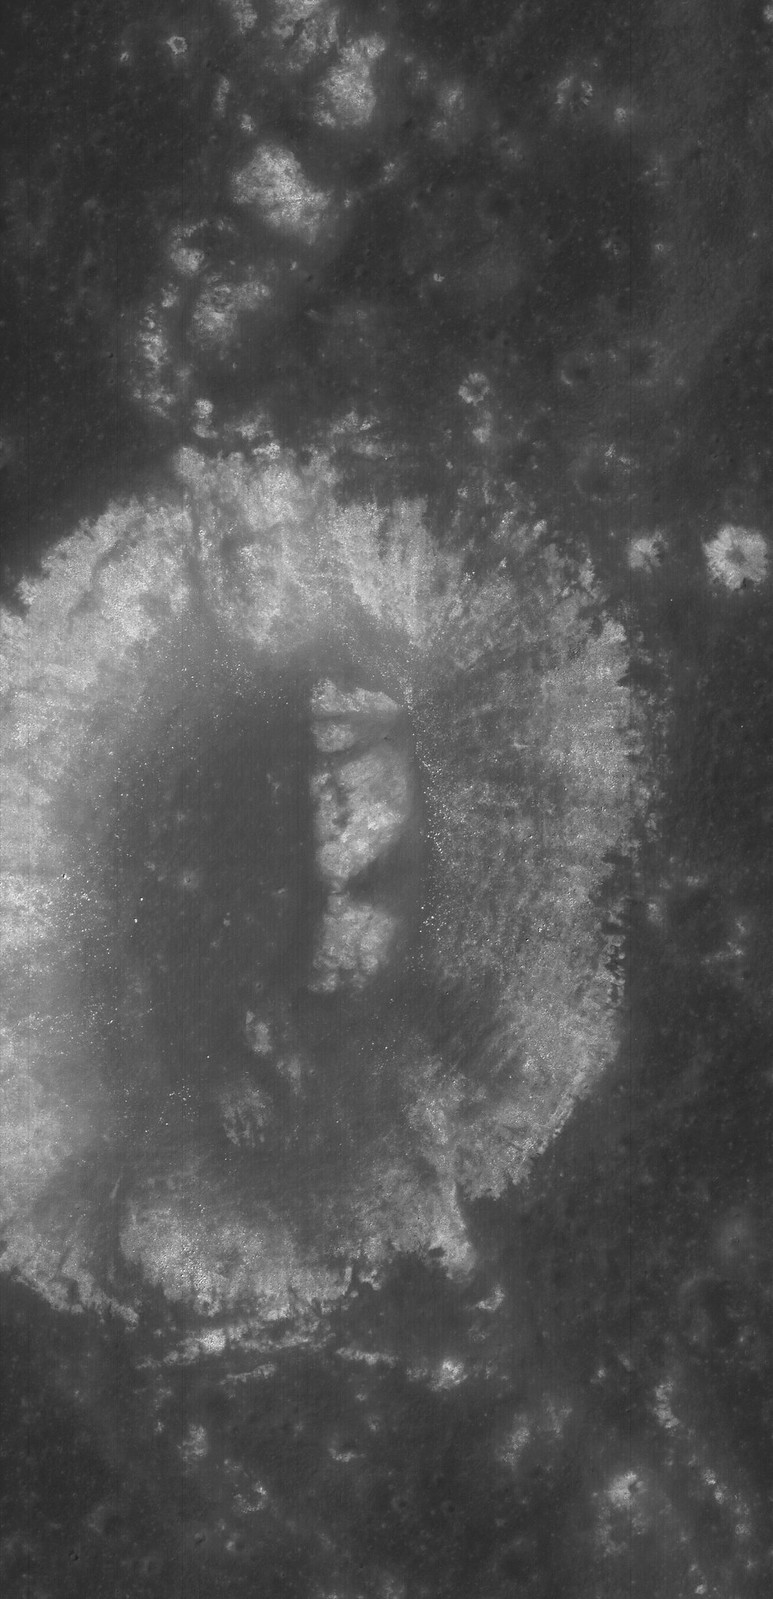
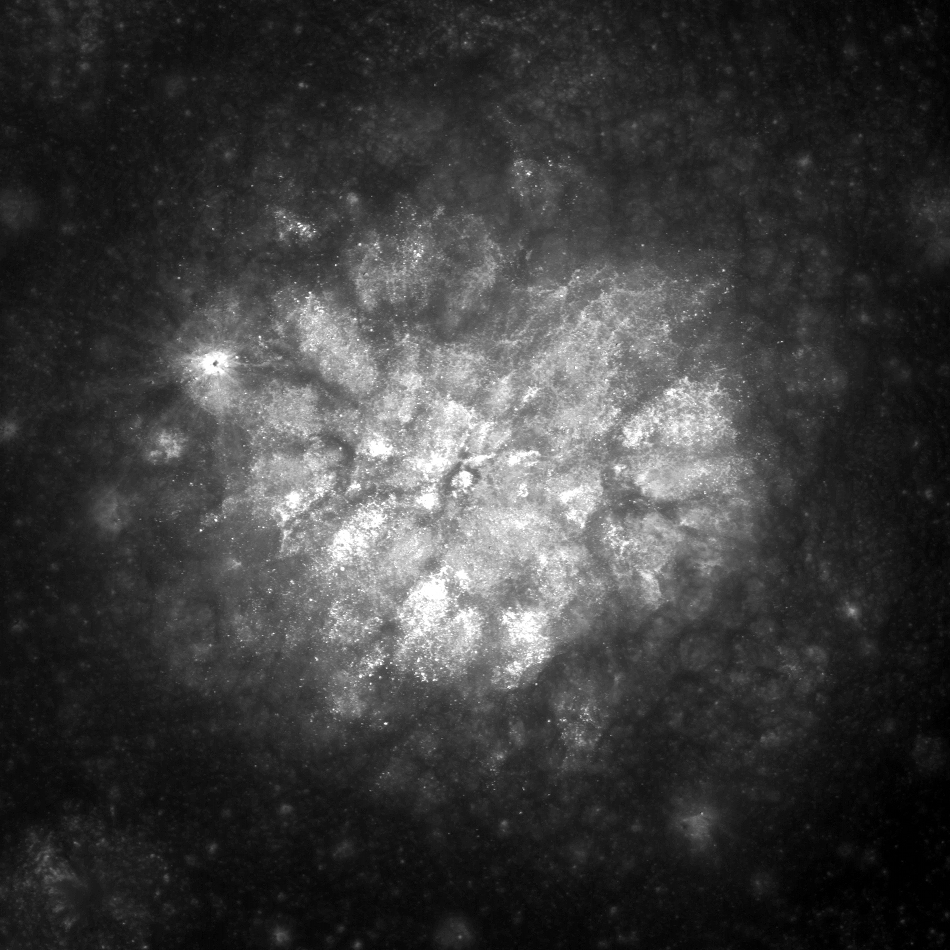
LROC NAC mosaic M1164853645RL, LRO orbit 23561, September 8, 2014; spacecraft and cameras slewed 3° from nadir, 33.17° angle of incidence, 71 cm resolution from 68.29 km over 33.07°S, 355.72°E [NASA/GSFC/Arizona State University].
Hell Q (3.75 km; 33°S, 355.53°E) seems younger than Tycho, standing out as it does in the nearside Southern Highlands northeast of the more famous astrobleme. 

There seems little doubt the effect of the larger, far more widespread blast zone from Tycho changed the face of this contemporary but pre-existing smaller crater. The chevron effect left grooves untouched down stream and tore away a chunk of the northeast rim, morphologies apparently perpendicular to a straight line drawn southwest to the more spectacular, 109 million year-old Tycho.

View full resolution views, of a variety of sizes, HERE.

Wednesday, February 4, 2015

Hydrogen retention on pole-facing slopes

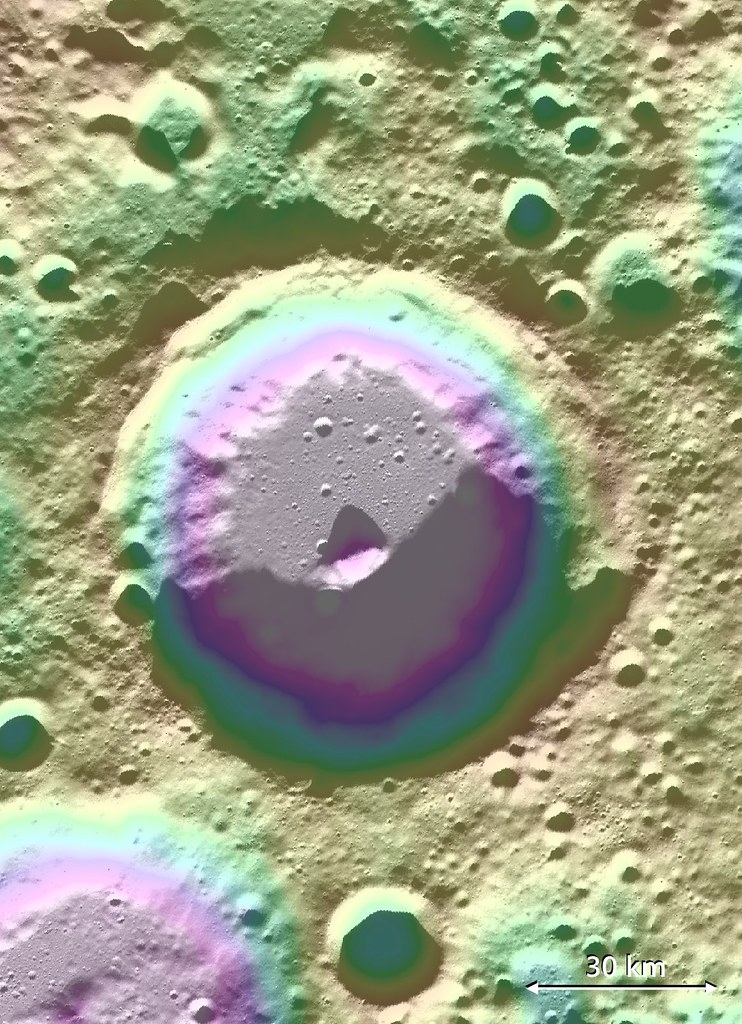
Lovelace (57.06 km; 82.08°N, 250.49°E) crater, of the Moon's far north, hosts a signature of volatiles within permanently shadowed regions (PSR) on the inside slope of its south wall. Long-term studies of the Moon's reserves of hydrogen and other volatiles, made possible by the extended science missions of the Lunar Reconnaissance Orbiter (LRO), show a diurnal cycle of hydrogen retention on pole-facing slopes, perhaps a result of neutral hydrogen from the Sun. [NASA/GSFC/ASU/LOLA/PDS].
Bill Steigerwald
Goddard Space Flight Center

Space travel is difficult and expensive – it would cost thousands of dollars to launch a bottle of water to the moon. The recent discovery of hydrogen-bearing molecules, possibly including water, on the Moon has explorers excited because these deposits could be mined if they are sufficiently abundant, sparing the considerable expense of bringing water from Earth.

Karnik
Lunar water could be used for drinking or its components – hydrogen and oxygen – could be used to manufacture important products on the surface that future visitors to the moon will need, like rocket fuel and breathable air.

Recent observations by NASA's Lunar Reconnaissance Orbiter (LRO) spacecraft indicate these deposits may be slightly more abundant on crater slopes in the southern hemisphere that face the lunar South Pole.

"There’s an average of about 23 parts-per-million-by-weight (ppmw) more hydrogen on Pole-Facing Slopes (PFS) than on Equator-Facing Slopes (EFS)," said Timothy McClanahan of NASA's Goddard Space Flight Center.

This is the first time a widespread geochemical difference in hydrogen abundance between PFS and EFS on the moon has been detected. It is equal to a one-percent difference in the neutron signal detected by LRO's Lunar Exploration Neutron Detector (LEND) instrument. McClanahan is lead author of a paper about this research published online October 19 in the journal Icarus.

The hydrogen-bearing material is volatile (easily vaporized), and may be in the form of water molecules (two hydrogen atoms bound to an oxygen atom) or hydroxyl molecules (an oxygen bound to a hydrogen) that are loosely bound to the lunar surface. The cause of the discrepancy between PFS and EFS may be similar to how the Sun mobilizes or redistributes frozen water from warmer to colder places on the surface of the Earth, according to McClanahan.

"Here in the northern hemisphere, if you go outside on a sunny day after a snowfall, you'll notice that there's more snow on north-facing slopes because they lose water at slower rates than the more sunlit south-facing slopes" said McClanahan. "We think a similar phenomenon is happening with the volatiles on the moon – PFS don't get as much sunlight as EFS, so this easily vaporized material stays longer and possibly accumulates to a greater extent on PFS."

The team observed the greater hydrogen abundance on PFS in the topography of the moon's southern hemisphere, beginning at between 50 and 60 degrees south latitude.
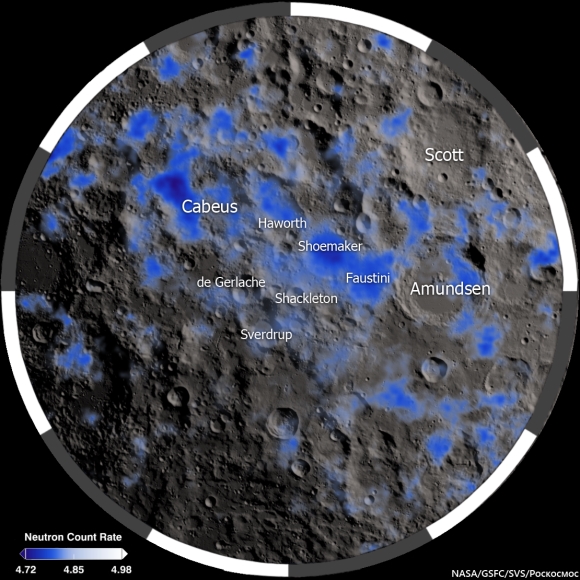
The Moon's polar south and its neutron suppression zpmes, indicative of the presence of hydrogen (inside and outside permanent shadow) mapped from data collected from the LRO LEND instrument over two and a half years [NASA/GSFC/SVS/Pockocmoc].
Slopes closer to the South Pole show a larger hydrogen concentration difference. Also, hydrogen was detected in greater concentrations on the larger PFS, about 45 ppmw near the poles. Spatially broader slopes provide more detectable signals than smaller slopes. The result indicates that PFS have greater hydrogen concentrations than their surrounding regions. Also, the LEND measurements over the larger EFS don't contrast with their surrounding regions, which indicates EFS have hydrogen concentrations that are equal to their surroundings, according to McClanahan. The team thinks more hydrogen may be found on PFS in northern hemisphere craters as well, but they are still gathering and analyzing LEND data for this region.

There are different possible sources for the hydrogen on the moon. Comets and some asteroids contain large amounts of water, and impacts by these objects may bring hydrogen to the moon. Hydrogen-bearing molecules could also be created on the lunar surface by interaction with the solar wind. The solar wind is a thin stream of gas that's constantly blown off the Sun. Most of it is hydrogen, and this hydrogen may interact with oxygen in silicate rock and dust on the moon to form hydroxyl and possibly water molecules. After these molecules arrive at the moon, it is thought they get energized by sunlight and then bounce across the lunar surface; and they get stuck, at least temporarily, in colder and more shadowy areas.

Since the 1960's scientists thought that only in permanently shadowed areas in craters near the lunar poles was it cold enough to accumulate this volatile material, but recent observations by a number of spacecraft, including LRO, suggest that hydrogen on the moon is more widespread.

It's uncertain if the hydrogen is abundant enough to economically mine. "The amounts we are detecting are still drier than the driest desert on Earth," said McClanahan. However, the resolution of the LEND instrument is greater than the size of most PFS, so smaller PFS slopes, perhaps approaching yards in size, may have significantly higher abundances, and indications are that the greatest hydrogen concentrations are within the permanently shaded regions, according to McClanahan.

The team made the observations using LRO's LEND instrument, which detects hydrogen by counting the number of subatomic particles called neutrons flying off the lunar surface. The neutrons are produced when the lunar surface gets bombarded by cosmic rays. Space is permeated by cosmic rays, which are high-speed particles produced by powerful events like flares on the Sun or exploding stars in deep space. Cosmic rays shatter atoms in material near the lunar surface, generating neutrons that bounce from atom to atom like a billiard ball. Some neutrons happen to bounce back into space where they can be counted by neutron detectors.

Neutrons from cosmic ray collisions have a wide range of speeds, and hydrogen atoms are most efficient at stopping neutrons in their medium speed range, called epithermal neutrons. Collisions with hydrogen atoms in the lunar regolith reduce the numbers of epithermal neutrons that fly into space. The more hydrogen present, the fewer epithermal neutrons the LEND detector will count.

Neutron suppression information in the Moon's polar north is, as yet, less granular than data mapped in greater detail over the far South. Here neutron suppression is overlaid on a LROC WAC mosaic with permanently shadowed regions (PSRs) outlined in black. Again, the occurrence of hydrogen is related to sunlight but not necessarily tied to its total absence.
The team interpreted a widespread decrease in the number of epithermal neutrons detected by LEND as a signal that hydrogen is present on PFS. They combined data from LEND with lunar topography and illumination maps derived from LRO's LOLA instrument (Lunar Orbiter Laser Altimeter), and temperature maps from LRO's Diviner instrument (Diviner Lunar Radiometer Experiment) to discover the greater hydrogen abundance and associated surface conditions on PFS.

In addition to seeing if the same pattern exists in the moon's northern hemisphere, the team wants to see if the hydrogen abundance changes with the transition from day to night. If so, it would substantiate existing evidence of a very active production and cycling of hydrogen on the lunar surface, according to McClanahan.

The research was funded by NASA's LRO mission. LEND was supplied by the Russian Federal Space Agency Roscosmos. Launched on June 18, 2009, LRO has collected a treasure trove of data with its seven powerful instruments, making an invaluable contribution to our knowledge about the moon. LRO is managed by NASA's Goddard Space Flight Center in Greenbelt, Maryland, for the Science Mission Directorate at NASA Headquarters in Washington.

Monday, February 2, 2015

LRO could remain in present orbit 7 or more years

Because the Moon is lumpy and uneven, it's possible nothing has ever been in close-orbit around our companion planet as long as the Lunar Reconnaissance Orbiter. Certainly nothing built by humans. Few deep space missions have delivered as much return on their investment. The sheer volume of data returned by LRO exceeds all deep space missions ever launched combined, several times over [NASA/GSFC/SVS].


THE SECOND EXTENDED SCIENCE MISSION
FOR THE LUNAR RECONNAISSANCE ORBITER:
STATUS, SCIENCE GOALS, AND DATA DELIVERIES

Noah E. Petro and John W. Keller
NASA Goddard Space Flight Center
Solar System Exploration Division

The Lunar Reconnaissance Orbiter (LRO) has been orbiting the Moon for over five years. In that time, data from the seven instruments onboard the spacecraft have made significant advances in our understanding of the Moon and its environment. In September 2014 LRO completed its first Extended Science Mission (ESM) and began a second ESM (ESM2). 

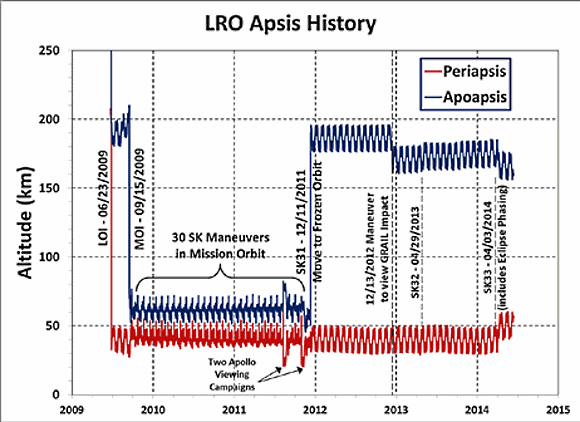
During the both ESM and ESM2, LRO has been in a quasi-stable, eccentric orbit of ~40 x 180 km with a periapse near the South Pole (Figure 1). This orbit enables high resolution measurements around the South Pole. 

The LRO Project is considering a maneuver in early 2015 to lower the periapse in order to further improve measurements over the South Pole, particularly by the LOLA instrument. Based on the current annual consumption of fuel, the spacecraft could remain in its current orbit for at least 7 more years.

FIGURE 1. Orbital history of LRO since arriving at the Moon in 2009. LRO now employs yearly station keeping (SK) maneuvers in order to maintain its orbit. There are also periodic momentum unload burns that use small quantities of fuel.
LRO Operations: As part of the approval for continued operations, LRO was directed by NASA HQ to terminate operations of the Mini-RF instrument. All of LRO’s remaining six instruments are operating nominally, and have experienced no significant degradation since beginning the ESM over two years ago.

During extended operations the LRO spacecraft has performed exceptionally well, with 98.4% uptime during the life of the mission. LRO retains sufficient fuel quantities so that its current orbit could be maintained for at least 8 years, if not longer.

LRO Science In ESM2: An overarching theme of ESM2 for LRO is that of change. A number of measurements have shown changes to the lunar surface and to its environment. LRO will focus on the five following themes that each build on prior observations from LRO, LADEE, GRAIL, and the Moon Mineralogy Mapper. Each theme has numerous questions that are address, an example few are given here.
  1. Transport of Volatiles. How are volatile elements and compounds distributed, transported, and sequestered?
  2. Contemporary Surface Change. What causes changes in the flux and intensities of meteoroid impacts onto terrestrial planets.
  3. Regolith Evolution. Characterize planetary surfaces to understand how they are modified by geologic processes.
  4. Probing the Interior from Observations of the Surface. Characterize planetary interiors to understand how they differentiate and evolve from their initial state
  5. Interactions with the Space Environment.  How is surface material modified exogenically? How do exospheres form, evolve, and interact with the space environment?
LRO Data: The LRO instrument teams will continue to deliver data to the PDS every three months. As of the beginning of 2015 over 575 Tb of data have been placed into the PDS [1]. This data volume contains a range of products, including higher level maps, mosaics, and derived products. The PDS has made available the Lunar Orbital Data Explorer [2], a mapbased tool to search for finding and downloading PDS science data of LRO as well as other recent lunar missions.

In addition to the PDS holdings, several of the LRO instrument teams have additional products and tools available on their websites (Table 1).

Several global map products have recently been added to the PDS, here we highlight a few that are new in the last year. The Mini-RF team has assembled a global mosaic of their monostatic measurements [3].

For the first time we have global radar data for the Moon, data that clearly shows variations in rock abundance and surface texture over both the near and farside (Figure 2).

FIGURE 2. Mini-RF global mosaic of the Circular Polarization Ratio (CPR), one of the number of Mini-RF mosaic products now available online.
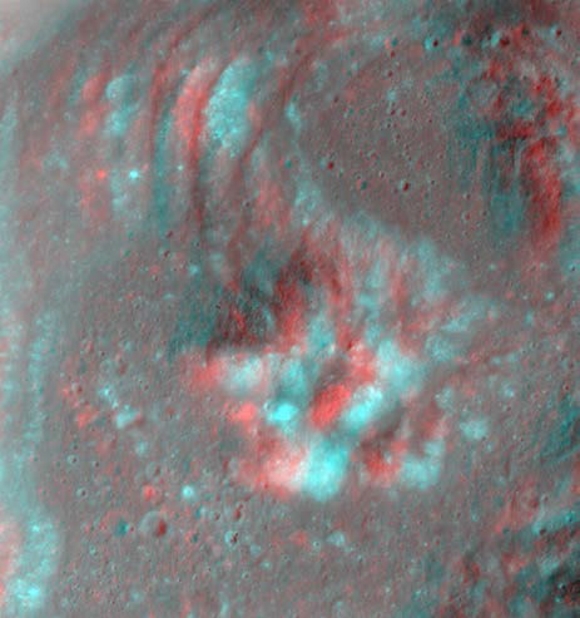
The LROC team regularly adds new products to the PDS via the team webpage (Table 1), including shapefiles, global mosaics, NAC-derived DEM’s, and NAC mosaics of selected targets. Recently the LROC team has made available a number of anaglyphs (Figure 3) showcasing the ability of the LRO spacecraft and the LROC team to precisely target the NACs.

FIGURE 3. Red-Blue anaglyph of the central peak of Euler crater.  The LROC team has made a number of anaglyphs available on their website (Table 1).
The LAMP team has a number of polar products available, including FUV ratio maps of both poles (Figure 4). These following maps are available at a resolution of 240 meters per pixel; Lyman-α (119.57–125.57 nm), Long (130–190 nm), On-band (130–155 nm), Off-band (155–190 nm), H2O Absorption Feature Depth Maps made by a Ratio map of on/off band.

FIGURE 4. LAMP Lyman-α map of the South Pole. LRO has focused on volatiles at the South Pole since arriving at the Moon 5+ years ago.
Table 1. LRO teams and their websites

LRO Project

Outreach

CRaTER

Diviner

LAMP

LEND

LOLA

LROC

Mini-RF

Use LRO Data!

The LRO Project has begun holding a series of data users workshops with the goal of helping the community work with the large volume of LRO data. Presentations given at the workshops are archived at the LRO website [4]. Questions regarding the access and use of LRO data can be directed to the authors of this abstract.

References:  [1] LRO PDS Archive, (http://pdsgeosciences.wustl.edu/missions/lro/).
[2] Lunar Orbital Data Explorer, (http://ode.rsl.wustl.edu/moon/).
[3] Cahill, J. T. S., et al., (2014) Icarus, 243, 173-190.
[4] LRO Data Resources, (http://lunar.gsfc.nasa.gov/resources.html).

Sunday, February 1, 2015

LROC detects 26000 changes to lunar surface since '09

Close look at south wall of the Copernican age crater Fetchner T (14.33 km; 58.74°S, 122.82°E), a 2.3 km-wide field of view from LROC NAC observation M113148900R, LRO orbit 1808, November 18, 2009; incidence 67.98° at 64 cm resolution, from 61.71 km above 58.84°S, 122.02°E. Polar orbital tracks converge nearer together, allowing more frequent re-imaging  and opportunities to detect changes to the landscape [NASA/GSFC/Arizona State University]. 
DYNAMIC MOON REVEALED WITH HIGH RESOLUTION TEMPORAL IMAGING

46th Lunar and Planetary Science Conference, #2325
Speyerer and Robinson, Povilaitis and Wagner
School of Earth and Space Exploration
Arizona State University

Introduction: The Lunar Reconnaissance Orbiter Camera (LROC) began systematically mapping the Moon in the summer of 2009 with the goal of acquiring an image dataset to facilitate future exploration [1]. With the aid of the extended science mission, we have discovered hundreds of new impact craters, thousands of smaller probable secondaries, and evidence of recent crater modification using repeat observations with the high resolution Narrow Angle Camera (NAC) and a custom change detection program.

Temporal Dataset: As of 1 January 2015, LROC has acquired nearly a million NAC images of illuminated terrain. From this total, nearly 10,000 are images acquired of regions of the Moon where previous NAC observations with similar lighting and observational geometry exist (i.e. incidence angle difference more than 3°, incidence angle greater than 50°, and nadir pointing).

These before and after image pairs, called temporal pairs, enable the search for a range of surface changes, including new impact craters, formed between the time the first and second image were acquired; individual temporal pairs currently span between 176 to 1241 Earth days.

Change Detection: Since a single NAC temporal pair can contain up to 1.09 billion pixels, manual scanning of thousands of temporal pairs is impractical. However, 131 images were manually scanned and 657 surface changes were identified [2] providing a baseline for the automated change detection algorithm.

We developed an automated change detection program that identifies and crops out suspected changes from each temporal pair. Thumbnails of these candidate areas are extracted and manually classified using a custom web interface. Of the 46,057 automatically identified surface changes recorded to date, manual inspection confirmed that over half (56%) are indeed changes to the surface.

This semi-automated procedure reduces the human time required to inspect a temporal pair by over a factor of 200.

New Impact Craters and Secondaries: From the temporal pairs scanned to date (1 January 2015), we identified 225 new resolved impact craters (e.g. Fig. 1). These craters range in diameter from 1.5 meters to 43 meters and are distributed across the surface over a variety of terrain types (Fig. 2; red dots). In addition, targeted NAC observations imaged 18 and 34 meter diameter craters where impact flashes were observed on 17 March 2013 and 11 September 2013 respectively (Fig. 2; blue dots).

Fig. 1: Before (left) and after (right) images of a new 18 meter impact crater discovered by automatically scanning NAC temporal pairs.
We also identified nearly 26,000 other surface changes that do not exhibit visible crater rims but only a change in surface reflectance. These include high reflectance changes (i.e. increase in surface reflectance), low reflectance changes, as well as mixed reflectance changes (Fig. 3).

Fig. 2: Location of new impact craters overlaid on a LROC Wide Angle Camera basemap (Latitude Range: 55°N to 55°S, Longitude Range 180°E to 180°E). The red dots indicate the location of the 225 new impact craters discovered to date with NAC temporal pairs and the blue dots show the location of the two craters located with the help of Earthbased impact flash observations [3,4].
These changes are thought to be the result of small primary events in which the resulting impact crater is smaller than the resolution limit of the temporal pair or by a secondary disturbance caused by a nearby primary event. In several cases, these surface changes show clear directional indicators pointing back to a larger primary crater [3] confirming their origin as secondary craters.

Fig. 3: Example of low (left column) and high (right column) reflectance changes identified with NAC temporal pairs. The top row consists of a pair of before images, the middle row is a pair of after images, and the bottom row is a ratio of the after/before observation. Each image field of view is 250 meters across.
Crater Modification: Temporal pairs also revealed seven new landslide events inside Copernican age impact craters (Fig. 4). Several of these landslides are the result of small impact events occurring on steep (slopes over 30°) crater walls.

These landslides typically show boulder trails extending from the new impact crater and tracing a path toward the crater floor and occasionally growing in width as a result of the falling block dislodging material along the steep surface. One such event caused material to travel over 4 km to the floor of the larger parent crater.

In addition, we discovered new landslides that lack any indicator of emanating from a new impact crater. These landslides exhibit a much broader surface change (greater than 100 meters wide flows instead of narrow boulder tracks witnessed with the previously described landslides). We speculate that these may be the result of a seismic event such as a Moonquake or a large distant meteor impact disrupting regolith poised near the angle of repose and causing the loosened regolith to cascade down to the crater floor.

Fig. 4: Example of two temporal ratio images (after/before) showing recent landslide events. The image on the left shows a 250 meter-wide field of view, boulder trails extending down slope from a new impact crater. At right is 600 meter-wide view showing a larger landslide with no indication it results from an impact on the wall of the parent crater. In each example, the elevation depicted decreases from the top to the bottom.
Summary: As of 1 January 2015, we have scanned and classified changes in 8300 NAC temporal pairs using our automated change detection tool leading to the discovery of 225 impact craters ranging in size from 1.5 to 43 m. In addition, we also identified thousands of other surface changes, including:

- 23,458 low reflectance changes
- 1,911 high reflectance changes
- 468 mixed reflectance changes
- 1 Chinese lander/rover

Throughout the second extended science mission, the LROC team will continue to acquire and scan high resolution temporal pairs. From this new dataset we plan to refine estimates on the flux of small (less than 0.5 meter) bolides in the inner solar system as well as quantify secondary impact-related hazards on the Moon, which is not only an important scientific finding but a key engineering design concern for future long duration surface assets.

References: [1] Robinson M.S. et al. Space Science Reviews, 150, 1-4, 81-124 (2010); [2] Thompson S.D. et al., Recent impacts on the Moon, 45th Lunar and Planetary Science Conference (2014), #2769; [3] New crater on the Moon and a field of secondaries, Robinson M.S. et al. 45th LPSC, (2014) #2164; [4] http://lroc.sese.asu.edu/posts/810.

Tuesday, December 16, 2014

20th Release of LRO data to the PDS

It's time in the Sun finally came, last September. Marius K (3.61 km; 9.4°N, 309.3°E), south of its namesake, southeast of Reiner Gamma in Oceanus Procellarum, was among the few places on the lunar surface not previously imaged at high-resolution by LROC cameras. The closer look came at the end of the observational period in the latest, 20th release to the Planetary Data System, December 15, covering roughly mid-June through mid-September 2014. LROC NAC observation M1165144506R, LRO orbit 23602, September 12, 2014; 17.25° incidence angle, resolution 1.07 meters from 105 km over 9.93°N, 309.4°E [NASA/GSFC/Arizona State University].See a larger reproduction HERE.
Teams operating sensors on-board the Lunar Reconnaissance Orbiter, including the Lunar Reconnaissance Orbiter Camera (LROC), are currently updating the Planetary Data System with another treasure trove of records covering the three months from mid-June through mid-September.

The will be the 20th such Release to the PDS of information gathered from the remarkable LRO which has been orbiting the Moon since June 2009.

Of course, it must be added, this isn't the first time Marius K, transected by Procellarum wrinkle ridges, has been imaged by the LROC Wide Angle Camera. By way of comparison, the small crater is seen here at center in this 34 km-wide field of view in a LROC WAC monochrome (566 nm) mosaic from two sequential passes on July 24, 2011; 63.3 incidence angle, resolution 58.7 meters from 42.16 km [NASA/GSFC/Arizona State University].
Release 20 of Lunar Reconnaissance Orbiter data is now online at the Geosciences Node. This release includes new data acquired between June 15 and September 14, 2014, for CRaTER, Diviner, LAMP, LEND, LOLA, and LROC. Data can be found on the Geosciences Node LRO page. The Lunar Orbital Data Explorer allows one reliable way of searching and downloading LRO data.

Another image really requiring the viewer to select a full-size option to appreciate its detail. A roughly ten kilometer-wide view of the Reiner Gamma contact zone with the Marius Hills, in Oceanus Procellarum. From 20th release of LROC data released to the Planetary Data System (PDS), December 15, 2014. LROC NAC mosaic M1158112330LR, LRO orbit 22614, June 22, 2014; 67.62° incidence angle, resolution 1.07 meters from 105.12 km over 10.32°N, 304.48°E [NASA/GSFC/Arizona State University].
Full resolution view from the mosaic immediately above, showing on of the out-lying Marius domes apparently subject to the same influences that keep the Reiner Gamma swirl optically immature. Those studying processes on the Moon highly anticipate the tri-monthly releases of LRO data to the PDS, and hasten to search out familiar locations for a fresh perspective, or a first high-resolution view, even more than five years after LRO began operations.
Updates and instructions, etc., are regularly posted to the PDS Lunar Node, HERE.

Sunday, November 23, 2014

Dark splotches over high albedo, under a high sun

Unnamed crater (2.2784°N, 116.2125°E) southwest of King, presenting a unique albedo variation in 1.8 km-wide field of view from LROC NAC observation M123812230R, LRO orbit 3380, March 21, 2010; 8.3° incidence angle, resolution 57 cm from 55.36 km over 2.25°N, 116.16°E [NASA/GSFC/Arizona State University].
Hiroyuki Sato
LROC News System

Impact craters routinely excavate subsurface materials, exposing them in crater walls and in ejecta. The Featured Image highlights an unnamed fresh crater (480 meters in diameter) with numerous dark splotches.

Inside the crater cavity, dark splotches (low reflectance materials) occur from the middle to the trim of the crater and spread outward beyond the rim crest.

Several small craters (less than 100 meters in diameter) with similar dark splotches also occur in this region (outside the area shown above, see next image), suggesting that the dark materials were likely excavated from an extensive subsurface layer. The distribution of the dark halo craters informs us about the horizontal extent of these subsurface materials.

Small craters a few thousand meters north of the dark halo crater (DHC) of interest, above, from the same LROC NAC frame M123812230R. Note the crater right of center bottom may be superposed on the rim of a more ancient depression [NASA/GSFC/Arizona State University].
The crater in the opening image is found 116 km from the southwestern rim of King crater (76.2 km; 4.96°N, 120.49°E), located in the farside highlands. Unlike in the mare, pyroclastic deposits are unlikely to be the low-reflectance material (seen in the opening image) here in the middle of the highlands with no indication of volcanic activity near here. So, what is this low reflectance layer?

Context view of the location of today's Featured Image in WAC monochrome mosaic (100 m/pix) overlayed by WAC stereo DTM (GLD100, Scholten et al., 2012). The NAC footprint (blue box) and the exact location of the opening image (yellow arrow) are indicated [NASA/GSFC/Arizona State University]. 
The rays of Necho crater (36.87 km; 5.25°S, 123.24°E) extend out around 680 kilometers (see image below) crossing over King crater and the area in today's Featured Image. Since the area of opening image is crossed by the Necho ray deposits the excavated dark layer might be the original mature surface (now covered by Necho's high reflectance rays).  

Context view of the area of interest in an orthographic LROC WAC mosaic of low-angle observations of the surrounding hemisphere. Arrow points to the location of the crater of interest, within range of ejecta from King, Necho or perhaps, less likely, Giordano Bruno or Goddard A craters, (not unlike the magnetic anomaly east of Firsov) [NASA/GSFC/Arizona State University]. 
Due to the lack of atmosphere on the Moon, the photometric effect is very strong. Thus, it is hard to identify the relationships between the different layers using low-Sun images (images with large incidence angles, near sunrise or sunset); however, high-Sun images (those with low incidence angles, near noon) display clearly the relationships between units, which helps us reconstruct the resurfacing history of this area.

View full-size view of the LROC NAC frame, HERE.

Related Posts:

Tuesday, November 18, 2014

Mottled mound at Firsov

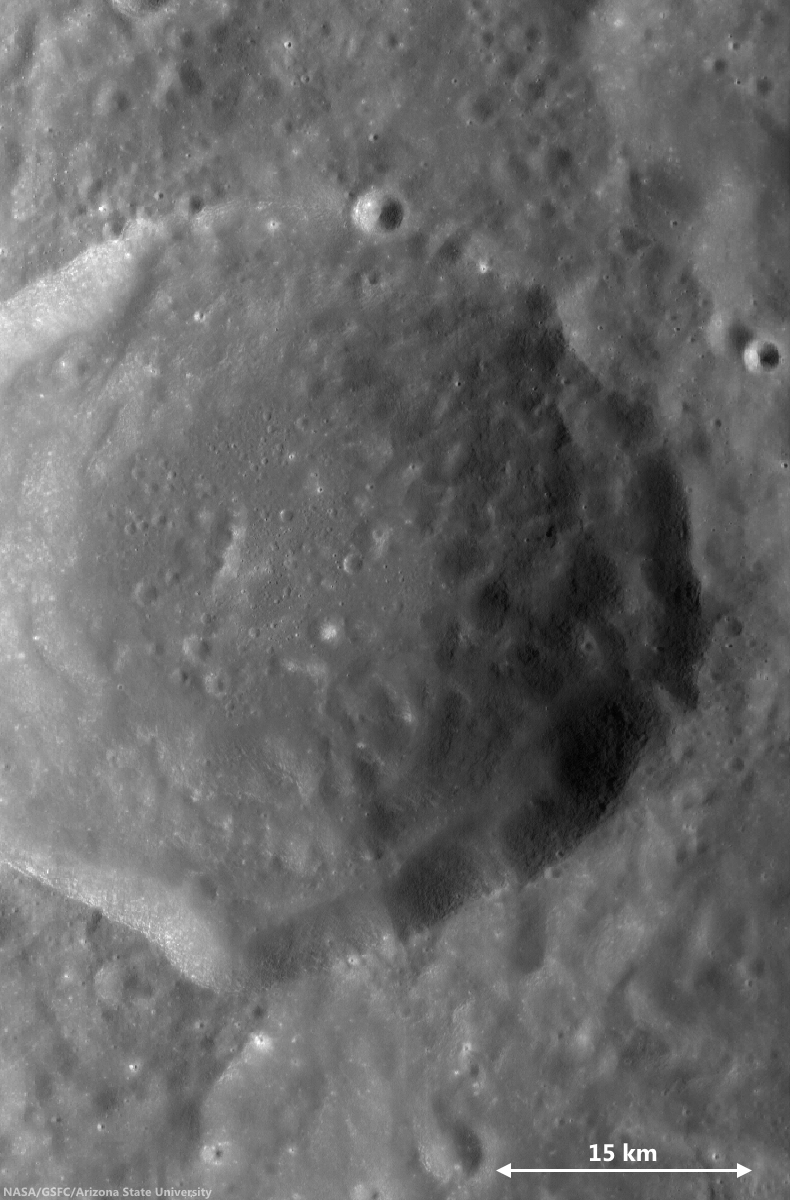
Low-angle incidence view of a curious mound on the floor of Firsov crater (51 km; 4.204°N, 112.697°E). 2.2 km field of view from LROC NAC observation M187506567R [NASA/GSFC/Arizona State University].
Hiroyuki Sato
LROC News System

Firsov is a 51-km diameter crater located in the farside highlands, approximately 240 km east of King crater. The depth of Firsov's floor from the rim crest is an impressive 4.5 km (that’s 2.5 times the depth of the Grand Canyon in Arizona).

The bright (highly reflective) mound on the crater floor is about 200 meters in height, and 2.5 km in diameter, and really catches your eye. The central portion of the crater floor is relatively flat, suggesting that it at least partially consists of a long-solidified pool of impact-melt; the mound is located within this melt pond deposit.

46 km-wide field of view showing  the high-reflectance mound feature, near center of FriFirsovater, from LROC WAC monochrome (643 nm) observation M176892340CE, LRO orbit 11204, November 25, 2011; 62.51 incidence, resolution 58.62 meters from 43.41 km [NASA/GSFC/Arizona State University].
A number of previous Featured Image posts explored the origins of mounds occurring inside impact craters. Hypotheses include volcanic eruptions, impact debris, and the squeeze-ups of impact melt.

Today's Featured Image highlights the degradation of these mounds, instead of their origin. The low-incidence angle of the top image (~9°) highlights differences in albedo on the mound top, what causes these bright patches?

Perhaps, as the mound surface degrades over time, the high-reflectance materials are exposed unevenly, for example, due to a bumpy surface morphology, where local, topographically high portions are exposed faster and newly exposed material is immature (and thus brighter).

Alternatively, the mound may be constructed from non-uniform materials and/or compositions that exhibit a range of reflectivities. However, scientists believe that during impacts any compositional differences within the target are homogenized in melt deposits. This mound would be a great place to examine that hypothesis.

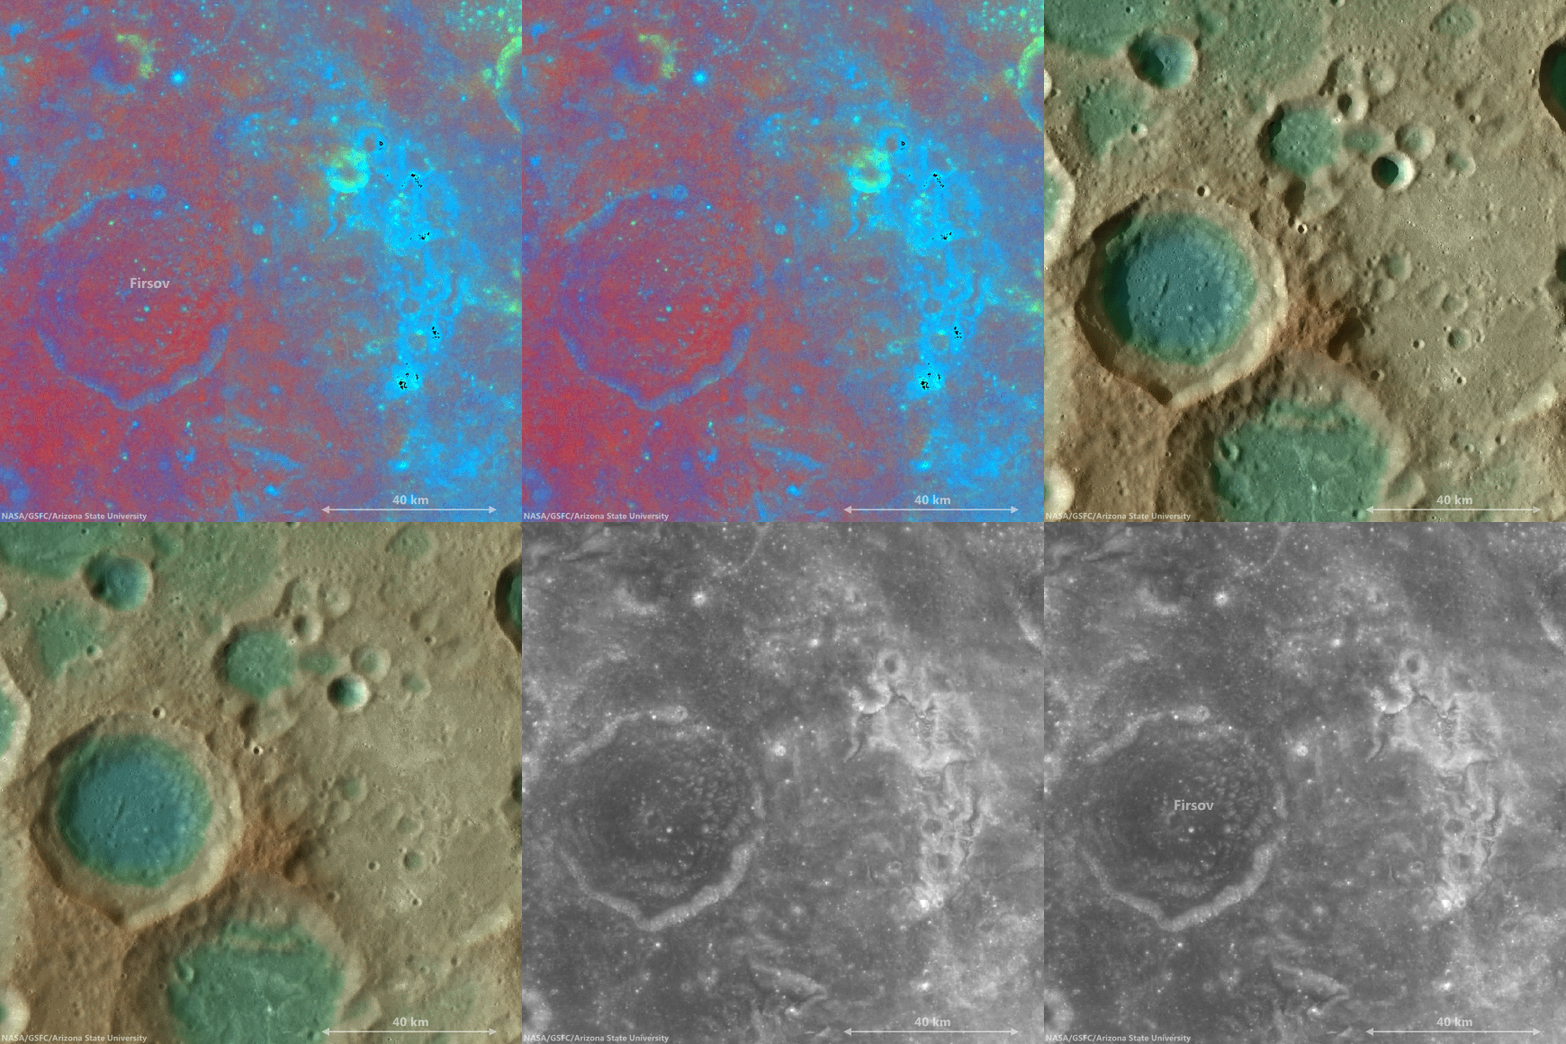
The bright mound southeast of center on the floor of Firsov is not the only albedo "anomaly" in the vicinity of Firsov crater. This cycle of overlapping fields of view, juxtapositioning data ranging from LROC WAC-derived elevation models to Clementine UV-VIS color ratio maps from 1994, brings into stark relief the unnamed Copernican era crater northeast of Firsov, and also the dramatic patch of albedo swirls coincident with a locally intense crustal magnetism, photographed from orbit by the crew of Apollo 10. It seems distant and detached, but still these swirls are likely associated with the widely-scattered swirl fields farther to the west at Mare Marginis, on the opposite side of the Moon from the energetic basin-forming impact that formed Mare Orientale 3.1 billion years ago [NASA/GSFC/Arizona State University].
View full-window, HERE.

Related Posts:
Shiny Mound
Kagami-mochi on the Moon!
Pancakes in a melt pond
Donut Holes
The Domes of Stevinus Crater
That's a Relief

Friday, November 7, 2014

Exploring the lunar subsurface

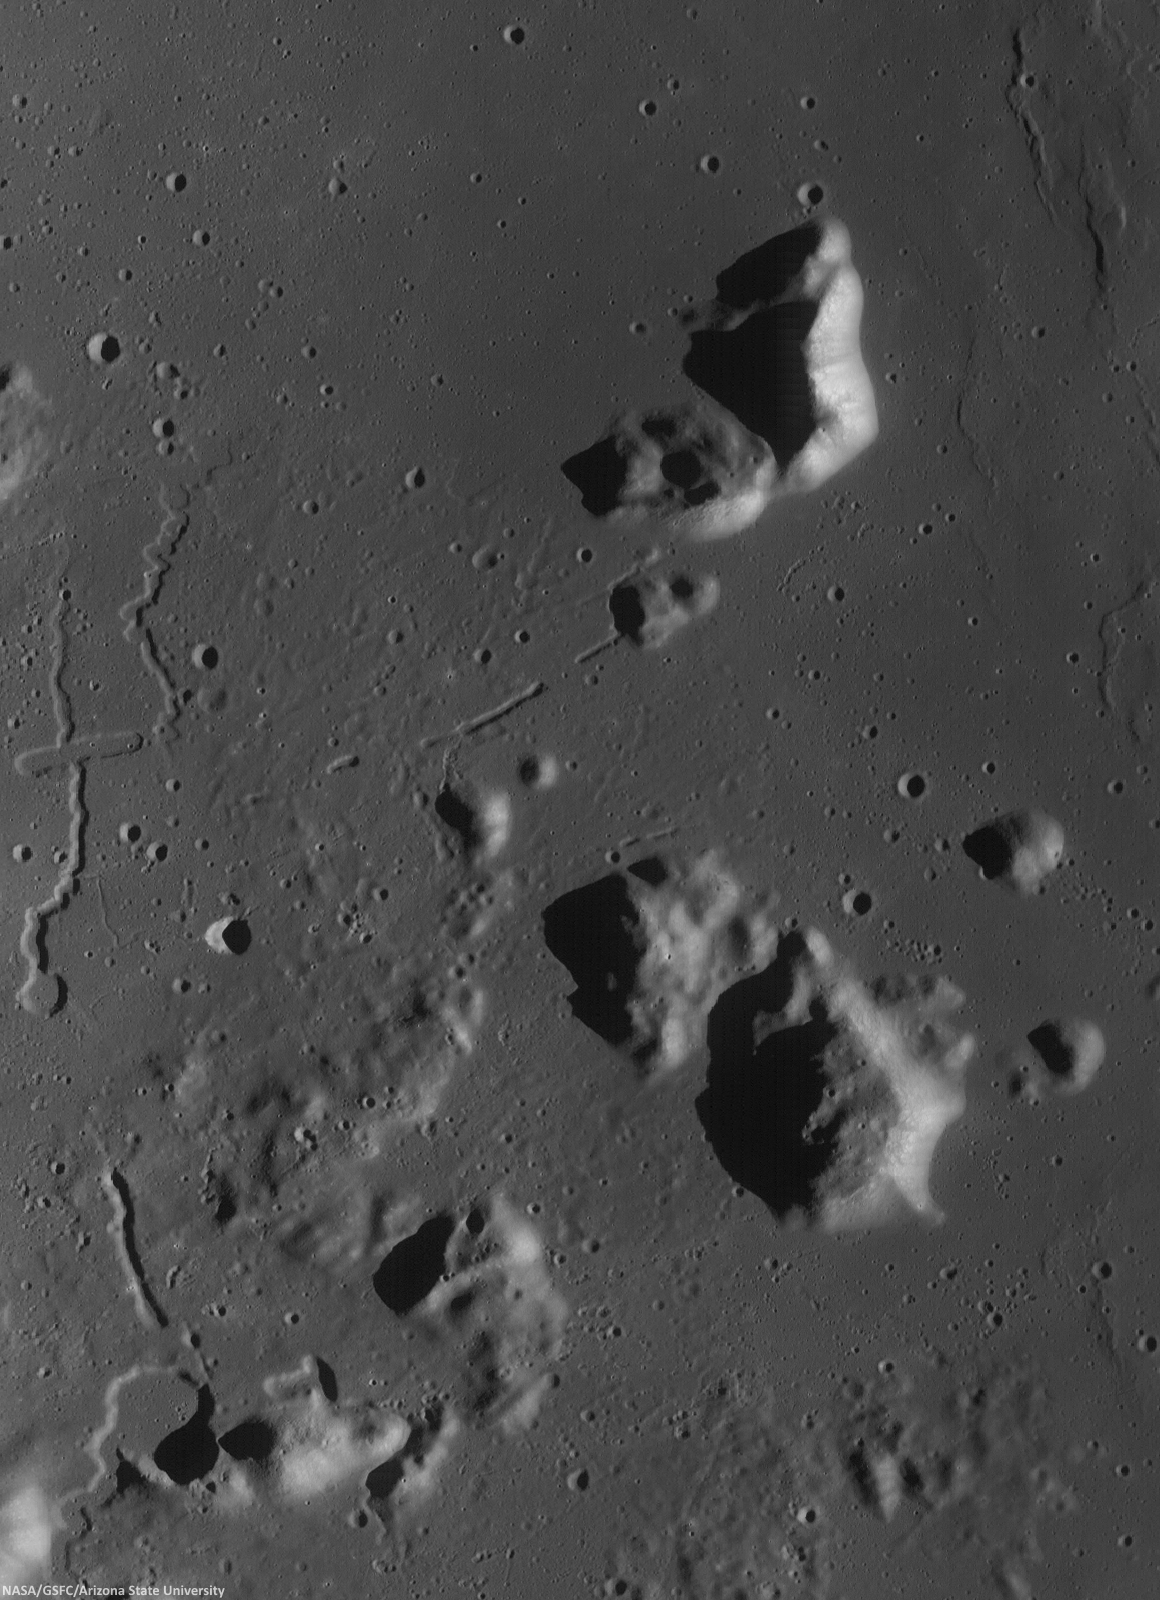
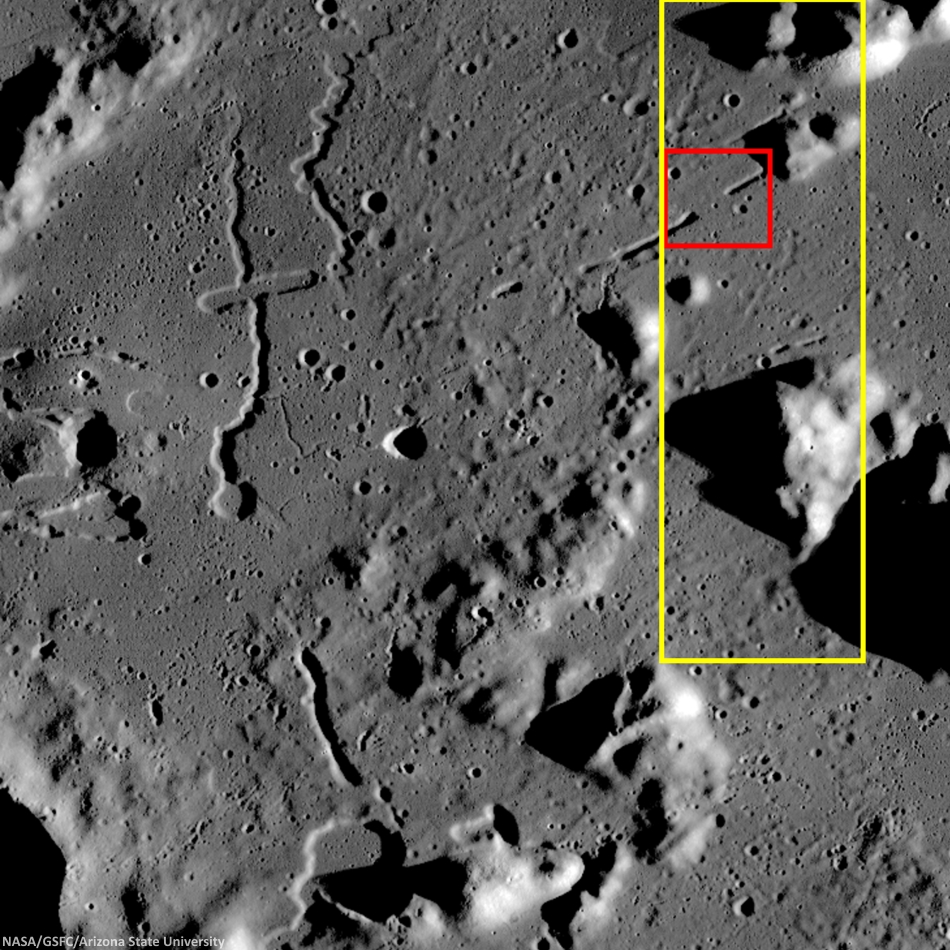
Two collapsed segments of a lava tube run from the southwest to the northeast, in the Rimae Prinz-Harbinger mountain region of Oceanus Procellarum (27.46°N, 318.33°E). These collapsed segments may provide access to the subsurface, which has never been directly sampled. The average width of the collapsed segments is ~650 meters. The lava tube is ~50 meters deep, seen in this 7 km-wide field of view from a mosaic of unreleased 2014 LROC NAC observation M1165080128 (L&R) [NASA/GSFC/Arizona State University].
H. Meyer
LROC News System

A lava tube is a volcanic conduit through which lava travels beneath the hardened crust of a lava flow. The presence of lava tubes on the Moon and beyond are inferred based on observations of terrestrial lava tubes, such as those found in Hawaii. Oftentimes, a rille suddenly disappears only to reappear a short distance away.

These are called discontinuous rilles and are thought to be areas where a lava tube collapsed. Collapsed lava tube segments may provide access to the subsurface, which is exciting as a possible site to collect rock samples that remain unaltered due to surface weathering (radiation, thermal cycling, micrometeorite bombardment).

Slightly differing, slightly lower resolution, 11.5 x 15.9 km field of view of the area of interest from a mosaic of LROC Narrow Angle Camera (NAC) observation M1152143995RL, LRO orbit 21776, April 14, 2014; resolution averages 1.33 meters per pixel, incidence angle 48.9° from 132.14 km over 26.86°N, 318.11°E. View the original 8706 x 12008 and an assortment of other sizes HERE [NASA/GSFC/Arizona State University].
Sunrise over Mons Harbinger. 65 km-wide field of view from mosaic of three LROC Wide Angle Camera (WAC) monochrome (604 nm) observations, swept up during three sequential orbital passes, December 7, 2011,  from 43 km; resolution 58 meters per pixel, incidence 77° [NASA/GSFC/Arizona State University].
Context for LROC Featured Image released November 6, 2014, field of view in red, full field swept up in LROC NAC observations M1152143995R & L in yellow. LROC WAC mosaic [NASA/GSFC/Arizona State University].
The lava tube from the LROC Featured Image released November 5, 2014 is located to the west of Montes Harbinger, a large kipuka in Oceanus Procellarum, and to the east of the Rimae Prinz region.

The Rimae Prinz region displays exquisite sinuous rilles as well as other elongate depressions, indicating that there could be other lava tubes in the area.

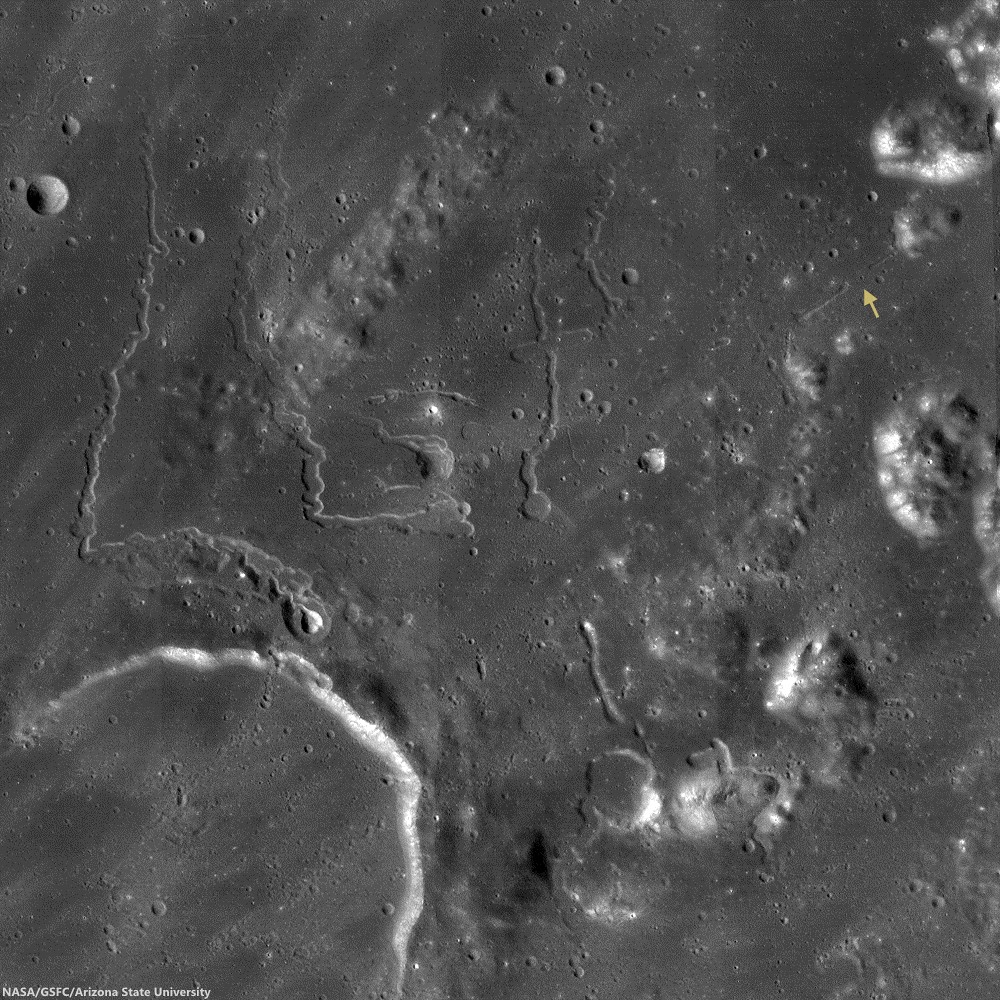
The Prinz, Rimae Prinz and Vera vent region, east of Aristarchus Plateau. The area of interest is marked with a yellow arrow, upper right in this roughly 120 km square field of view from the LROC WAC 100m global mosaic. the Vera vent 'cobra head' of Rima Prinz I rille (on the north-northeast rim of basalt-inundated Prinz crater, at lower left), is the subject of intense study (see HERE). [NASA/GSFC/Arizona State University].
The entire region, pictured above, is of interest for exploration for several reasons. The diversity of volcanic landforms in the area can tell scientists much about the volcanic history of the Moon. By collecting samples from the surface and subsurface in this region and by careful mapping on-site, scientists can better characterize the diverse basaltic lava flows in terms of both age and composition, which also helps us understand the timing and evolution of lunar volcanism and possible heterogeneities in the lunar mantle. Any time a sample is taken from a site on the Moon and age-dated, it can also be used to calibrate crater densities that are currently used to remotely age-date surfaces in the absence of direct sampling (both on the Moon and other planets).

Lava tubes are of particular interest in terms of human exploration because they are not only scientifically valuable, but they might also provide shielding from the radiation that poses a hazard to future explorers. Furthermore, the region surrounding the lava tube from this Featured Image also hosts large pyroclastic deposits, which are a potential in situ resource that will be critical to sustaining a human presence on the Moon.

Scientists and engineers are looking into the possibility of using the natural structure of the lava tube and associated resources (ISRU) to our advantage to construct habitats for explorers.

Explore the full NAC mosaic here! How many features of interest do you see?

Rimae Prinze Region - Constellation ROI
Discontiguous Rilles

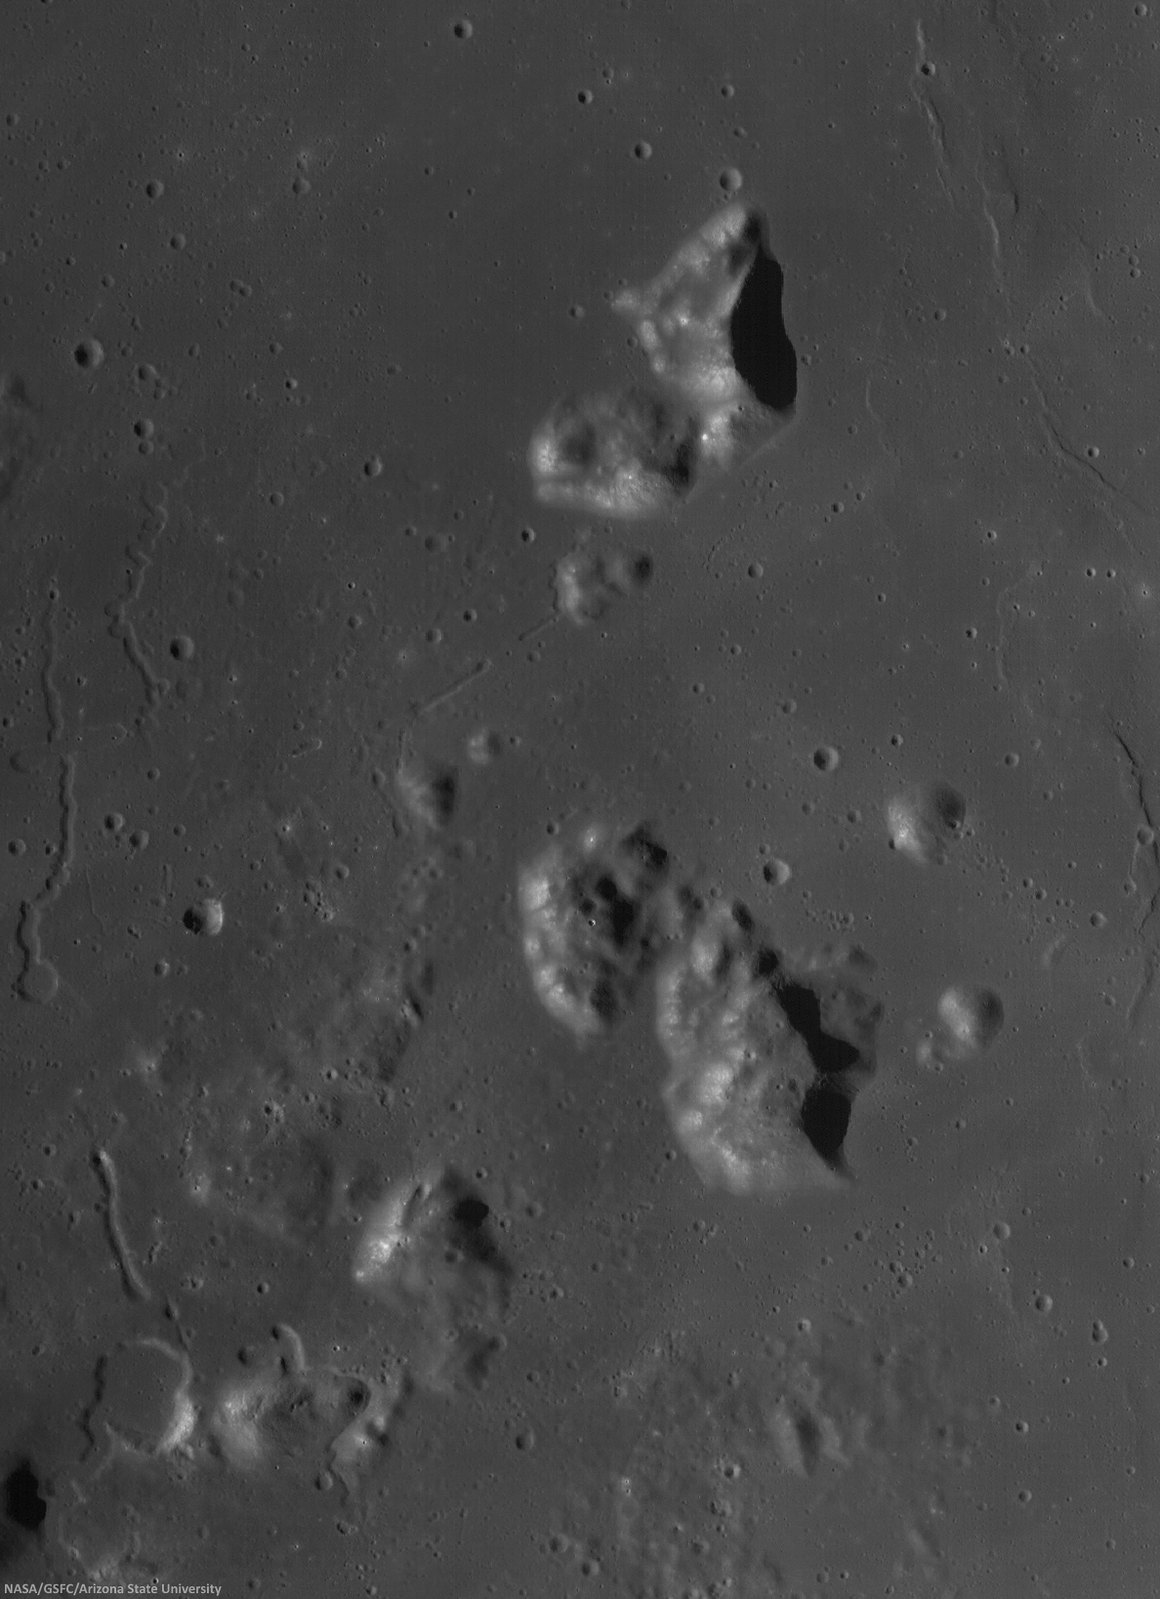
Addendum: Under mid to late afternoon sunlight, another LROC WAC mosaic, swept up under conditions remarkably similar in scale with the third image from above, from the same period of low altitude opportunities the LRO mission afforded during orbital maneuvers in the second half of 2011. Differing sun-moon-spacecraft phase angles allows for an excellent comparison. This particular mosaic was also assembled from LROC WAC observations, but five months earlier, and from three sequential orbital passes, at 43 km altitude. The resolution is 59 meters, incidence angle 64° [NASA/GSFC/Arizona State University].

Wednesday, October 29, 2014

LADEE impact crater found

LADEE impact site on the eastern rim of Sundman V crater, the spacecraft was heading west when it impacted the surface. The image was created by ratioing two images, one taken before the impact and another after the impact. The bright area shows the impact point and the ejecta (things that have changed between the time of the two images). The ejecta form a V shaped pattern extending to the northwest from the impact point. Ratio constructed with LROC images M1163066820RE and M1101816767RE [NASA/GSFC/Arizona State University].
Mark Robinson
Principal Investigator
Lunar Reconnaissance Orbiter Camera (LROC)
Arizona State University

The Lunar Atmosphere and Dust Environment Explorer (LADEE) was launched from Wallops Island on 6 September 2013 at 11:27 EDT and was visible over much of the eastern coast of the United States. The spacecraft was 2.37 m (7.8 ft) high and 1.85 m (6.1 ft) wide with a mass of 383 kg (844 lb) including the fuel.

After expending most of its fuel during its successful exploration of the Moon the spacecraft had a mass of about only 248 kg (547 lb) when it impacted the surface.

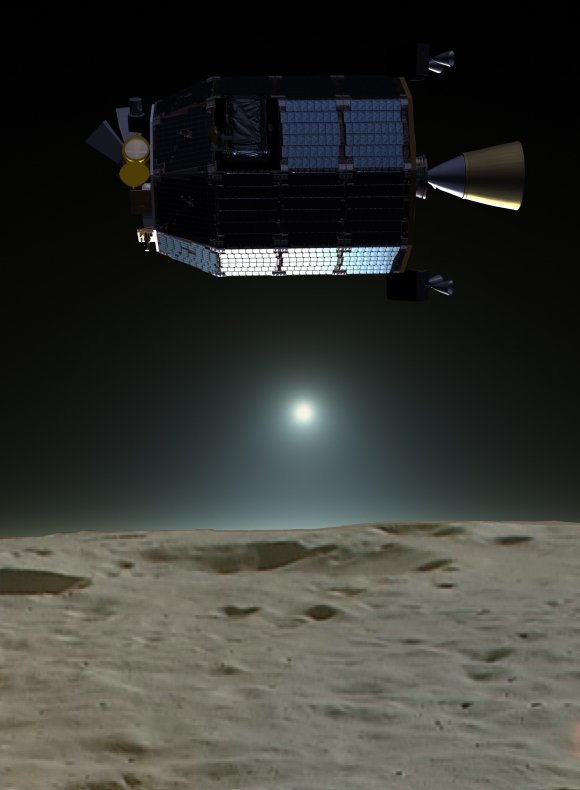
Artist's rendition of the LADEE spacecraft in orbit around the Moon [NASA/JAXA/LP].
Originally LADEE was placed into a retrograde, near-equatorial orbit to study the Moon's surface bound exosphere and dust environment. Since the Apollo era of exploration several conflicting ideas and observations concerning the existence (or not) of near-surface and high altitude dust were debated, and thus one of LADEE’s key science goals was to search for dust particles high above the surface (no dust was found).

LADEE's engines were fired on 11 April 2014 to adjust the orbit in such a way as to guarantee a farside impact if the spacecraft did not survive the 15 April 2014 eclipse. There was a small worry that if the spacecraft failed during the eclipse and was uncontrollable, it might impact near one of the Apollo sites. Over the subsequent 7 days, the low point in LADEE's orbit decreased resulting in an impact on 18 April 2014.

Before and after images of the LADEE impact site [NASA/GSFC/Arizona State University].
As it passed over the western limb as seen from the Earth, the spacecraft impacted the eastern rim of Sundman V crater (11.85°N, 266.75°E). The impact site (11.8494°N, 266.7507°E) is about 780 m from the crater rim with an altitude of about 2590 m, and was only about 295 meters north of its originally predicted location (based on tracking data).

Like the LADEE spacecraft, the impact crater is small, greater than 3 meters in diameter, barely resolvable by the LROC NAC. Based on impact models, a crater of only about 1.8 m (6 ft) diameter is expected. The crater is very small because, as impacts go, LADEE had a low mass and a low density (0.43 g / cm3 vs. larger than 3.0 g / cm3 for an ordinary chondrite meteorite), and was traveling at only a tenth the speed (1699 m/sec - 3800 mph) of an average asteroid.

LADEE impact crater (centered of image) has a distinctive hour-glass albedo pattern indicative of low angle impacts. Bright material extends to the northwest, while only a minor amount was ejected to the southeast; NAC M1163066820RE [NASA/GSFC/Arizona State University].
Because it is so small, the crater is hard to identify among the myriad of small fresh craters that dot the lunar surface. However, as images had been acquired of the impact region before the impact occurred, they could be compared with images acquired after the impact to identify the crater.

Since NAC images are so large (250 megapixels) and the new crater is so small the LROC team coregistered the before and after images (called a temporal pair) and then divided the after image by the before image. In this manner any changes to the surface stick out like a beacon! For the LADEE crater the ejecta forms a triangular pattern primarily downrange (to the west) extending more than 200 meters from the impact site. There is also a small triangular area of ejecta uprange but it extends only about 20-30 meters. The ejecta pattern is oriented WNW consistent with the direction the spacecraft was traveling when it impacted.

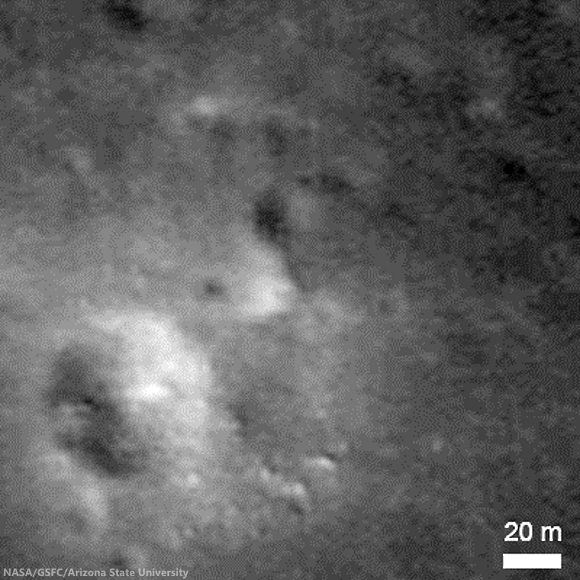
Zoomed-in view of the impact site, image is 200 m across, NAC M1163066820RE [NASA/GSFC/Arizona State University].
Explore the catalog of LROC close-ups of lunar spacecraft landing and impact sites, HERE.

Related LADEE Posts:
First Science from LADEE (45th LPSC, March 18 2014)
LADEE's (star tracker) images of the Moon (February 14, 2014)
LADEE economy adds 28 days to mission (February 5, 2014)
LROC captures LADEE from 9,000 meters (January 30, 2014)
Red Moon, Blue Moon Dwayne DayThe Space Review (December 3, 2013)
LADEE begins collecting data (November 22, 2013)
LADEE transitioning out of commissioning phase (November 6, 2013)
Apollo 12 ALSEP first to measure dust accumulation (November 21, 2013)
Chang'e-3 & LADEE: The Role of Serendipity (October 31, 2013)
LADEE LLCD sets new data record (October 25, 2013)
Measuring almost nothing, looking for the almost invisible (October 16, 2013)
LADEE legacies (September 7, 2013)
LADEE Prelaunch Mission Briefing (September 6, 2013)
ESA prepares for LADEE (July 31, 2013)
LADEE arrives at Wallops Island (June 5, 2013)
LADEE ready to baseline dusty lunar exosphere (June 5, 2013)
First laser comm system ready for launch on LADEE (March 16, 2013)
LADEE project manager update (February 6, 2013)
The Mona Lisa test for LADEE communications (January 21, 2013)
Toxicity of lunar dust (July 2, 2012)
Expectations for the LADEE LDEX (March 23, 2012)
The Dust Management Project (August 9, 2010)
LADEE architecture and mission design (July 6, 2010)
DesertRatS testing electrodynamic dust shield (July 5, 2010)
Dust transport and its importance in the origin of lunar swirls (February 21, 2010)
Dust accumulation on Apollo laser reflectors may indicate a surprisingly fast and
more dynamic lunar exosphere
 (February 16, 2010)
NASA applies low cost lessons to LADEE (January 18, 2010)
Nanotech advances in lunar dust mitigation (August 19, 2009)
Moon dust hazard influenced by Sun's elevation (April 17, 2009)
LADEE launch by Orbital from Wallops Island (April 14, 2009)
Understanding the activation and solution properties of lunar dust
for future lunar habitation
 (March 2, 2009)
Respiratory toxicity of lunar highland dust (January 19, 2009)
Toxicological effects of moon dust (June 25, 2008)
Moon dust and duct tape (April 22, 2008)

Monday, October 13, 2014

LRO: widespread evidence of young lunar volcanism

The feature called Maskelyne is one of many newly discovered young volcanic deposits on the Moon. Called irregular mare patches, these areas are thought to be remnants of small basaltic eruptions that occurred much later than the commonly accepted end of lunar volcanism, 1 to 1.5 billion years ago [NASA/GSFC/Arizona State University].
Dwayne Brown
NASA HQ

NASA’s Lunar Reconnaissance Orbiter (LRO) has provided researchers strong evidence the moon’s volcanic activity slowed gradually instead of stopping abruptly a billion years ago.

Scores of distinctive rock deposits observed by LRO are estimated to be less than 100 million years old. This time period corresponds to Earth’s Cretaceous period, the heyday of dinosaurs. Some areas may be less than 50 million years old. Details of the study are published online in Sunday’s edition of Nature Geoscience.

“This finding is the kind of science that is literally going to make geologists rewrite the textbooks about the moon,” said John Keller, LRO project scientist at NASA’s Goddard Space Flight Center in Greenbelt, Maryland.

The deposits are scattered across the moon’s dark volcanic plains and are characterized by a mixture of smooth, rounded, shallow mounds next to patches of rough, blocky terrain. Because of this combination of textures, the researchers refer to these unusual areas as irregular mare patches.

The features are too small to be seen from Earth, averaging less than a third of a mile (500 meters) across in their largest dimension. One of the largest, a well-studied area called Ina, was imaged from lunar orbit by Apollo 15 astronauts.

Ina appeared to be a one-of-a-kind feature until researchers from Arizona State University in Tempe and Westfälische Wilhelms-Universität Münster in Germany spotted many similar regions in high-resolution images taken by the two Narrow Angle Cameras that are part of the Lunar Reconnaissance Orbiter Camera, or LROC. The team identified a total of 70 irregular mare patches on the near side of the moon.

The large number of these features and their wide distribution strongly suggest that late-stage volcanic activity was not an anomaly but an important part of the moon's geologic history.

The numbers and sizes of the craters within these areas indicate the deposits are relatively recent. Based on a technique that links such crater measurements to the ages of Apollo and Luna samples, three of the irregular mare patches are thought to be less than 100 million years old, and perhaps less than 50 million years old in the case of Ina. The steep slopes leading down from the smooth rock layers to the rough terrain are consistent with the young age estimates.

In contrast, the volcanic plains surrounding these distinctive regions are attributed to volcanic activity that started about 3 1/2 billion years ago and ended roughly 1 billion years ago. At that point, all volcanic activity on the moon was thought to cease.

Several earlier studies suggested that Ina was quite young and might have formed due to localized volcanic activity. However, in the absence of other similar features, Ina was not considered an indication of widespread volcanism.

The findings have major implications for how warm the moon’s interior is thought to be.

An oblique, novel view of the Ina formation (3 km across, 18.65°N, 5.3°E) from the LROC narrow angle camera (resolution 2.5 meters per pixel [NASA/GSFC/Arizona State University].
“The existence and age of the irregular mare patches tell us that the lunar mantle had to remain hot enough to provide magma for the small-volume eruptions that created these unusual young features,” said Sarah Braden, a recent Arizona State University graduate and the lead author of the study.

The new information is hard to reconcile with what currently is thought about the temperature of the interior of the moon.

“These young volcanic features are prime targets for future exploration, both robotic and human,” said Mark Robinson, LROC principal investigator at Arizona State University.

LRO is managed by Goddard for NASA’s Science Mission Directorate at NASA Headquarters in Washington. LROC, a system of three cameras, was designed and built by Malin Space Science Systems and is operated by Arizona State University.
To access the complete collection of LROC images, visit http://lroc.sese.asu.edu/

For more information about LRO, visit http://www.nasa.gov/lro

Some Related Posts:
Hansteen α -   January 15, 2014
Small-scale volcanism on the lunar mare, July 13, 2013
Unassuming volcanic vent north of Aristarchus Plateau, April 1, 2013
New views of the hollows of Rimae Sosigenes, March 28, 2013
Inside Rima Hyginus, June 12, 2012
Ina of the Meniscus Hollows, March 21, 2012
LUNAR MENISCUS HOLLOWS. P. J. Stooke, Department of Geography and Centre for Planetary Science and Exploration, University of Western Ontario, London, Ontario, Canada; 43rd Lunar and Planetary Science Conference (2012), #1011.
Whale of a Hollow, March 20, 2012
It's a gas, man, Paul Spudis, Smithsonian Air & Space, October 6, 2011