Showing posts with label Mark Robinson. Show all posts

Sunday, February 1, 2015

LROC detects 26000 changes to lunar surface since '09

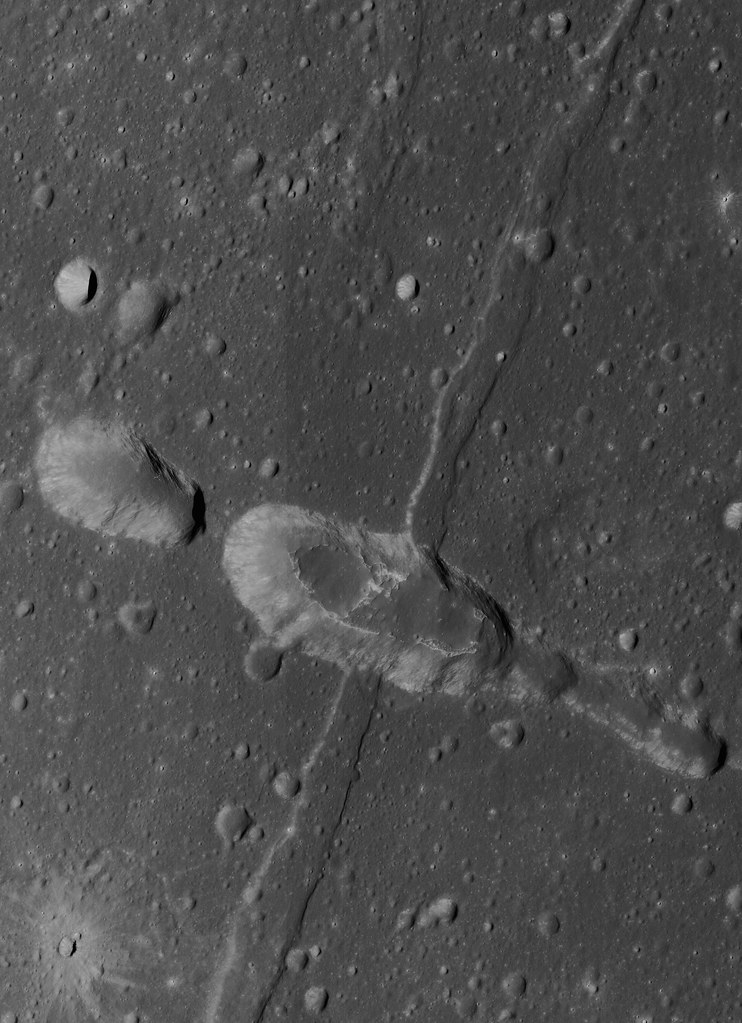
Close look at south wall of the Copernican age crater Fetchner T (14.33 km; 58.74°S, 122.82°E), a 2.3 km-wide field of view from LROC NAC observation M113148900R, LRO orbit 1808, November 18, 2009; incidence 67.98° at 64 cm resolution, from 61.71 km above 58.84°S, 122.02°E. Polar orbital tracks converge nearer together, allowing more frequent re-imaging  and opportunities to detect changes to the landscape [NASA/GSFC/Arizona State University]. 
DYNAMIC MOON REVEALED WITH HIGH RESOLUTION TEMPORAL IMAGING

46th Lunar and Planetary Science Conference, #2325
Speyerer and Robinson, Povilaitis and Wagner
School of Earth and Space Exploration
Arizona State University

Introduction: The Lunar Reconnaissance Orbiter Camera (LROC) began systematically mapping the Moon in the summer of 2009 with the goal of acquiring an image dataset to facilitate future exploration [1]. With the aid of the extended science mission, we have discovered hundreds of new impact craters, thousands of smaller probable secondaries, and evidence of recent crater modification using repeat observations with the high resolution Narrow Angle Camera (NAC) and a custom change detection program.

Temporal Dataset: As of 1 January 2015, LROC has acquired nearly a million NAC images of illuminated terrain. From this total, nearly 10,000 are images acquired of regions of the Moon where previous NAC observations with similar lighting and observational geometry exist (i.e. incidence angle difference more than 3°, incidence angle greater than 50°, and nadir pointing).

These before and after image pairs, called temporal pairs, enable the search for a range of surface changes, including new impact craters, formed between the time the first and second image were acquired; individual temporal pairs currently span between 176 to 1241 Earth days.

Change Detection: Since a single NAC temporal pair can contain up to 1.09 billion pixels, manual scanning of thousands of temporal pairs is impractical. However, 131 images were manually scanned and 657 surface changes were identified [2] providing a baseline for the automated change detection algorithm.

We developed an automated change detection program that identifies and crops out suspected changes from each temporal pair. Thumbnails of these candidate areas are extracted and manually classified using a custom web interface. Of the 46,057 automatically identified surface changes recorded to date, manual inspection confirmed that over half (56%) are indeed changes to the surface.

This semi-automated procedure reduces the human time required to inspect a temporal pair by over a factor of 200.

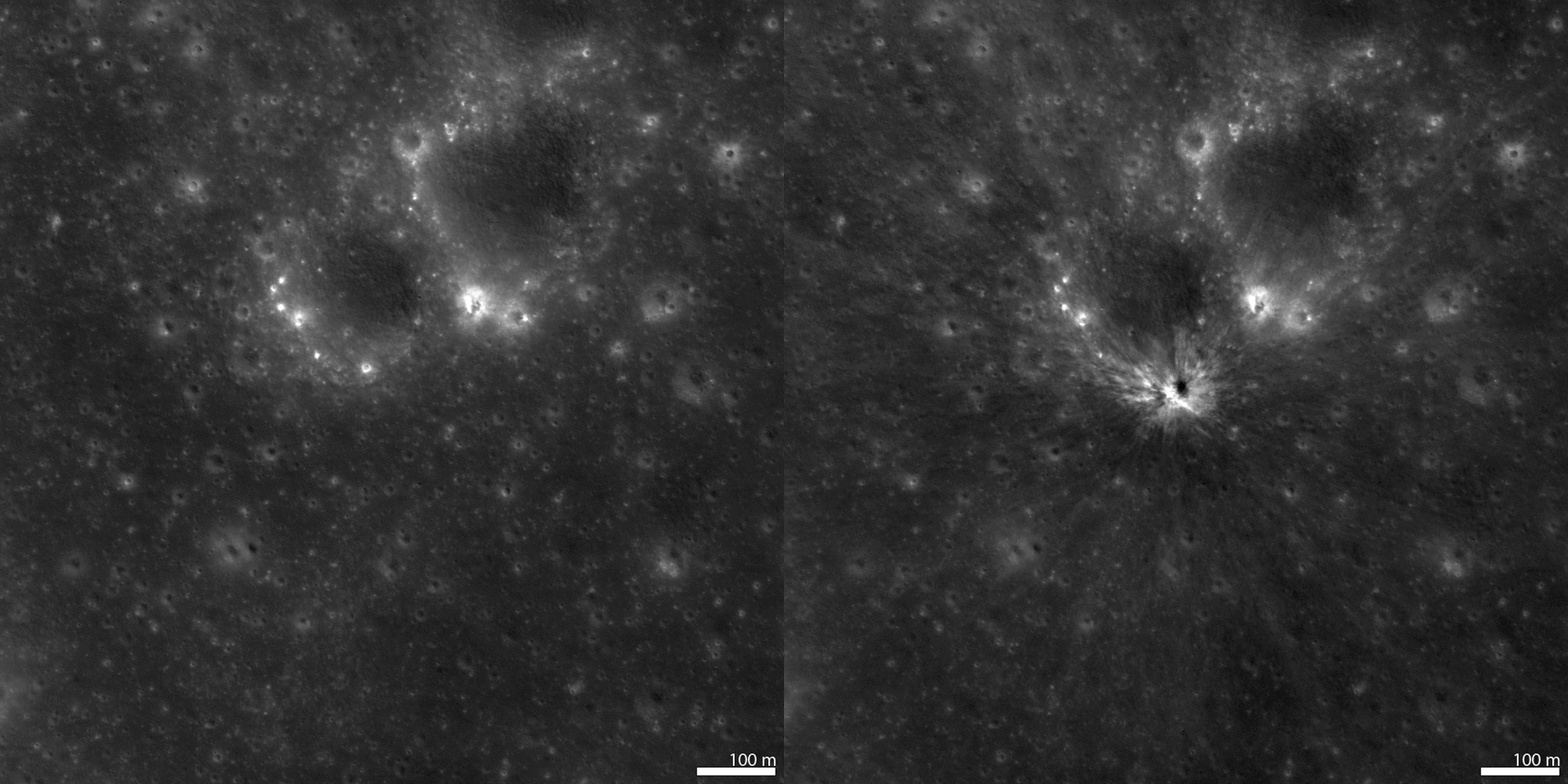
New Impact Craters and Secondaries: From the temporal pairs scanned to date (1 January 2015), we identified 225 new resolved impact craters (e.g. Fig. 1). These craters range in diameter from 1.5 meters to 43 meters and are distributed across the surface over a variety of terrain types (Fig. 2; red dots). In addition, targeted NAC observations imaged 18 and 34 meter diameter craters where impact flashes were observed on 17 March 2013 and 11 September 2013 respectively (Fig. 2; blue dots).

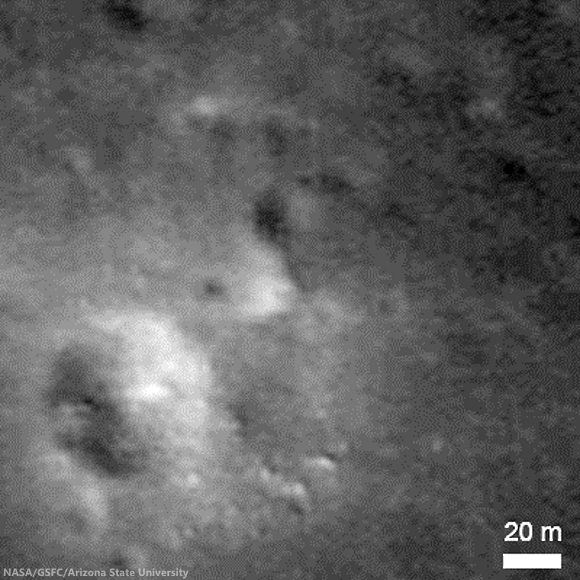
Fig. 1: Before (left) and after (right) images of a new 18 meter impact crater discovered by automatically scanning NAC temporal pairs.
We also identified nearly 26,000 other surface changes that do not exhibit visible crater rims but only a change in surface reflectance. These include high reflectance changes (i.e. increase in surface reflectance), low reflectance changes, as well as mixed reflectance changes (Fig. 3).

Fig. 2: Location of new impact craters overlaid on a LROC Wide Angle Camera basemap (Latitude Range: 55°N to 55°S, Longitude Range 180°E to 180°E). The red dots indicate the location of the 225 new impact craters discovered to date with NAC temporal pairs and the blue dots show the location of the two craters located with the help of Earthbased impact flash observations [3,4].
These changes are thought to be the result of small primary events in which the resulting impact crater is smaller than the resolution limit of the temporal pair or by a secondary disturbance caused by a nearby primary event. In several cases, these surface changes show clear directional indicators pointing back to a larger primary crater [3] confirming their origin as secondary craters.

Fig. 3: Example of low (left column) and high (right column) reflectance changes identified with NAC temporal pairs. The top row consists of a pair of before images, the middle row is a pair of after images, and the bottom row is a ratio of the after/before observation. Each image field of view is 250 meters across.
Crater Modification: Temporal pairs also revealed seven new landslide events inside Copernican age impact craters (Fig. 4). Several of these landslides are the result of small impact events occurring on steep (slopes over 30°) crater walls.

These landslides typically show boulder trails extending from the new impact crater and tracing a path toward the crater floor and occasionally growing in width as a result of the falling block dislodging material along the steep surface. One such event caused material to travel over 4 km to the floor of the larger parent crater.

In addition, we discovered new landslides that lack any indicator of emanating from a new impact crater. These landslides exhibit a much broader surface change (greater than 100 meters wide flows instead of narrow boulder tracks witnessed with the previously described landslides). We speculate that these may be the result of a seismic event such as a Moonquake or a large distant meteor impact disrupting regolith poised near the angle of repose and causing the loosened regolith to cascade down to the crater floor.

Fig. 4: Example of two temporal ratio images (after/before) showing recent landslide events. The image on the left shows a 250 meter-wide field of view, boulder trails extending down slope from a new impact crater. At right is 600 meter-wide view showing a larger landslide with no indication it results from an impact on the wall of the parent crater. In each example, the elevation depicted decreases from the top to the bottom.
Summary: As of 1 January 2015, we have scanned and classified changes in 8300 NAC temporal pairs using our automated change detection tool leading to the discovery of 225 impact craters ranging in size from 1.5 to 43 m. In addition, we also identified thousands of other surface changes, including:

- 23,458 low reflectance changes
- 1,911 high reflectance changes
- 468 mixed reflectance changes
- 1 Chinese lander/rover

Throughout the second extended science mission, the LROC team will continue to acquire and scan high resolution temporal pairs. From this new dataset we plan to refine estimates on the flux of small (less than 0.5 meter) bolides in the inner solar system as well as quantify secondary impact-related hazards on the Moon, which is not only an important scientific finding but a key engineering design concern for future long duration surface assets.

References: [1] Robinson M.S. et al. Space Science Reviews, 150, 1-4, 81-124 (2010); [2] Thompson S.D. et al., Recent impacts on the Moon, 45th Lunar and Planetary Science Conference (2014), #2769; [3] New crater on the Moon and a field of secondaries, Robinson M.S. et al. 45th LPSC, (2014) #2164; [4] http://lroc.sese.asu.edu/posts/810.

Wednesday, October 29, 2014

LADEE impact crater found

LADEE impact site on the eastern rim of Sundman V crater, the spacecraft was heading west when it impacted the surface. The image was created by ratioing two images, one taken before the impact and another after the impact. The bright area shows the impact point and the ejecta (things that have changed between the time of the two images). The ejecta form a V shaped pattern extending to the northwest from the impact point. Ratio constructed with LROC images M1163066820RE and M1101816767RE [NASA/GSFC/Arizona State University].
Mark Robinson
Principal Investigator
Lunar Reconnaissance Orbiter Camera (LROC)
Arizona State University

The Lunar Atmosphere and Dust Environment Explorer (LADEE) was launched from Wallops Island on 6 September 2013 at 11:27 EDT and was visible over much of the eastern coast of the United States. The spacecraft was 2.37 m (7.8 ft) high and 1.85 m (6.1 ft) wide with a mass of 383 kg (844 lb) including the fuel.

After expending most of its fuel during its successful exploration of the Moon the spacecraft had a mass of about only 248 kg (547 lb) when it impacted the surface.

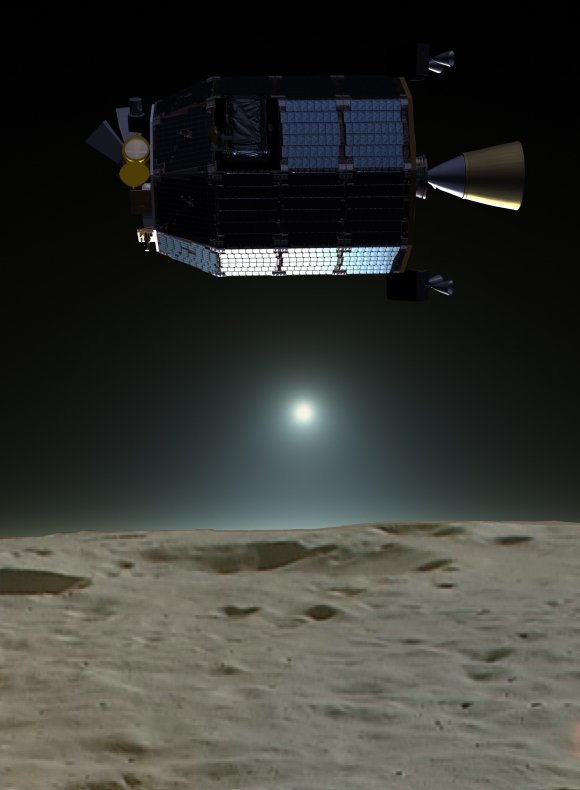
Artist's rendition of the LADEE spacecraft in orbit around the Moon [NASA/JAXA/LP].
Originally LADEE was placed into a retrograde, near-equatorial orbit to study the Moon's surface bound exosphere and dust environment. Since the Apollo era of exploration several conflicting ideas and observations concerning the existence (or not) of near-surface and high altitude dust were debated, and thus one of LADEE’s key science goals was to search for dust particles high above the surface (no dust was found).

LADEE's engines were fired on 11 April 2014 to adjust the orbit in such a way as to guarantee a farside impact if the spacecraft did not survive the 15 April 2014 eclipse. There was a small worry that if the spacecraft failed during the eclipse and was uncontrollable, it might impact near one of the Apollo sites. Over the subsequent 7 days, the low point in LADEE's orbit decreased resulting in an impact on 18 April 2014.

Before and after images of the LADEE impact site [NASA/GSFC/Arizona State University].
As it passed over the western limb as seen from the Earth, the spacecraft impacted the eastern rim of Sundman V crater (11.85°N, 266.75°E). The impact site (11.8494°N, 266.7507°E) is about 780 m from the crater rim with an altitude of about 2590 m, and was only about 295 meters north of its originally predicted location (based on tracking data).

Like the LADEE spacecraft, the impact crater is small, greater than 3 meters in diameter, barely resolvable by the LROC NAC. Based on impact models, a crater of only about 1.8 m (6 ft) diameter is expected. The crater is very small because, as impacts go, LADEE had a low mass and a low density (0.43 g / cm3 vs. larger than 3.0 g / cm3 for an ordinary chondrite meteorite), and was traveling at only a tenth the speed (1699 m/sec - 3800 mph) of an average asteroid.

LADEE impact crater (centered of image) has a distinctive hour-glass albedo pattern indicative of low angle impacts. Bright material extends to the northwest, while only a minor amount was ejected to the southeast; NAC M1163066820RE [NASA/GSFC/Arizona State University].
Because it is so small, the crater is hard to identify among the myriad of small fresh craters that dot the lunar surface. However, as images had been acquired of the impact region before the impact occurred, they could be compared with images acquired after the impact to identify the crater.

Since NAC images are so large (250 megapixels) and the new crater is so small the LROC team coregistered the before and after images (called a temporal pair) and then divided the after image by the before image. In this manner any changes to the surface stick out like a beacon! For the LADEE crater the ejecta forms a triangular pattern primarily downrange (to the west) extending more than 200 meters from the impact site. There is also a small triangular area of ejecta uprange but it extends only about 20-30 meters. The ejecta pattern is oriented WNW consistent with the direction the spacecraft was traveling when it impacted.

Zoomed-in view of the impact site, image is 200 m across, NAC M1163066820RE [NASA/GSFC/Arizona State University].
Explore the catalog of LROC close-ups of lunar spacecraft landing and impact sites, HERE.

Related LADEE Posts:
First Science from LADEE (45th LPSC, March 18 2014)
LADEE's (star tracker) images of the Moon (February 14, 2014)
LADEE economy adds 28 days to mission (February 5, 2014)
LROC captures LADEE from 9,000 meters (January 30, 2014)
Red Moon, Blue Moon Dwayne DayThe Space Review (December 3, 2013)
LADEE begins collecting data (November 22, 2013)
LADEE transitioning out of commissioning phase (November 6, 2013)
Apollo 12 ALSEP first to measure dust accumulation (November 21, 2013)
Chang'e-3 & LADEE: The Role of Serendipity (October 31, 2013)
LADEE LLCD sets new data record (October 25, 2013)
Measuring almost nothing, looking for the almost invisible (October 16, 2013)
LADEE legacies (September 7, 2013)
LADEE Prelaunch Mission Briefing (September 6, 2013)
ESA prepares for LADEE (July 31, 2013)
LADEE arrives at Wallops Island (June 5, 2013)
LADEE ready to baseline dusty lunar exosphere (June 5, 2013)
First laser comm system ready for launch on LADEE (March 16, 2013)
LADEE project manager update (February 6, 2013)
The Mona Lisa test for LADEE communications (January 21, 2013)
Toxicity of lunar dust (July 2, 2012)
Expectations for the LADEE LDEX (March 23, 2012)
The Dust Management Project (August 9, 2010)
LADEE architecture and mission design (July 6, 2010)
DesertRatS testing electrodynamic dust shield (July 5, 2010)
Dust transport and its importance in the origin of lunar swirls (February 21, 2010)
Dust accumulation on Apollo laser reflectors may indicate a surprisingly fast and
more dynamic lunar exosphere
 (February 16, 2010)
NASA applies low cost lessons to LADEE (January 18, 2010)
Nanotech advances in lunar dust mitigation (August 19, 2009)
Moon dust hazard influenced by Sun's elevation (April 17, 2009)
LADEE launch by Orbital from Wallops Island (April 14, 2009)
Understanding the activation and solution properties of lunar dust
for future lunar habitation
 (March 2, 2009)
Respiratory toxicity of lunar highland dust (January 19, 2009)
Toxicological effects of moon dust (June 25, 2008)
Moon dust and duct tape (April 22, 2008)

Sunday, October 12, 2014

New evidence for young lunar volcanism

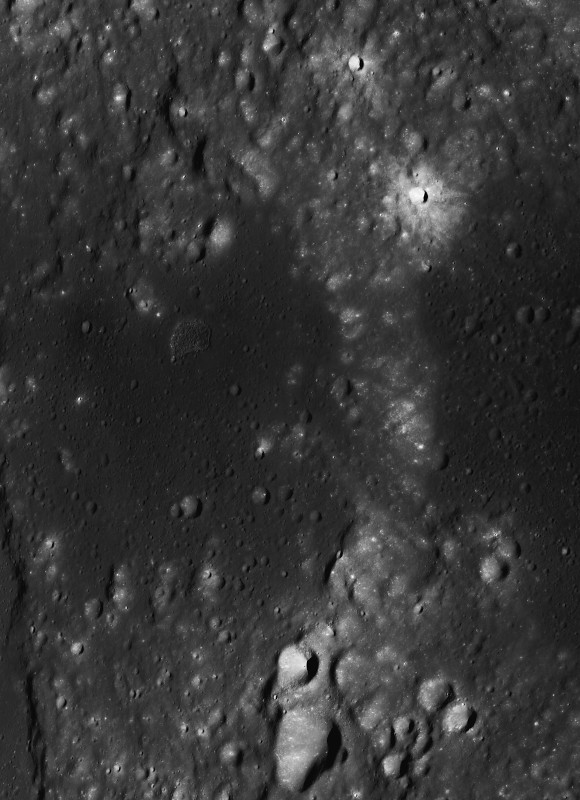
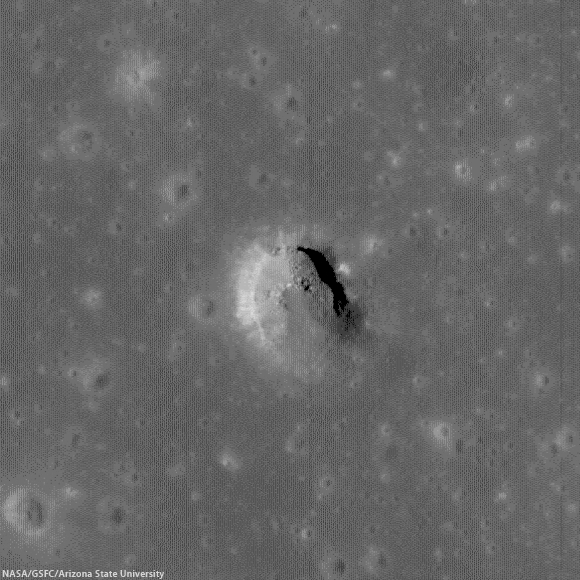
One of many newly-discovered young volcanic deposits on the Moon (4.330°N, 33.750°E), this example is near the crater Maskelyne, in south central Mare Tranquillitatis. Illustration from from "New evidence for young lunar volcanism," Mark Robinson, Oct. 12, 2014. LROC NAC observation M1123340138R, LRO orbit 17730, May 16, 2013; slew 3° from orbital nadir, incidence 66.55° resolution 1.04 meters from 102.5 km over 4.26°N, 33.97°E [NASA/GSFC/Arizona State University].
Mark Robinson
Principal Investigator
Lunar Reconnaissance Orbiter Camera (LROC)
Arizona State University

Many young volcanic deposits were recently identified in LROC NAC images. Their sharp nature and general lack of superposed impact craters greater than 20 meters in diameter indicate these deposits probably formed in the last 100 million years, perhaps even more recently than 50 million years ago. An amazing result!

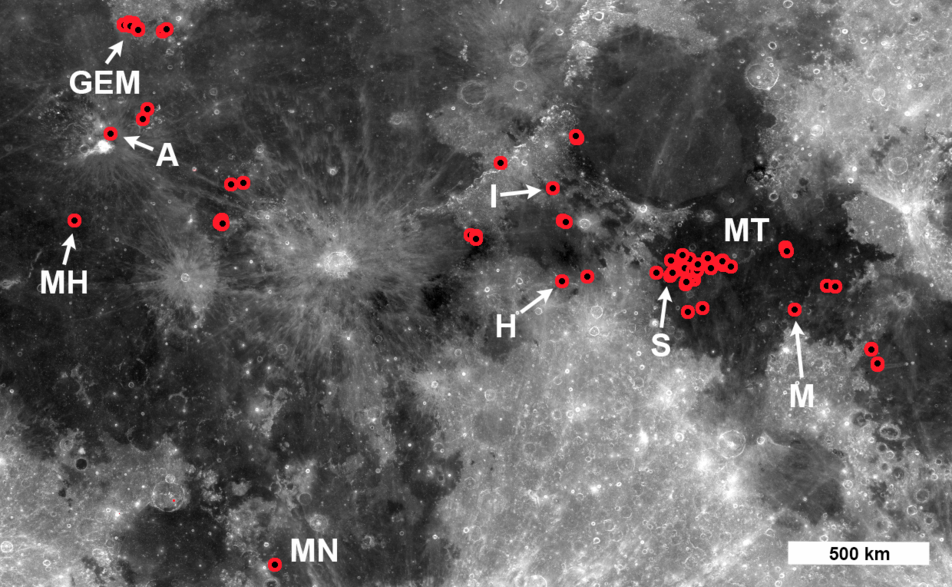
A new paper, (Evidence for basaltic volcanism on the Moon within the past 100 million years, Nature Geoscience 7, 787-791; 2014) presents 70 topographic anomalies, informally called Irregular Mare Patches, or IMPs, most of these occurrences were previously undocumented. The IMPs are thought to be remnants of small basaltic eruptions that formed significantly after the commonly accepted end of lunar volcanism (1 to 1.5 billion years ago).

Locations of IMPs. Red circles indicate either a single IMP greater than 100 meters in diameter, or a cluster of smaller IMPs. The area extends from 28.0° N to 40.6° N latitude and 58.0 ° E to 50.3° E longitude, LROC WAC 643nm mosaic. IMP labels: Aristarchus (A), Gruithuisen E-M region (GEM), Hyginus (H), Ina (I), Mare Nubium (MN),  Mare Tranquillitatis (MT), Marius Hills (MH), Maskelyne (M), Sosigenes (S) [NASA/GSFC/Arizona State University].
Pursuing a Decades-old Puzzle

The best-known IMP, called Ina (or Ina-D), was originally spotted in Apollo 15 orbital photography, and was unlike anything else previously discovered on the lunar surface. Beginning with Apollo era investigations, Ina was interpreted as a collapsed caldera at the summit of a low-shield volcano. Previous interpretations of impact crater densities within and around Ina suggested that this enigmatic landform was much younger than the surrounding mare basalt unit in Lacus Felicitatis (Lake of Happiness).

Not only does the NAC provide excellent resolution, but after 5 years of operation has covered well over 75% of the surface. This combination led to the discovery of many new IMPs in locations across the nearside of the Moon. Ina is not simply a one-off oddity – but rather a signature of volcanic processes that actually occurred in multiple places across the nearside.

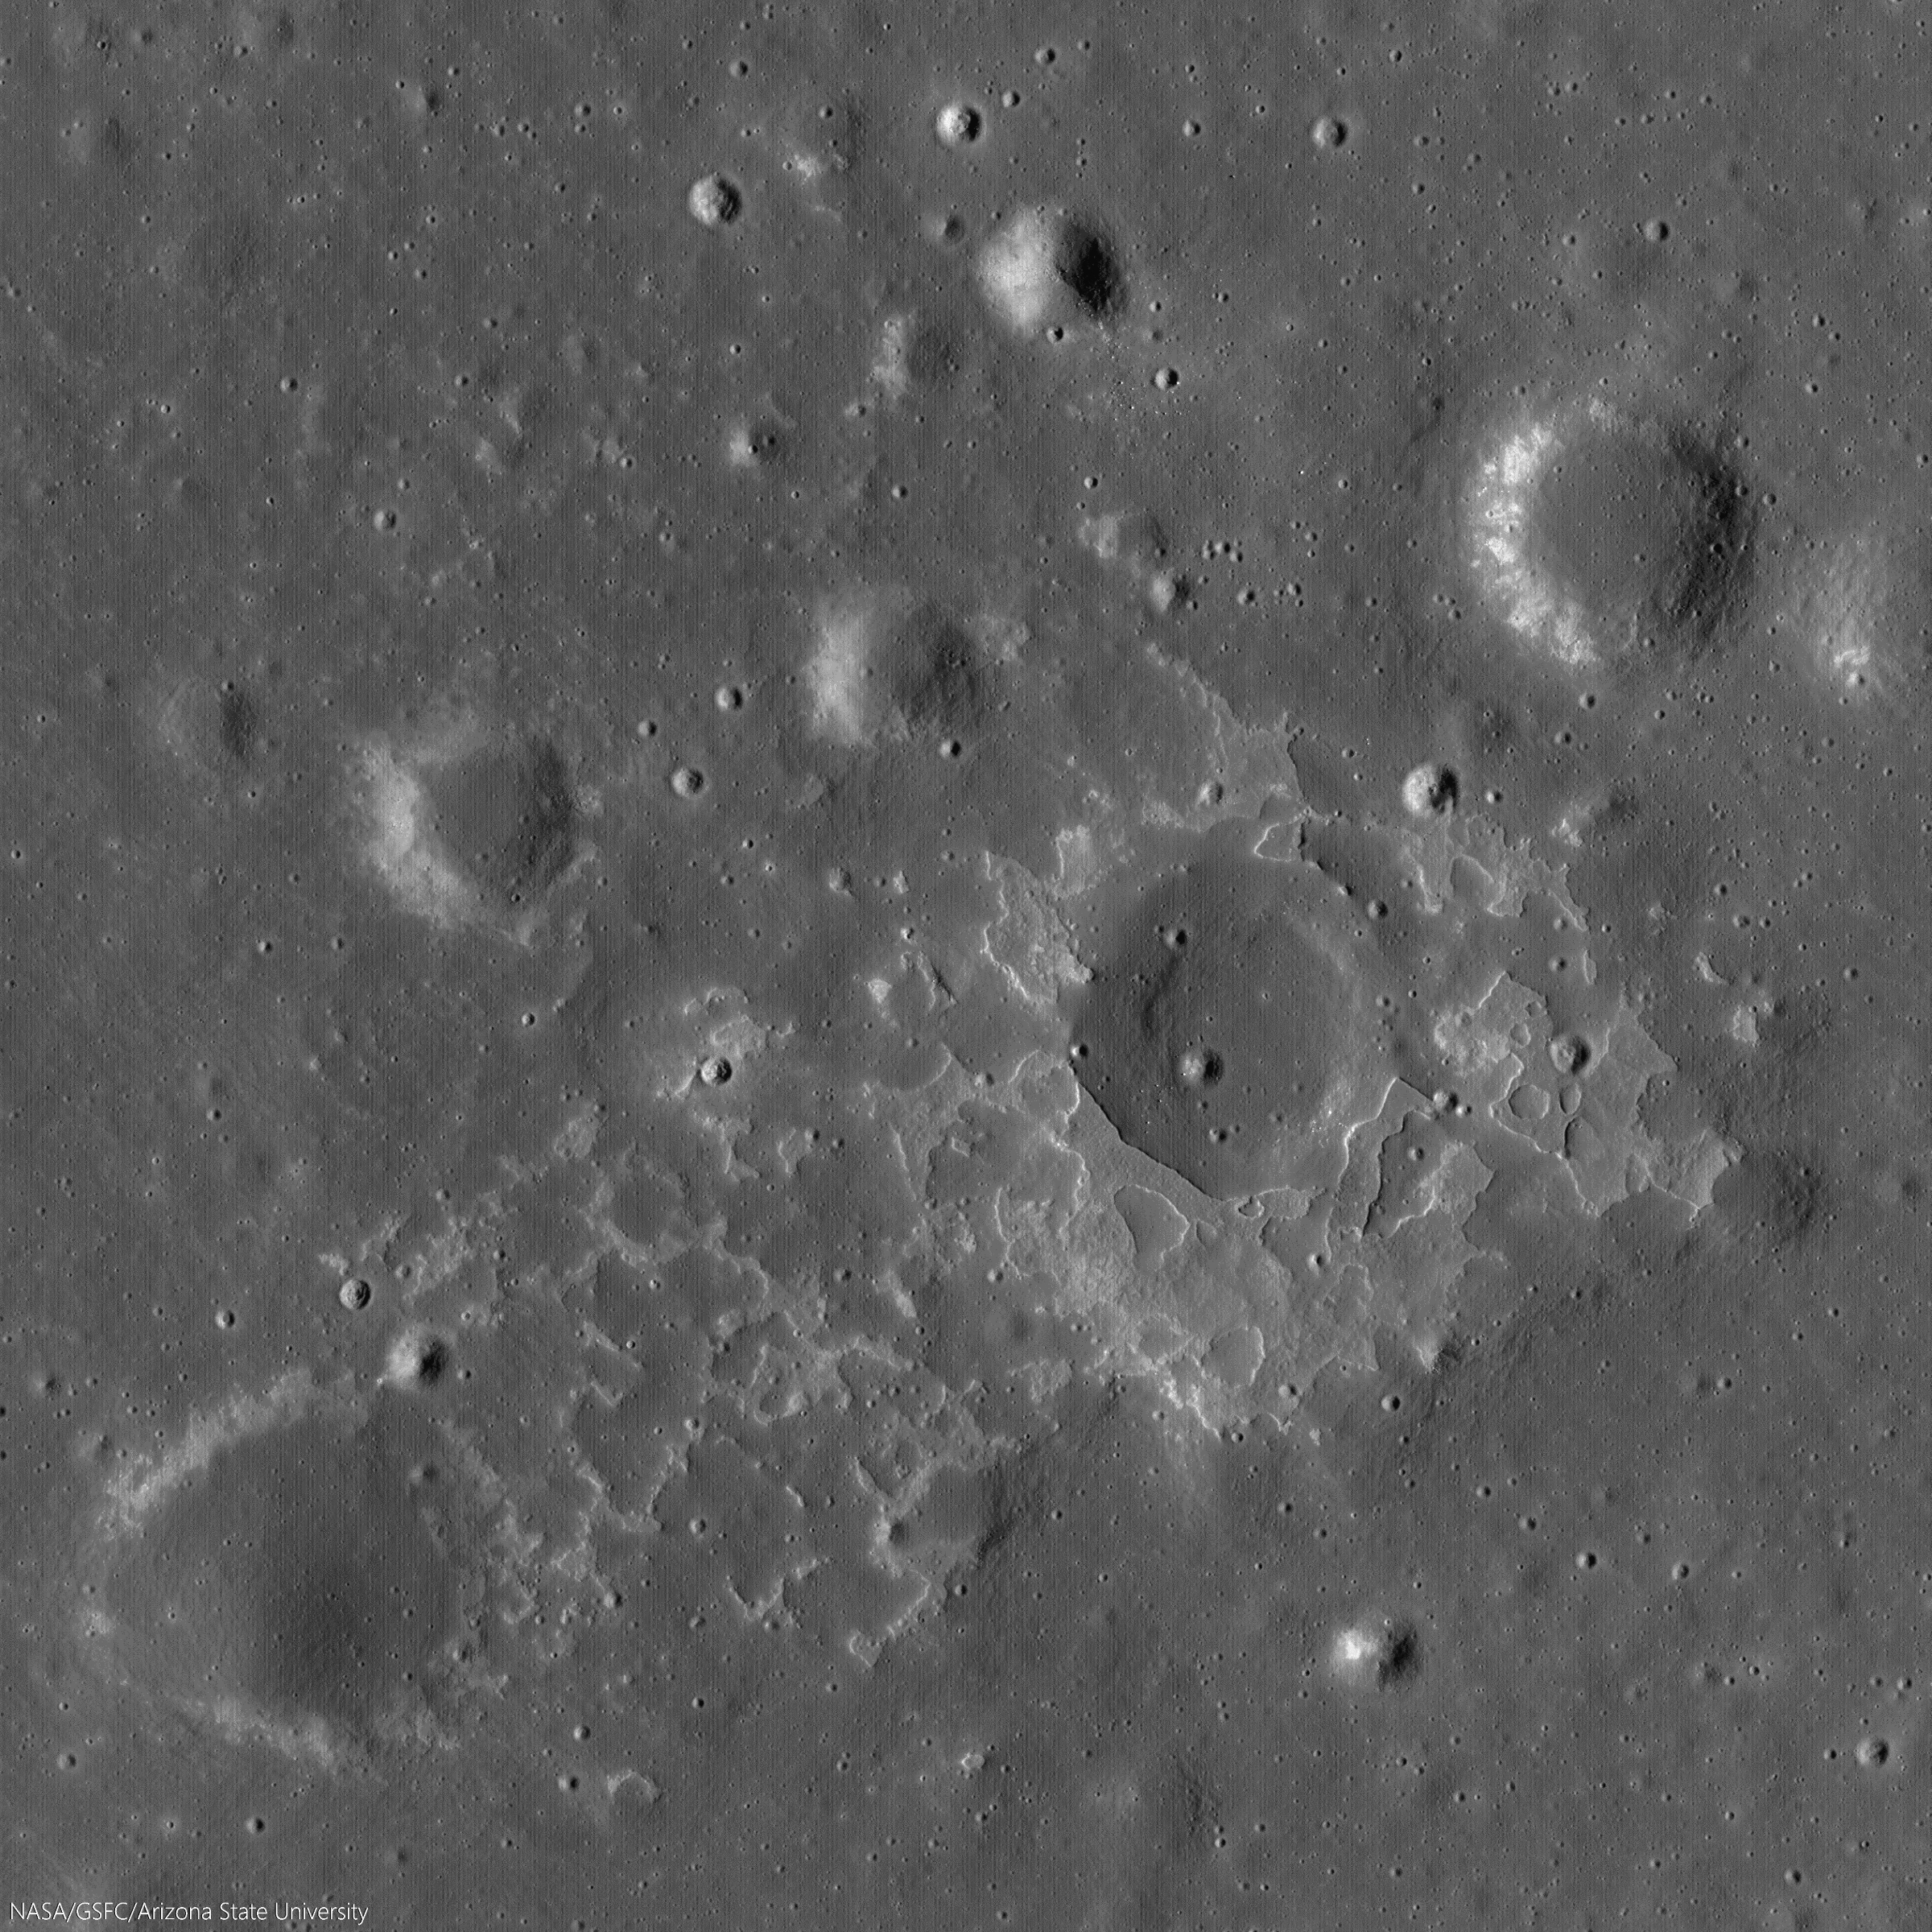
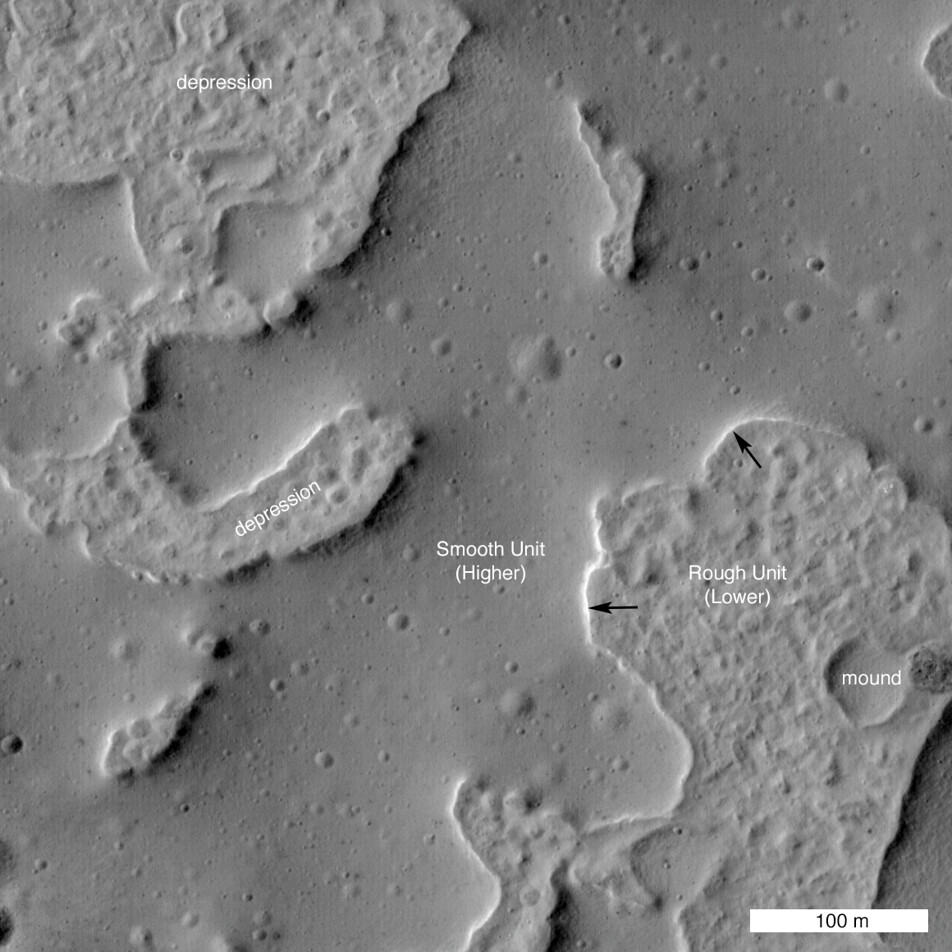
Close up of a small 464 meter wide section of the "IMP" familiarly known as Ina. This area is a great example of the difference between the rough and smooth units that make up the new family of IMP structures. The smooth unit is composed of mounds over the rougher units. The Sun is from the East, the black arrows show a Sun-facing cliff of one of the mounds. LROC NAC M175246029LR, LRO orbit 10960, November 6, 2011; 45.6° incidence, resolution 44 cm from 24.54 km over 18.91°N, 4.76°E [NASA/GSFC/Arizona State University].
New Discoveries

All of the lunar landforms identified as IMPs exhibit two distinct morphologies: smooth deposits, which are sometimes connected to the surrounding mare basalt, and uneven deposits (rough-looking) which usually end abruptly at the steep edges of the smooth deposit; it is likely that the smooth materials are covering portions of the rough material.

To estimate the age of IMPs the LROC team measured the sizes and numbers of impact craters on the smooth deposit surfaces (geologists use the crater size-frequency distribution (CSFD) as a metric for estimating the age of a surface). The resulting crater distributions from the three largest irregular mare patches imply ages younger than 100 million years. Indeed, the new crater counts confirmed that Ina is very young, perhaps as young as 33 million years.

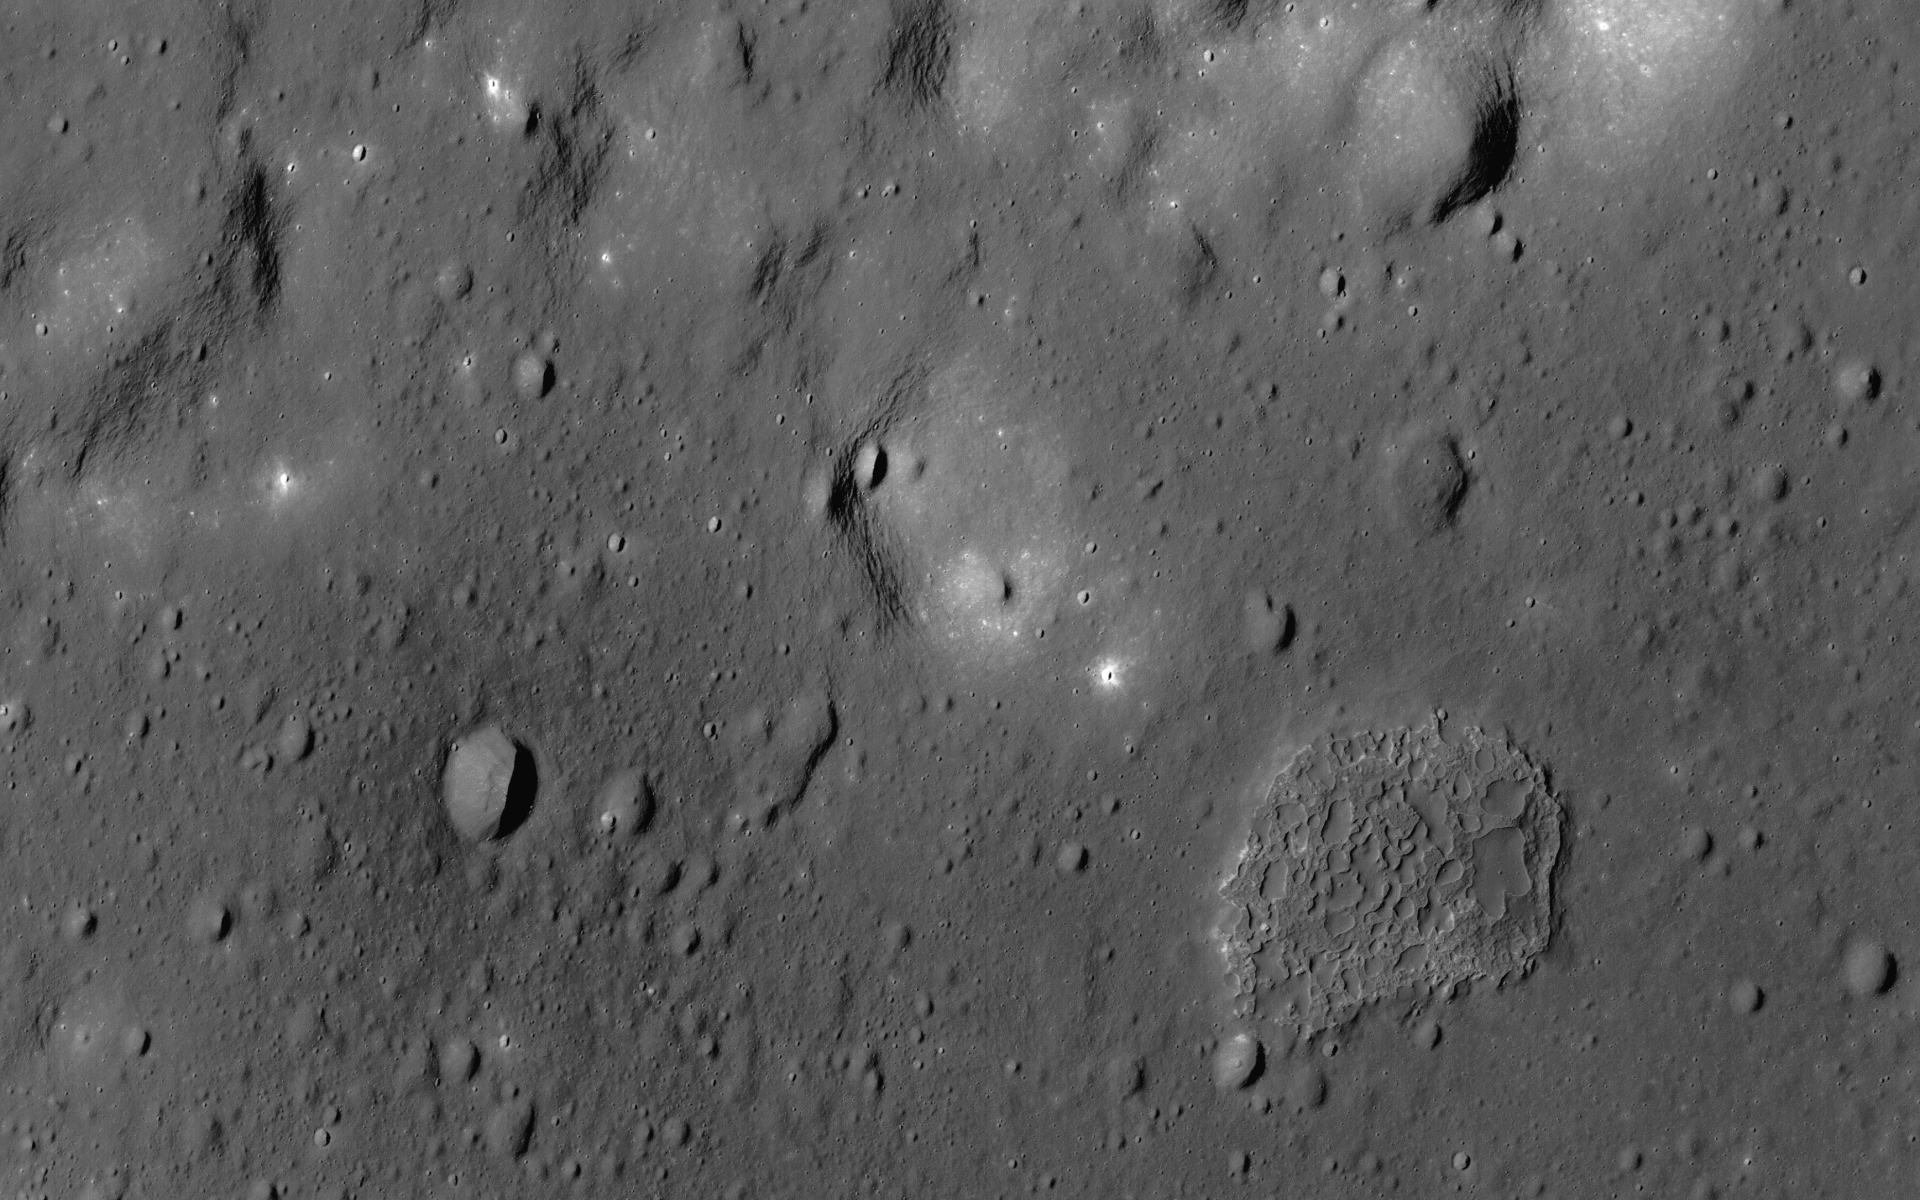
IMP north of Aristarchus crater (25.044°N, 313.233°E). Compelling evidence of the youth of this feature and its apparent origination from active processes within the Moon. As a matter of stratigraphy, the phenomena that caused this occurred after the formation of Aristarchus crater, a late Copernican age crater itself superposed on some of the Moon's youngest basaltic volcanic plains. 650 meter-wide field of view from LROC NAC observation M168509312R, LRO orbit 9967, August 20, 2011; incidence 42.67° at 40 cm resolution from 25.59 km over 24.7°N, 313.21°E [NASA/GSFC/Arizona State University].
Another key set of observations came from digital topographic maps derived from NAC stereo pairs that enabled quantitative relief and slope measurements of six larger IMPs. Measurements of the smooth deposit relief compared to the underlying uneven deposit revealed that the thickness of the smooth deposits (on average 8 meters, with a range of 2-20 meters) is consistent with the previously established thickness of lunar basalt flows.

Topographic slopes were measured at the edges of the smooth deposits where they contact the uneven deposits. Slopes that exceed the angle of repose, which is 30-35°, are evidence of relatively young surface features, because over time impacts and moonquakes will smooth over steep cliffs. Slopes on the edges of many of the smooth deposits exceed the angle of repose, providing more evidence for very young surfaces.

Changing the Way We Think About the Moon

Not only are the IMPs striking landscapes, they also tell us something very important about the thermal evolution of the Moon. The nearside has extensive mare basalt flows covering much of its surface, however we know from analysis of Apollo samples and crater counts that the bulk of lunar volcanism occurred from 3.9 to 3.1 billion years ago, and shut-off sometime around 1 billion years ago. However the IMPs seemed to have formed significantly after the canonical cessation of lunar mare basalt volcanism indicating the interior of the Moon is perhaps hotter than previously thought.

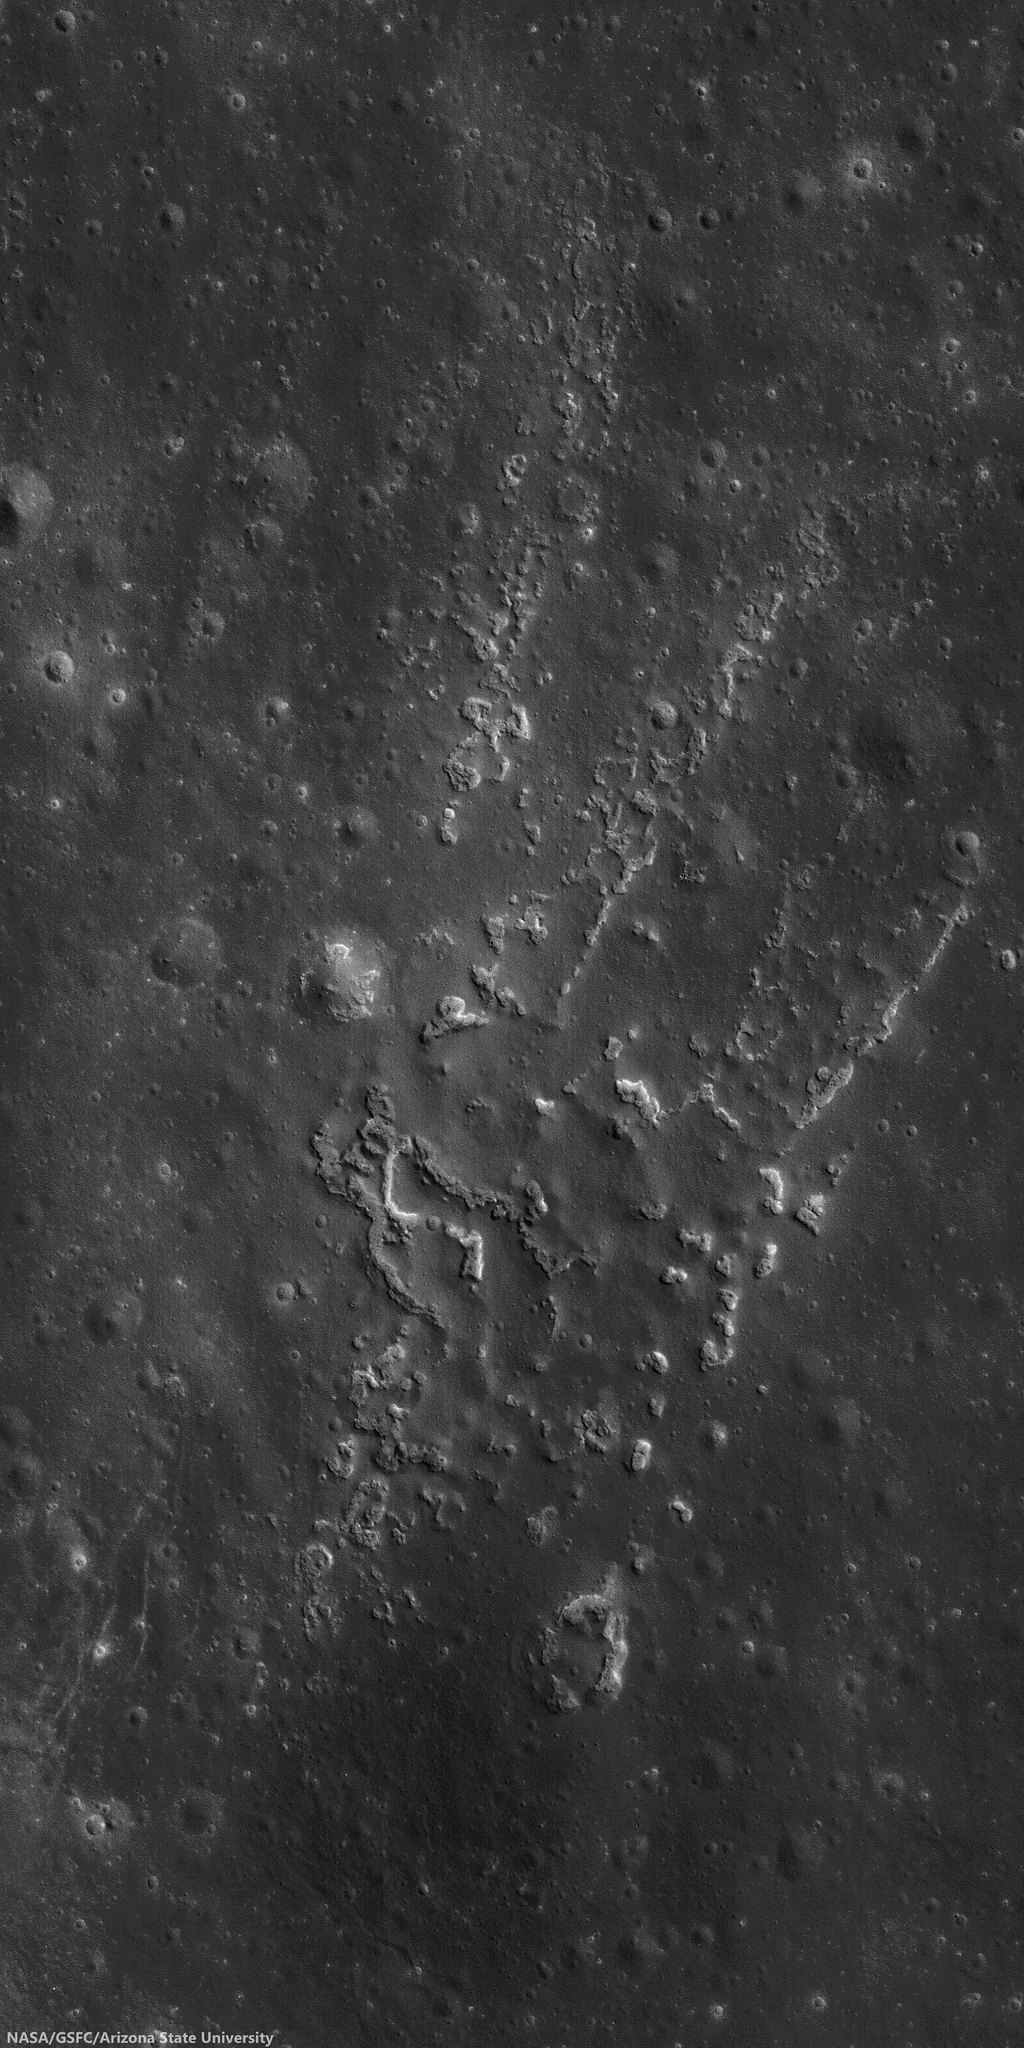
The contrast between the smooth and rough units stands out in this oblique view of Ina. The floor of the depression is about 50 m below the surrounding plains and is about 2 km wide. LRO oblique mosaic M1108203502LR, LRO orbit 15596, November 22, 2012; 52.18° slew from orbital nadir, resolution 3.75 meters from 127.29 km over 18.77°N, 11.64°E [NASA/GSFC/Arizona State University].
Full-width reduction of LRO oblique mosaic M1108203502LR, showing the interesting contextual features, some related, others likely not, subject of decades of speculation [NASA/GSFC/Arizona State University].
The new study of IMPs extends our knowledge of the extent of these fascinating deposits as well as their young age. What does it all mean? The young, small-volume extrusions of mare basalt imply a thermal history of the Moon where volcanism did not end abruptly, but rather decreased gradually over time (and may not be done!). With these newly discovered young volcanic features, scientists must consider that the Moon has a bit more heat in it that previously thought, an important new constraint for future models of the Moon's thermal evolution. Perhaps the abundance of radioactive elements (which provide heat as they decay) is higher -- important knowledge when figuring out how the Moon formed and evolved over time.

A provocative side note to the new thermal constraints — perhaps the Apollo heat flow measurements were spot on? Astronauts buried thermometers in the regolith during the Apollo 15 and 17 missions. The temperatures recorded were a bit higher than models predicted. At the time, scientists proposed that perhaps the two landing sites were in areas with higher heat flow than the average Moon, or perhaps there was an instrumental effect. The discovery of IMPs and their young age is certainly consistent with the higher temperatures measured by the Apollo crews.

Apollo 15 cmdr. Dave Scott working at the west Heat Flow hole (with St. George crater in the background). The drill is sitting on the ground next to the hole. Increased understanding of IMP phenomena increases the likelihood readings taken using the Apollo Heat Flow Experiments (HFE) during the Apollo 15 and 17 surface expeditions were not, afterall, anomalous. Apollo 15 EVA-2 AS15-92-12408 [NASA/JSC].
The IMPs are a fascinating part of the story of lunar volcanism over time, and now they must be considered high priority targets for future exploration. A sample return mission from one of these enigmatic deposits would tell us so much about the Moon as a whole. When did these lavas erupt? Is their chemistry different than the basalts returned by the Apollo astronauts? Is it likely that volcanic eruptions may occur at some point in the future?  A highly accurate age date for the IMPs would also serve as a much needed calibration point for the lunar cratering chronology; a crucial improvement not only for lunar studies but also for Mars and Mercury investigations.

Closer look at the IMP at Rimae Sosigenes - image follows below - Demonstrations Supplementary to "Evidence for basaltic volcanism on the Moon within the past 100 million years," Nature Geoscience 7, 787-791; 2014

Fig. 7 (top) Profile across a contact between smooth and uneven deposits, southeast feature. The relief of the smooth deposit is measured as the difference in elevation between the average flat surface of the smooth deposit (-1504 meters below global mean elevation; Sosigenes Graben NAC-DTM) and the base of the uneven deposit at the contact (-1514 meters). For this particular profile the smooth deposit is 10 meters thick. Note the lobate margin of the smooth deposit at the contact.

Fig. 5 (bottom) Craters on the smooth deposit of the Sosigenes IMP. The red circles are impact craters superposed on the smooth deposit of the Sosigenes IMP, delineated by the blue line; field of view roughly 5 km [NASA/GSFC/Arizona State University].
Spectacular oblique mosaic of the Sosigenes graben with it's large collapse pit, 2800 meters long and 300 meters deep, and floored with an IMP.  LROC NAC oblique observation M1108117962LR, LRO orbit 15584, November 21, 2012; 70.37° incidence, spacecraft and camera slew 55° resolution 2.5 meters from 114.87 km over 8.63°N, 24.9°E [NASA/GSFC/Arizona State University].
View full-window: Spectacular oblique NAC mosaic of the Sosignes graben with a large collapse pit (2800 meters wide, left-to-right; 300 meters deep) floored with an IMP.

Wider field of view from a spectacular oblique LROC NAC mosaic M152750200LR, LRO orbit 15584, November 21, 2012; 70.37° incidence, spacecraft and camera slew 55° resolution 2.5 meters from 114.87 km over 8.63°N, 24.9°E [NASA/GSFC/Arizona State University].
Inspect a variety IMPs using the LROC Quickmap: Cauchy-5, Nubium, GEM-30, Aristarchus North

Related Posts:
Inside Rima Hyginus (June 12, 2012)
Ina of the Meniscus Hollows (March 21, 2012)
Spectral properties of Ina (February 7, 2011)

Monday, September 15, 2014

Watching craters "as they happen"

A new crater on the Moon, "found among so many." The bright flash of formation for this approximately 34 meter diameter crater was captured simultaneously by two Earthbound telescopes in Spain on September 11, 2013. From LRO, before-image LROC NAC observation M1119014742L, orbit 17116, March 27, 2013; incidence 23.66° resolution 82 cm from 84.41 km, After-image LROC NAC M1149637354L, LRO orbit 21423, March 16, 2014; incidence 23.18° resolution 91 cm from 89.12 km  [NASA/GSFC/Arizona State University].
Mark Robinson
Principal Investigator
Lunar Reconnaissance Orbiter Camera (LROC)
Arizona State University

On 11 September 2013 the "Moon Impacts Detection and Analysis System" (MIDAS) camera captured a bright 8-second long flash on the central nearside of the Moon.

This was the brightest event captured so far by the MIDAS team, and they estimated that the crater should be between 46 and 56 meters in diameter.

The LROC team targeted the reported coordinates (17.2°S, 339.5°E) of the flash and acquired several images over a few months until the crater was found in images acquired on 16 March 2014 and 13 April 2014.

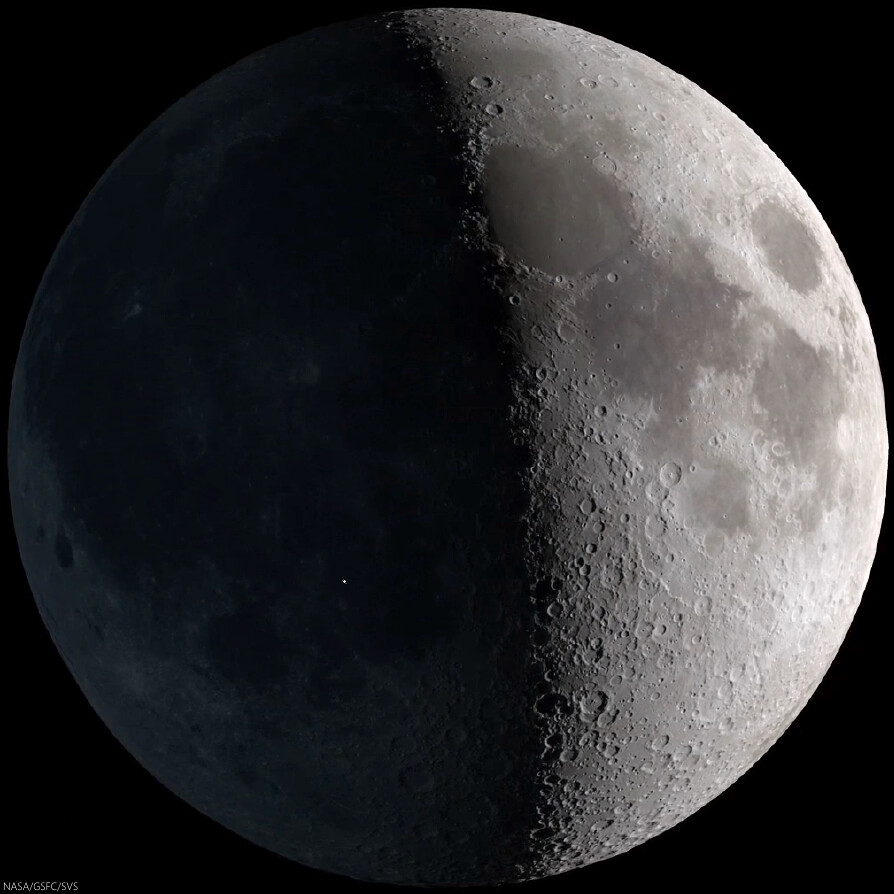
Strictly speaking, the 11 Sept. 2013 event was visible to the naked eye, though at nearly First Quarter the idealized reproduction above fails to account for the discriminating human eye. The illuminated east hemisphere would tend to have washed out Earthshine for all but those with the steadiest eyes. Fortunately, for at least ten years the unlit portion of the Nearside "visible" at night has been carefully monitored systematically, improving our understanding of hazards in the Near-Earth environment [NASA/GSFC/SVS].
Video sequence recording impact on the Moon's nearside in Mare Nubium. The magnitude of the explosion is estimated to have been roughly equal to that of Polaris, the North Star, and the recorded light curve following after lasted a remarkable eight seconds. Madiedo, et al. (2014) [IAA-CSIC/Universidad de Huelva].

Fortunately there was a NAC image of the target area acquired before the impact, so finding the new crater was relatively easy once an "after" image with comparable lighting to the "before" image was acquired.

As it turns out the new crater is ~34 meters (112 feet) in diameter and is located at 17.167°S, 339.599°E, only 2 kilometers (1.2 miles) from the original telescope-based prediction. In the before-after animation you can see ejecta effects from the crater extend out more than 500 meters in all directions!

See also LROC NAC image M1149637354L (16 March 2014).


Impact flash recorded on the unlit Nearside by Prof. Jose M. Madiedo, 11 Sept. 2013. North is to the right (note the visibility of Grimaldi, top center - the 173 km-wide walled plain is often the last recognizable feature on portion of the Nearside lit by Earthshine as the Moon waxes Full). The Moon was shy of First Quarter. This video was produced on the occasion of the publication (in Feb. 2014) in Monthly Notices of the Royal Astronomical Society (MNRAS) of the paper entitled "A large lunar impact blast on 2013 September 11," by J.M. Madiedo, J.L. Ortiz, N. Morales and J. Cabrera-Caño.

A longer, more instructive version was uploaded by the authors HERE

Wide Angle Camera morphology basemap overlaid with color-coded LROC GLD100 topography centered on the 11 September 2013 impact crater. The large crater just visible in the lower left is 60 kilometer diameter crater Bullialdus [NASA/GSFC/Arizona State University].
Revisit the LROC NAC image of new crater formed on 17 March 2013, HERE.

Read the paper describing the 11 September 2013 observation (Madiedo et al., 2014)

Wednesday, August 27, 2014

Pit craters in NAC DTM topography

The crisp morphology of the central Mare Fecunditatis pit (white arrow) stands out in elevation data and suggests a relatively young age. This pit is about 200-m in length and 45 m deep. Image width is 5 km; north is up. Color shaded-relief created from NAC DTM FecundPit; higher elevations shown in red and lower elevations in blue and purple [NASA/GSFC/Arizona State University].
J. Stopar
LROC News System

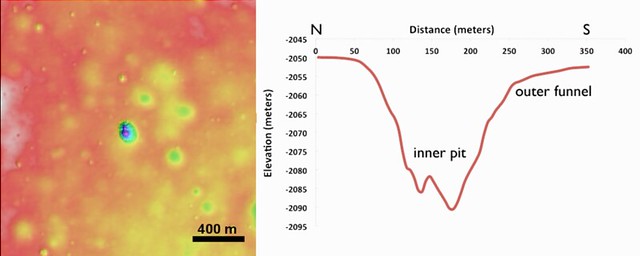
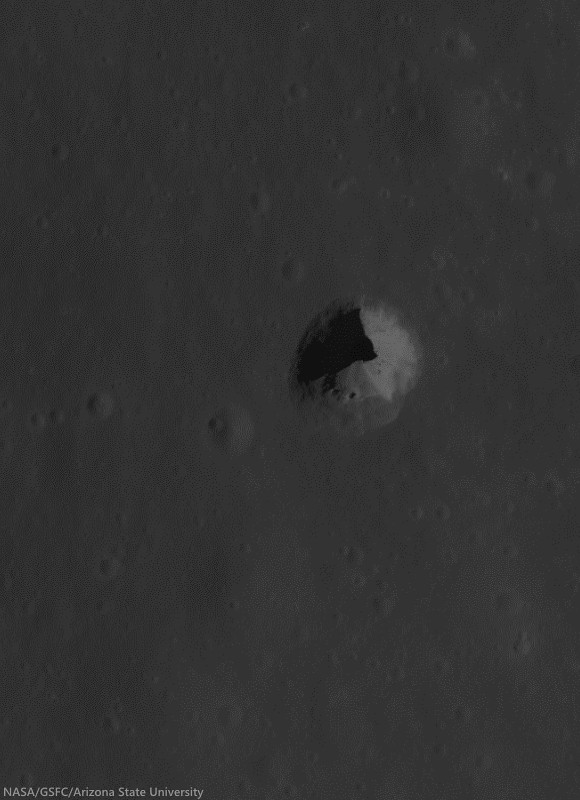
Eight mare pits have been discovered so far on the Moon, five of which preserve void spaces (sublunarean voids) beneath overhanging mare layers. The pit featured above, located in central Mare Fecunditatis (0.917°S, 48.66°E), however, does not have an obvious void space. The pit is almost 200 m wide and about 45 m deep.

The central Mare Fecunditatis pit has a concave shape, with gentler slopes (outer funnel) near the upper mare surface, and a steeper-walled inner pit (see image below). Variations in wall slopes are consistent with a fine-grained, particulate layer (regolith) overlying more coherent mare layers. The steep inner pit suggests collapse into a small void space. The debris in the pit floor consists of both regolith and mare blocks from the upper layers.

Pit crater (0.92°S, 48.66°E) near Messier B, now generally designated the Central Fecunditatis pit crater to distinguish it for a more recently discovered skylight in southwest Fecunditatis. LRO's longevity has enabled repeated narrow angle photography of selected areas on the Moon, allowing for the team at Arizona State University to build up very high-resolution, NAC-based digital terrain models. 540 meter field of view from LROC NAC observation M1105602888R, LRO orbit 15232, October 23, 2012; 35.18° incidence angle, resolution 93 cm from 108.28 km over 0.92°S, 49°E [NASA/GSFC/Arizona State University]
Left: color shaded-relief of NAC-derived elevation data. Reds are higher elevations, purple lower elevations. Right: elevation profile of a north-to-south cross-section through the pit. The inner pit has steep walls, while slopes near the mare surface (outer funnel) are more gentle [NASA/GSFC/Arizona State University].
The lack of raised rim or ejecta around the pit, indicates that it most likely formed through collapse, rather than as an impact event. While this pit is not located near any obvious tectonic features or volcanic constructs, the collapse may have occurred into part of an old lava tube. The crispness of the pit morphology, suggests that the collapse occurred relatively recently (geologically speaking, at least), perhaps much less than 1 billion years ago. Pits are among some of the youngest landforms on the Moon, and are similar in age to many fresh craters (such as Tycho, Copernicus, or Aristarchus).

More recently identified pit crater in southwest Mare Fecunditatis (6.752°S, 42.76°E), discovered during Wagner and Robinson survey. A 325 meter-wide field of view from LROC NAC M167926438R, LRO orbit 9881, August 14, 2011; 42.25° incidence angle, resolution 56 cm from 26.73 km over 6.71°S, 42.72°E [NASA/GSFC/Arizona State University].
Read More About Lunar Pits:  Lunar pits were recently featured in the news and the focus of a scientific publication ("Distribution, formation mechanisms, and significance of lunar pits," Robert V. Wagner and Mark S. Robinson, Icarus, July 2014; pg. 52-60).

The pits are of particular interest to lunar scientists because they could offer access to subsurface materials, making them important targets for further research and exploration.

Explore the pit in the full-resolution LROC NAC observation HERE.

More Pits:

Friday, May 23, 2014

Lunokhod 2: Trundling Across the Moon

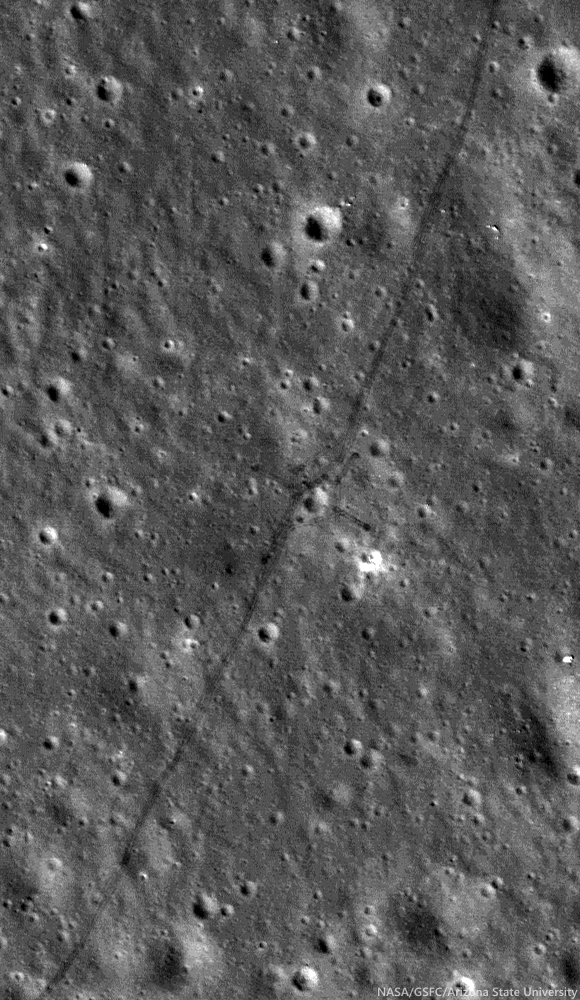
Tracks made by Lunokhod 2 in 1976 as the Soviets tested for variations in the local magnetic field while traversing around a small crater (25.764°N, 30.474°E) inside le Monnier crater, on the eastern edge of Mare Serenitatis. From LROC NAC observation M122007650R, LRO orbit 3114, February 28, 2010; 36.59° incidence angle, resolution 50 cm from 43.89 km [NASA/ GSFC/ Arizona State University].
Mark Robinson
Principal Investigator
Lunar Reconnaissance Orbiter Camera
Arizona State University

On 15 January 1973, just one month after the successful Apollo 17 mission culminated the US Project Apollo, the Soviet Luna 21 spacecraft landed softly just 170 km north of the Apollo 17 site on the eastern margin of Mare Serenitatis.

A day later on 16 January the rover Lunokhod 2 disembarked and, on 18 January, with a full battery charge it circumnavigated and imaged its faithful lander and began its record-setting journey across the lunar landscape.

The eight-wheeled rover was operated by controllers in Simferopol, Crimea, mainly using a mast-mounted TV camera and ‘joystick’ controls and roved the lunar surface for five Earth months, surviving four bitterly cold lunar nights (as low as -150 °C (-240 °F)) and racking up about 39 km (~24.4 miles) of traverse distance.

The original reported distance was 37 km, which made Lunokhod 2 the planetary rover traverse distance record holder! Along its traverse, Lunokhod 2 carried out a series of scientific experiments that were not well publicized in the United States.  Today’s Featured Image shows a cross-like pattern of rover tracks made as Lunokhod 2 explored a small crater, making various scientific measurements.

A typical Lunokhod operations crew included a commander, a navigator, a driver, an engineer, a radio/antenna operator, and one man in reserve.

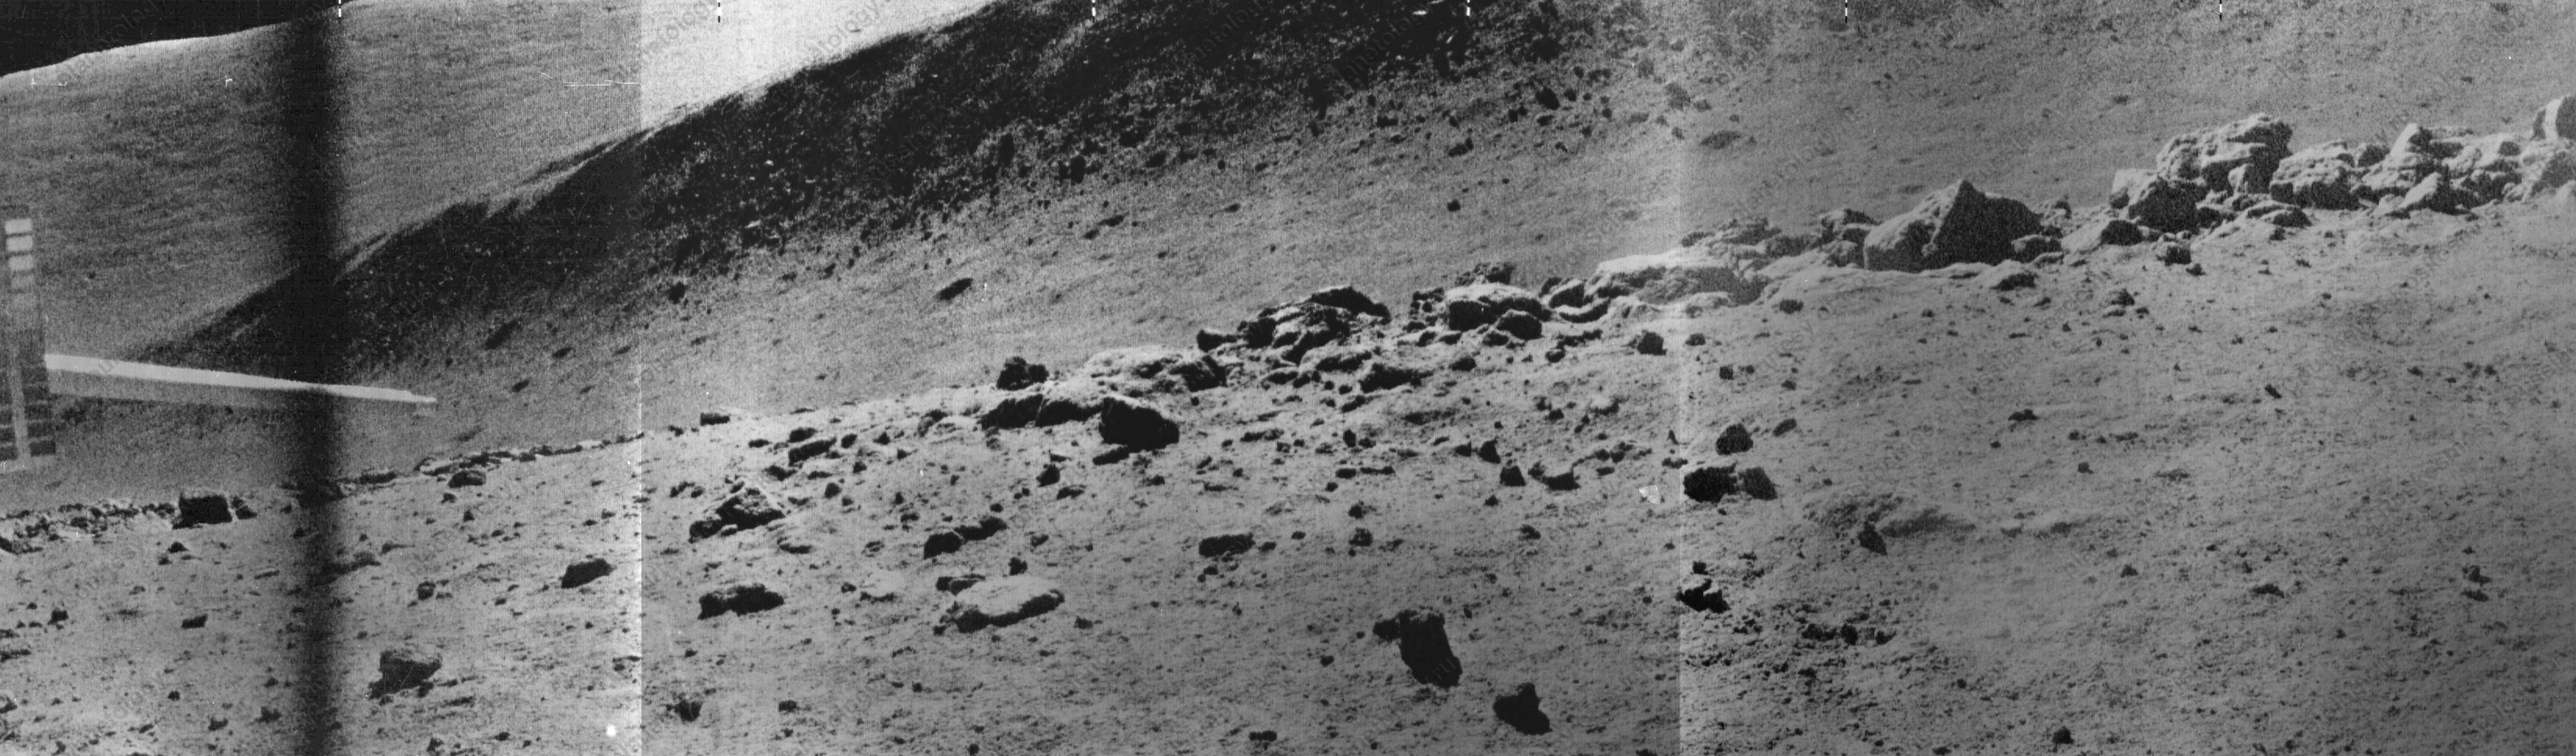
Panorama taken by Lunokhod 2 at the crater shown in LROC NAC observation M122007650R (cropped from L2_D03_S03_P05m). The main experiments at this location were to test for changes in the local magnetic field due to the crater and characteristics of the regolith [Courtesy of Roskosmos and Russian Academy of Sciences].
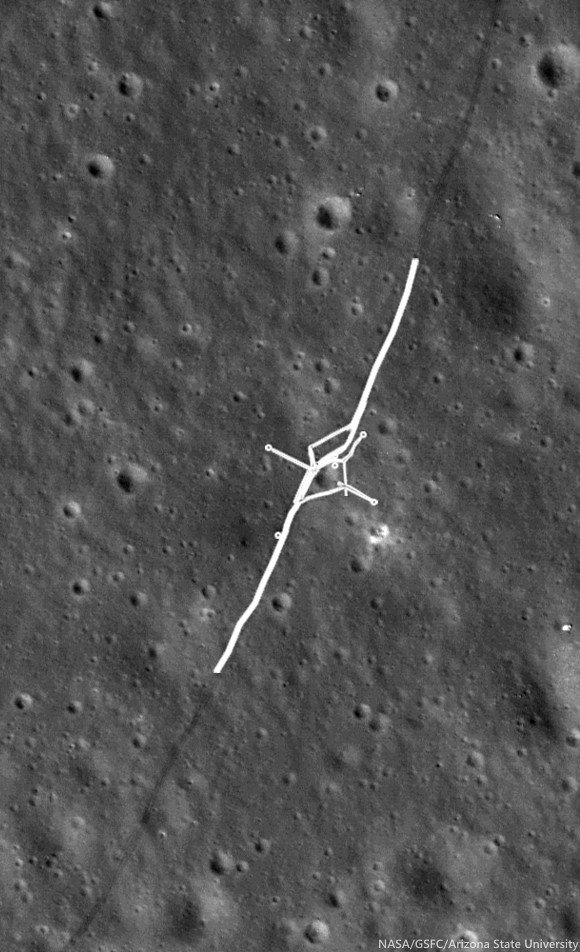
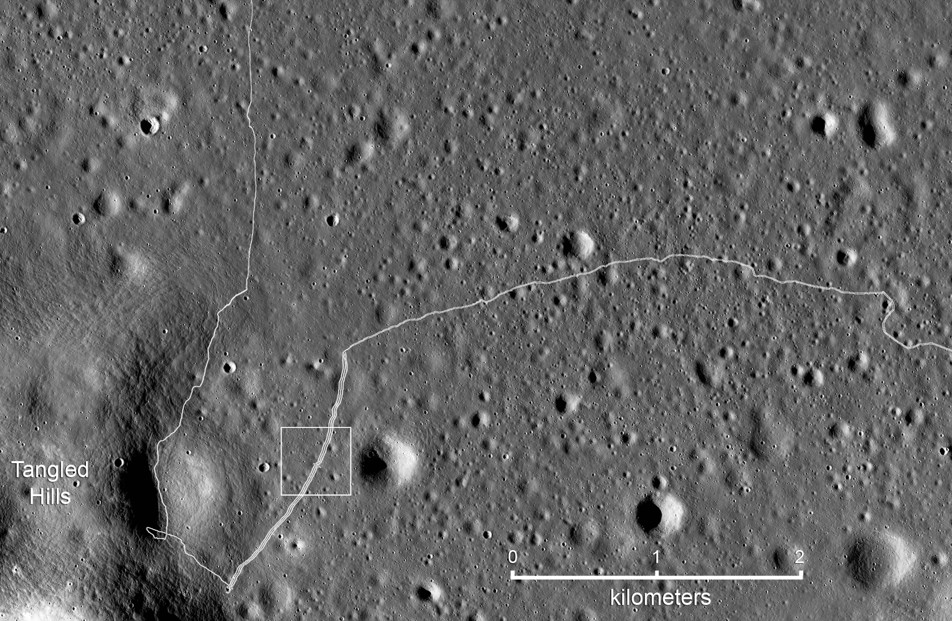
Tracing the tracks in LROC NAC images, with new accurate geodetic controls that incorporate the latest topographic information from LROC and LOLA, the length of the Lunokhod 2 traverse is now accurately determined and is greater than the originally estimated 37 km.  In fact, the intrepid Lunokhod 2 traversed approximately 39 km!  The new traverse measurements were carried out by scientists at Moscow State University, and then again by a team at Washington University in St. Louis. The distance measurements follow the complete route shown by the tracks: including a “tripled” segment about 2 km in length, several long, linear magnetometer traverses, and several impact crater crossing maneuvers.

Lunokhod 2 traverse overview, low resolution version of six NAC image mosaic (original 1.3 m pixel scale), Sun from the west (see also Abdrakhimov, 42nd LPSC 2011) [NASA/GSFC/Arizona State University].
LROC NAC M122007650R, with portion of Lunokhod 2 rover tracks highlighted, where instruments gathered magnetometer measurements and did a triple traverse. Small circles can also be seen where the Lunokhod turned in place to take panoramic images [NASA/GSFC/Arizona State University].
Exploring Hilly Terrain

During the Lunokhod 2 mission, as the deputy leader of the Scientific Team and leader of the Geology Group, Dr. Alexander “Sasha” Basilevsky worked tirelessly to maximize the science return of the mission. Meeting this goal was not so easy because the Managing Group (Crew plus representatives of Lavochkin Association, which built the Lunokhods) was mostly thinking about demonstrating the roving and control capability of Lunokhod 2, and establishing a new distance record. Dr. Basilevsky recounts,
“So when moving south from the landing point, we crossed the mare area and reached a hilly terrain (low "highland" terrain).  I was planning to study it and then to go north and then east towards a graben later called Fossa Recta. But the managing team did not like long sessions of TV stereo-imaging and other measurements, and they sent Lunokhod back to the north despite my protests.
Detail map of the SW portion of the Lunokhod 2 traverse. White box indicates the field of view shown at high-resolution in the LROC Featured Image released May 2014 [NASA/GSFC/Arizona State University].
“So I called to Moscow to the head of my laboratory, Professor Cyrill Florensky, he called to Vice President of Academy of Sciences Academician Alexander Vinogradov, and Vinogradov called Sergei Kryukov, the Lavochkin Association director, and explained that the hilly terrain had to be studied. Kryukov agreed and called to the Lunokhod Control Center in Crimea where we were and said, ‘please, follow the suggestion of that guy Basilevsky.’
“Meanwhile Lunokhod 2 proceeded quite a long way. After the Kryukov call worked, the crew just turned the vehicle back and then drove along the track. That was safe and they could be fast. When Lunokhod 2 came back to the hilly terrain station we made several panoramas, and then drove back to north along the double track and again could be fast.
“So the result was good for both sides of the [issue]: For science: we studied [the hilly] terrain, and for the Managing Group: Lunokhod made a lot of meters.”
At the conclusion of the ‘tripled’ traverse segment, Lunokhod 2 had racked up about 17 km of odometry. Controllers then began the long eastward drive to Fossa Recta (‘Straight Rille’), crossing Fossa Inconspicua (‘Unnoticed Rille’) along the way. Magnetometer experiments were done along the tripled traverse to test for effects related to the mare-highland boundary, and later, on the east and west sides of Fossa Recta (see below). Other observations and measurements included soil compositional analyses using an X-ray fluorescence spectrometer, soil mechanics experiments using a penetrometer, solar X-ray monitoring, a photodetector to detect UV light sources and the level of Earth-glow on the night-time Moon, laser ranging, 86 panorama photos, and some 80,000 TV pictures. The laser ranging retroreflector, a French instrument, is still in use today.

Fossa Recta Exploration

On its fourth lunar day of roving, Lunokhod 2 explored a linear depression (graben or rille), Fossa Recta. After approaching the depression, the Lunokhod was driven along a path leading away from its edge to measure any changes in the local magnetic field associated with the depression, and then back along the same path to the edge again.  By reversing its direction and retracing its path, the effect of the Lunokhod, itself, on the magnetic signal could be determined and subtracted from the signal. A portion of the panorama taken by Lunokhod 2 when it approached the graben of Fossa Recta is shown below.

Part of the Panorama (L2_D04_S11_P09m) showing a portion of the Fossa Recta, stretching from north (left) to south (right) and a boulder field in the foreground. The sharp object on the left side of the panorama is the soil penetrometer [Courtesy of Roskosmos and Russian Academy of Sciences].
When the panorama was taken, Lunokhod 2 was on the western edge of Fossa Recta, at the position shown above, and boulders on the very edge of the depression are readily seen. The boulders were described in a paper by Basilevsky, Florensky, and Ronca (1977) in a scientific journal, The Moon, Vol. 17, and interpreted as boulders derived from lava bedrock at the edge of a long linear depression.  The characteristics observed at the edge of the fossa are similar to those seen by Apollo 15 astronauts Dave Scott and Jim Irwin at Hadley Rille. After exploring Fossa Recta Lunokhod 2 was nowhere near done!

Related Posts

Wednesday, May 7, 2014

Earthrise!

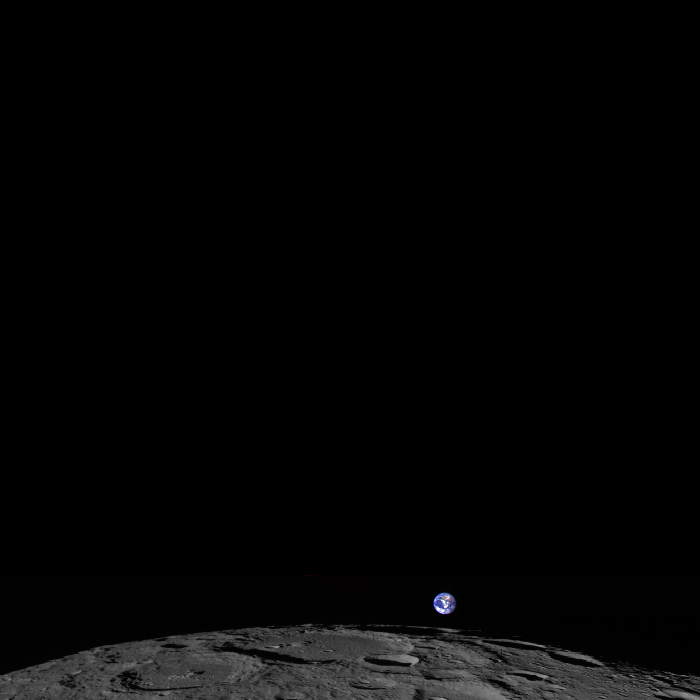
LROC Wide Angle Camera (WAC) observation M1145896768C, LRO orbit 20898, February 1, 2014; spacecraft and camera slew 63.8° from orbital nadir. LROC Featured Image, May 7, 2014 [NASA/GSFC/Arizona State University].
Mark Robinson
Principal Investigator
Lunar Reconnaissance Orbiter Camera
Arizona State University

LRO experiences twelve earthrises every day, however LROC is almost always busy imaging the lunar surface so only rarely does an opportunity arise such that LROC can capture a view of the Earth. On the first of February of this year LRO pitched forward while approaching the north pole allowing the LROC WAC to capture the Earth rising above Rozhdestvenskiy crater (181 km; 85°N, 202.1°E).

The LROC Wide Angle Camera (WAC) is very different than most digital cameras. Typically resolution is reported as the number pixels in a single image, a cell phone camera today has more than 5 million pixels (5 megapixels). A single WAC frame has only 9856 pixels, however the WAC builds up a much larger image by exposing a series of images (or frames) as LRO progresses in its orbit; this type of imaging is called "push-frame". Over a full month as the LRO orbit track progresses around the Moon the WAC builds up a collection of images that covers the entire globe.

Occasionally LRO points off into space to acquire observations of the exosphere and perform instrument calibration measurements. During these slews sometimes the Earth (and other planets) pass through the WAC's field of view and dramatic images such as the one shown here are acquired. In the opening image the Moon is a grayscale composite of the first six frames of the WAC observation (while the spacecraft was still actively slewing), using visible bands 604 nm, 643 nm, and 689 nm. The Earth is a color composite of later frames, using  the 415 nm, 566 nm, and 604 nm bands as blue, green, and red, respectively. These wavelengths were picked as they match well the response of the human eye, so the colors are very close to true, that is what the average person might see. Also, in this image the relative brightness between the Earth and the Moon is correct, note how much brighter the Earth is relative to the Moon.

LROC WAC Earthrise [NASA/GSFC/Arizona State University].
In the video the "venetian blind" banding demonstrates how a WAC image is built up frame-by-frame. The gaps between the frames are due to the real separation of the WAC filters on the CCD. The longest wavelength (689 nm) band is at the bottom of the scene, and the shortest (415 nm) is at the top; note how the Earth is brighter when it enters the top band due to the blue from the ocean. The frames were acquired at two second intervals, so the total time to collect the sequence was 5 minutes. The video is faster than reality by a factor of ~20.

Related Posts:
In the Shadow of the Moon
Americas from the Moon
Earth from the Moon

Tuesday, March 18, 2014

681 Gigapixel LROC mosaic

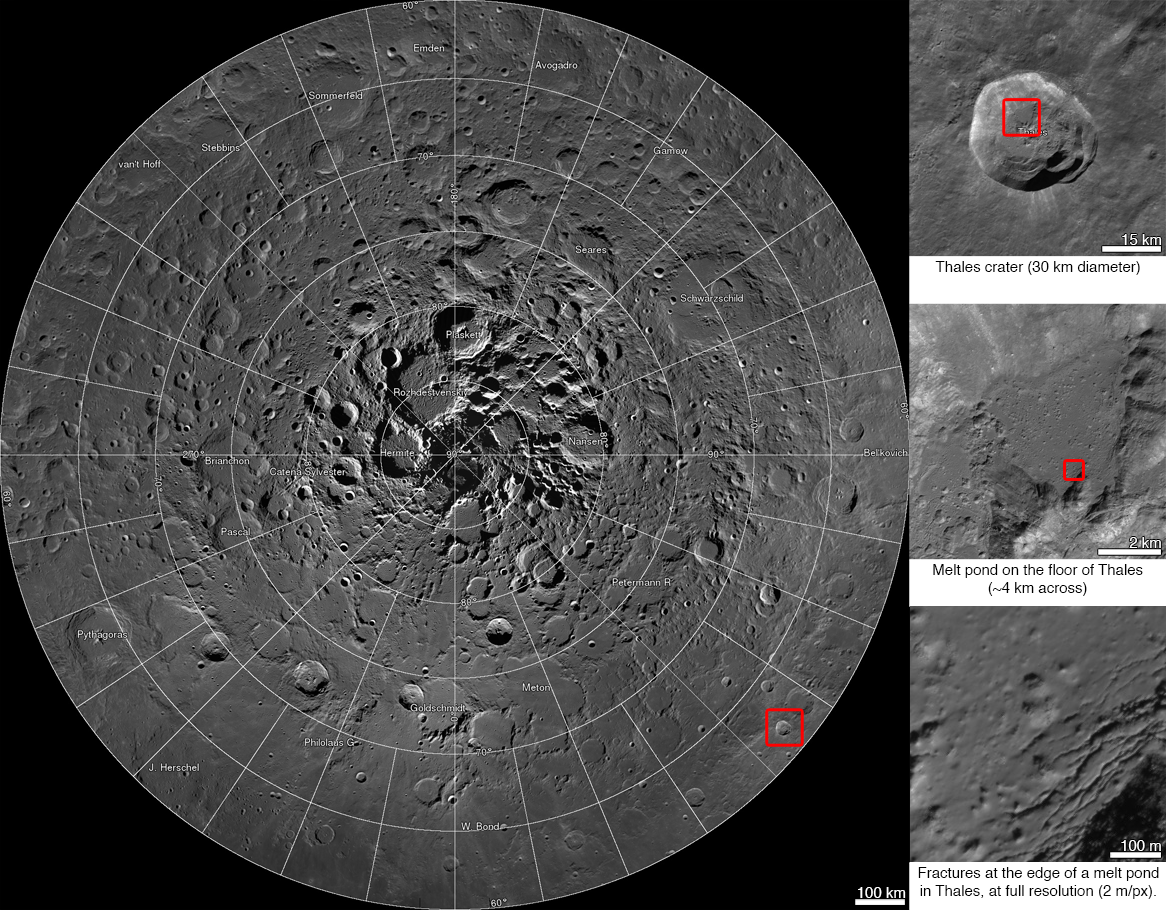
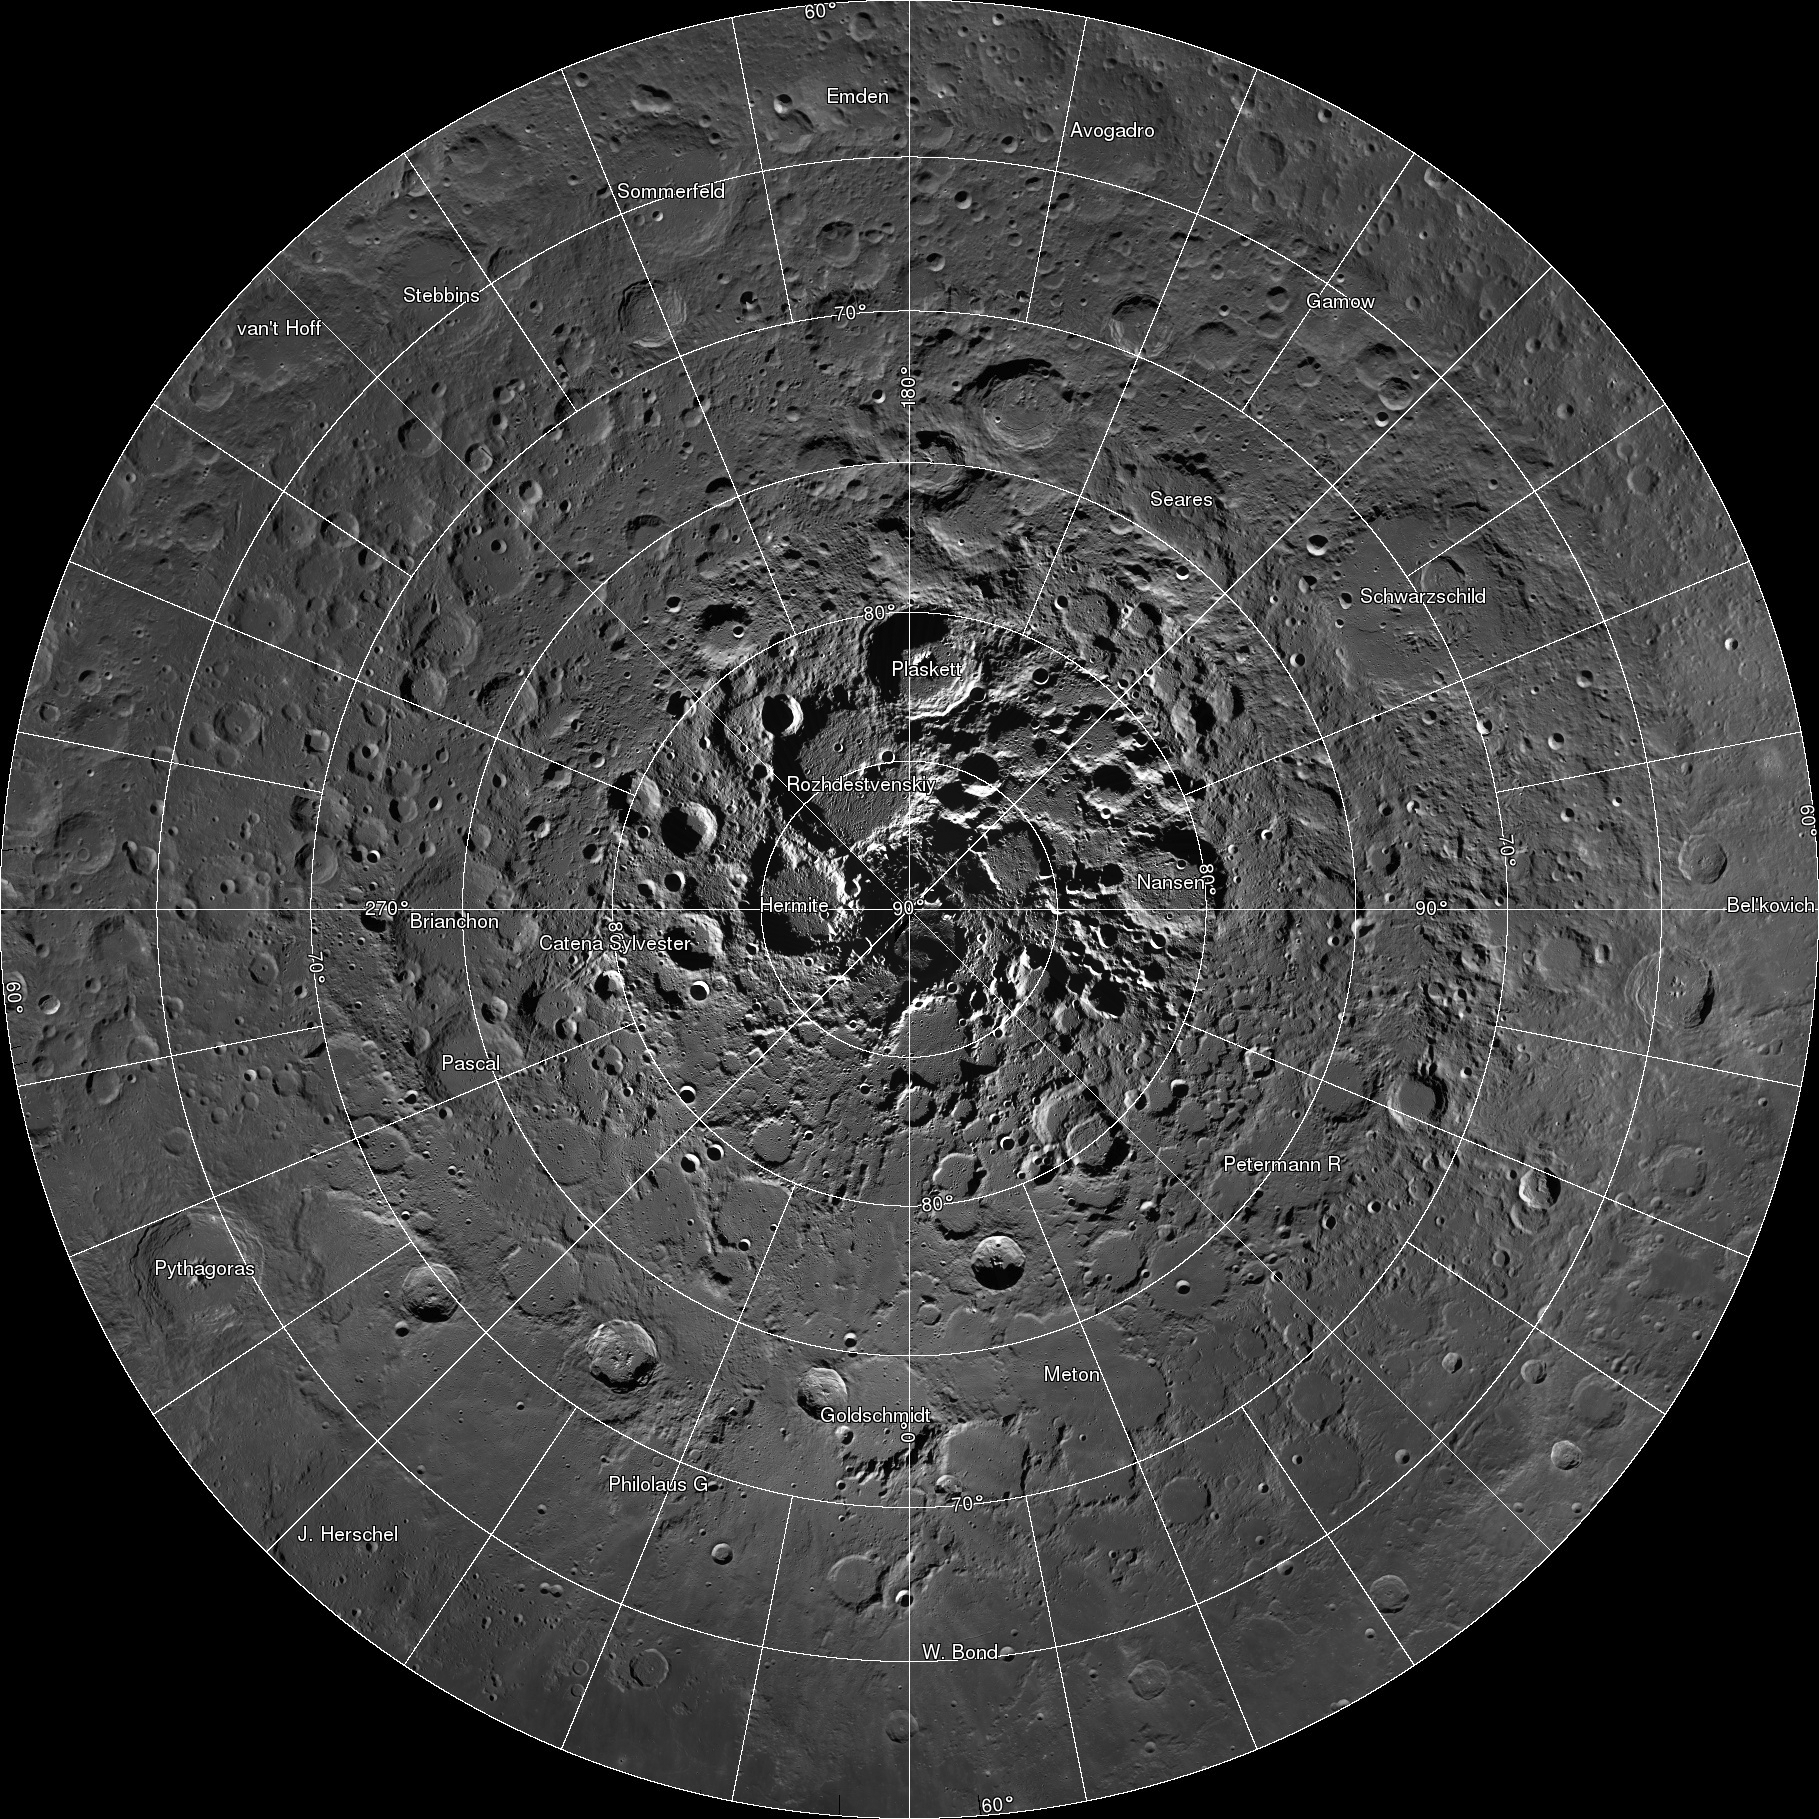
Spectacular LROC Northern Polar Mosaic (LNPM) allows exploration from 60°N up to the pole at the astounding pixel scale of 2 meters [NASA/GSFC/Arizona State University].
Mark Robinson
Principal Investigator
Lunar Reconnaissance Orbiter Camera
Arizona State University

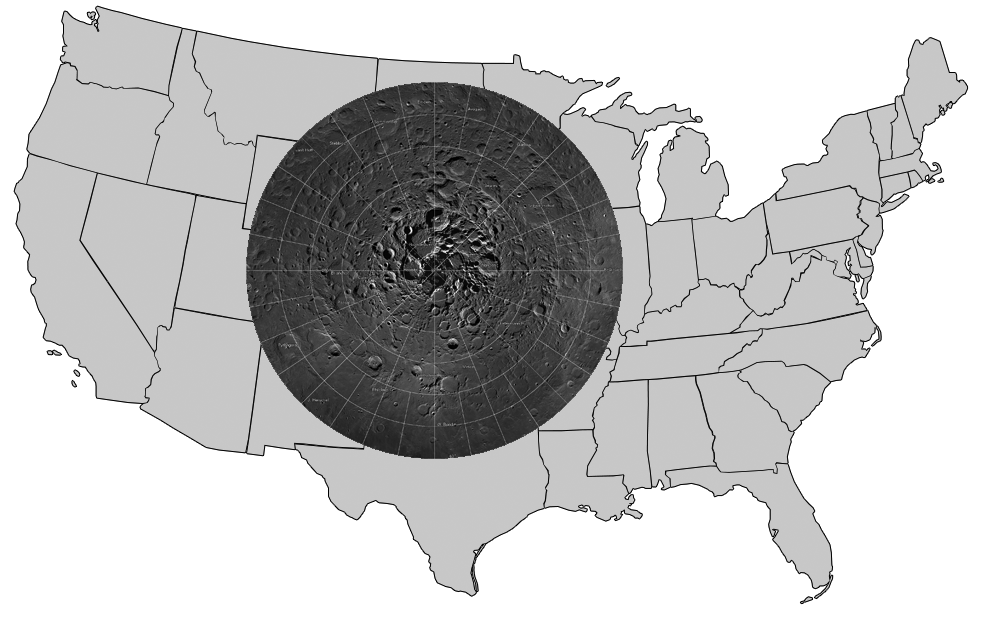
The LROC team assembled 10,581 NAC images, collected over 4 years, into a spectacular northern polar mosaic. The LROC Northern Polar Mosaic (LNPM) is likely one of the world’s largest image mosaics in existence, or at least publicly available on the web, with over 680 gigapixels of valid image data covering a region (2.54 million km2, 0.98 million miles2) slightly larger than the combined area of Alaska (1.72 million km2) and Texas (0.70 million km2) -- at a resolution of 2 meters per pixel! To create the mosaic, each LROC NAC image was map projected on a 30 m/pixel Lunar Orbiter Laser Altimeter (LOLA) derived Digital Terrain Model (DTM) using a software package called the Integrated Software for Imagers and Spectrometers (ISIS).

Figure 1. LNPM superposed on map of the United States.
A polar stereographic projection was used in order to limit mapping distortions when creating the 2-D map. In addition, the LROC team used improved ephemeris provide by the LOLA and GRAIL teams and an improved camera pointing model to enable accurate projection of each image in the mosaic to within 20 meters. Almost exactly 3 years ago the LROC team released a Wide Angle Camera (WAC) mosaic of the same north polar region, the pixel scale was 100 meters.

The new NAC mosaic is 50x higher resolution!

LNPM with three levels of zoom down into Thales crater [NASA/GSFC/Arizona State University].
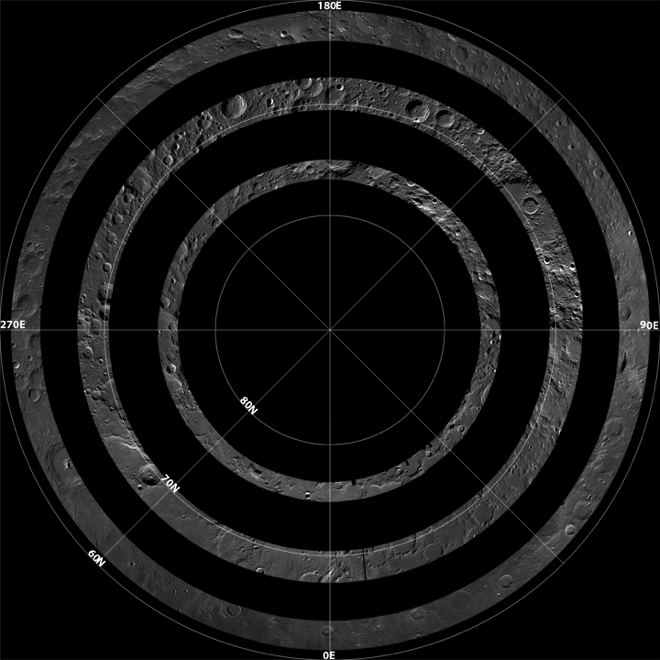
The LNPM was assembled from individual "collar" mosaics. Each collar mosaic was acquired by imaging the same latitude once every two-hour orbit for a month during which time the rotation of the Moon steadily brought every longitude into view. Each collar mosaic has very similar lighting from start to end and covers 1° to 3° of latitude.

Three collar mosaics illustrating how the images were acquired over time to build the LNPM [NASA/GSFC/Arizona State University].
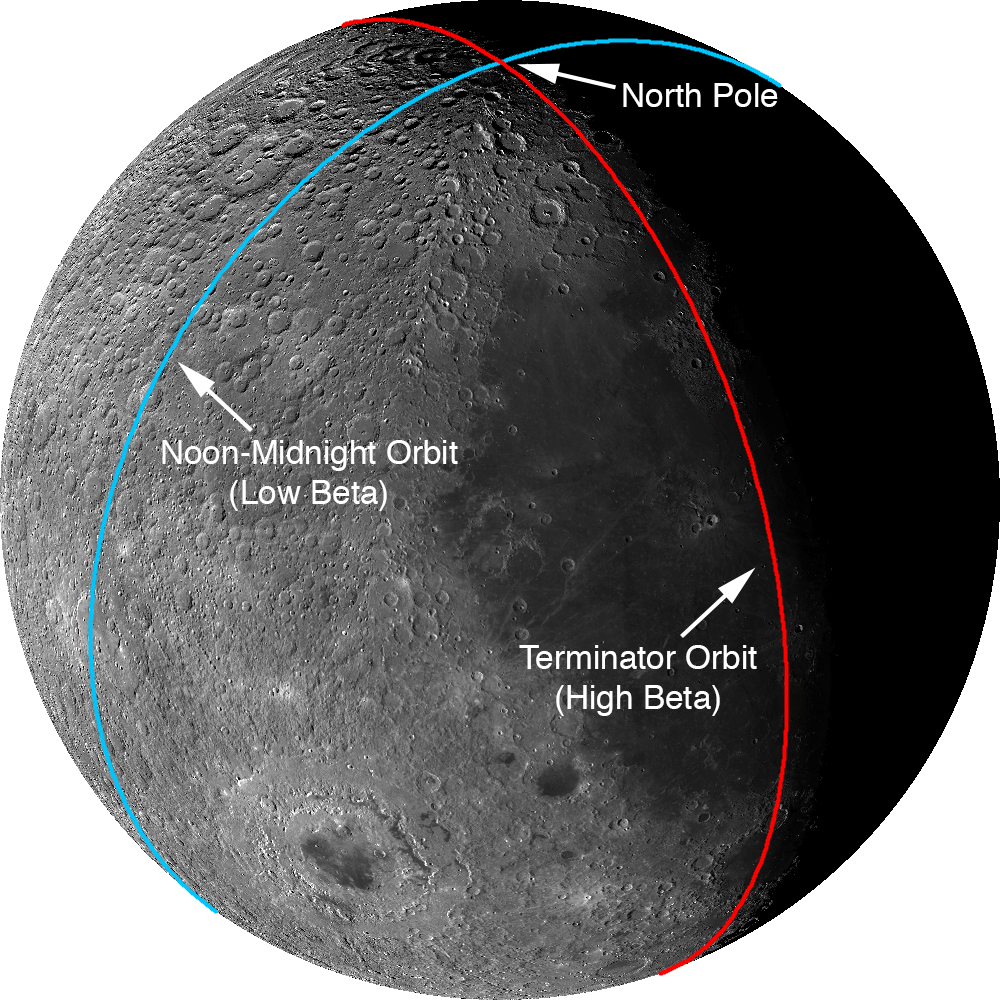
The Moon does have subtle seasons and the LRO orbit cycles between noon-midnight and terminator orbits (measured as the angle between the spacecraft orbit plane and the sub-solar longitude; known as the beta angle). Lighting at the poles is best during northern summer and when the spacecraft is in noon-midnight orbits (low beta). There are a few gaps in the collar sequences due to spacecraft anomalies and special slewed observations that point the cameras off into space. These gaps were filled with images acquired at other times in the mission. These gap-filling images sometimes have the Sun from the opposite direction of the surrounding collar, resulting in noticeable boundaries.

Two types of orbit that LRO experiences through a six-month cycle. Images acquired during terminator orbits have long shadows from the equator to the pole. For noon-midnight orbits the Sun is overhead (no shadows) at the equator and shadows, though still large, are minimized at the poles.
The LNPM was originally assembled as 841 large tiles due to the sheer volume of data: if the mosaic was processed as a single file it would have been approximately 3.3 terabytes in size! Part of the large size is due to the incredible dynamic range of the NACs. The raw images are recorded as 12-bit data (4096 grey levels) then processed to normalized reflectance (a quantitative measure of the percentage of light reflected from each spot on the ground). To preserve the subtle shading gradations of the raw images during processing the NAC images are stored as 32-bit floating-point values (millions of grey levels). The 32-bit values are four times the disk size of the finalized 8-bit (255 grey levels) representation most computers use to display greyscale images. The conversion process from 32-bit to 8-bit pixels results in saturation (group of pixels all with the maximum value of 255) in the brightest areas.

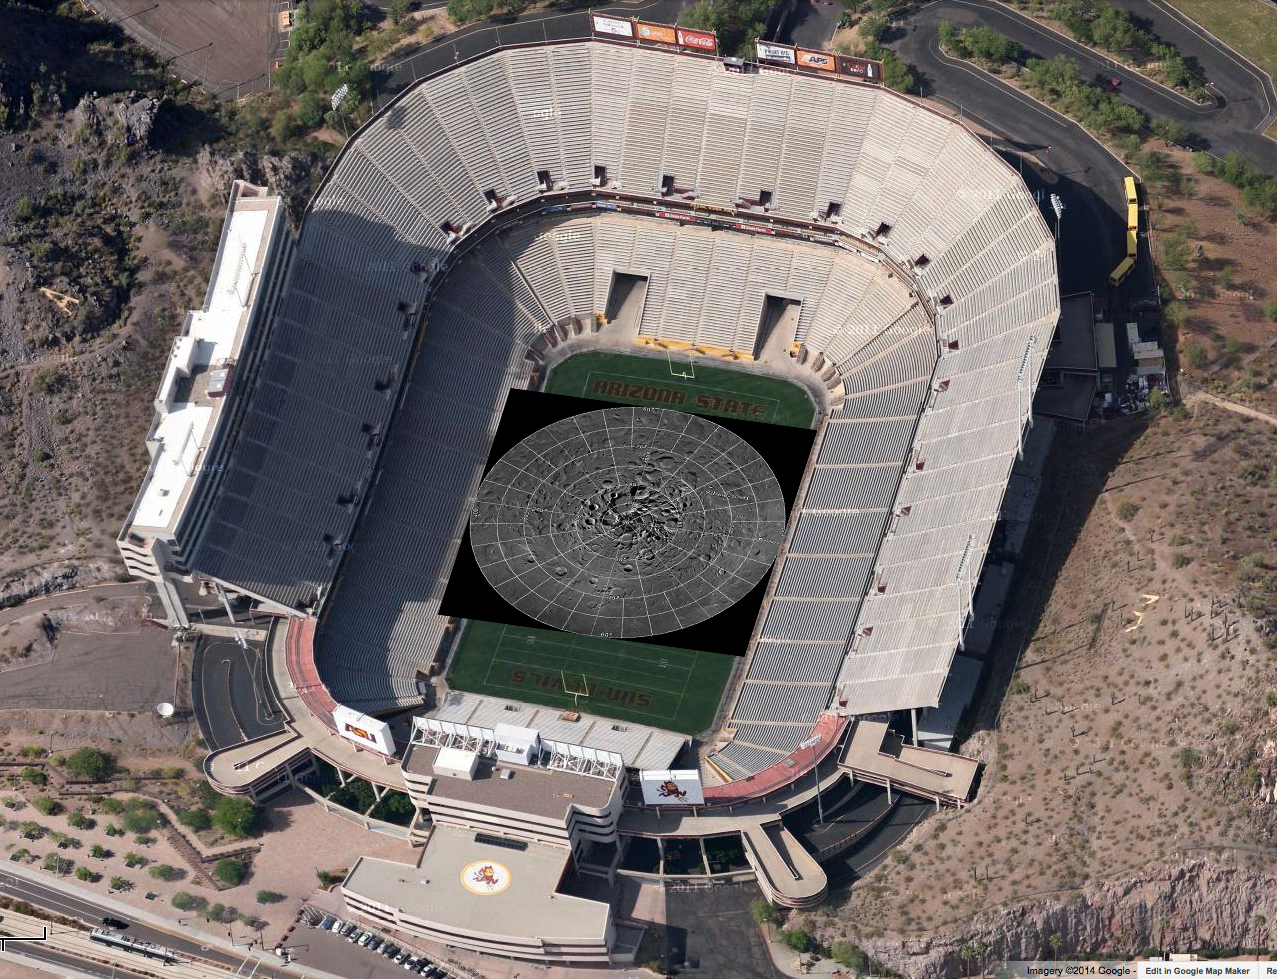
Printed at 300dpi (a high-quality printing resolution that requires you to peer very closely to distinguish pixels), the LNPM would be larger than a football field.
Even with the conversion, the compressed JPEG images that make up the final product take up almost a terabyte of disk space. To create the zooming and panning Gigapan version, multiple versions of each large tile (32,768 pixels square) were made at varying pixel scales. Next, appropriate labels and grid lines were added for each zoom level in hopes of keeping the user oriented – no sense in getting lost on the Moon! Finally these larger tiles were split into 256-pixel square images, allowing a web browser on an average network to keep up with the amazing detail (only a few tens of kilobytes are needed to see any given location at full resolution). In total the LROC NAC northern polar mosaic required 17,641,035 small tiles to produce the final product.

Dive right in HERE, and explore each of the 681 Gigapixels.

LNPM by the numbers:

Square image: 931,070 pixels across and down
Total pixels: 866,891,344,900  (867 billion)
Pixels with image data: 680,808,991,627 (681 billion)
NAC images: 10,581
Image tiles (256x256): 17,641,035 (18 million)
Mass storage of tiles: 950 Gigabytes

Acknowledgments: The LOLA team provided the high resolution topography used to map project the NAC images and improved spacecraft ephemeris that allowed accurate placement of the images on the lunar latitude longitude grid. Gigapan provided mass storage and a web interface. The United States Geological Survey Astrogeology Science Center provided the ISIS image processing software. The NASA LRO project collected the data and funded the processing effort. The LROC imaging suite was developed and built by Malin Space Science Systems (MSSS).