Showing posts with label superposition. Show all posts

Monday, September 15, 2014

Watching craters "as they happen"

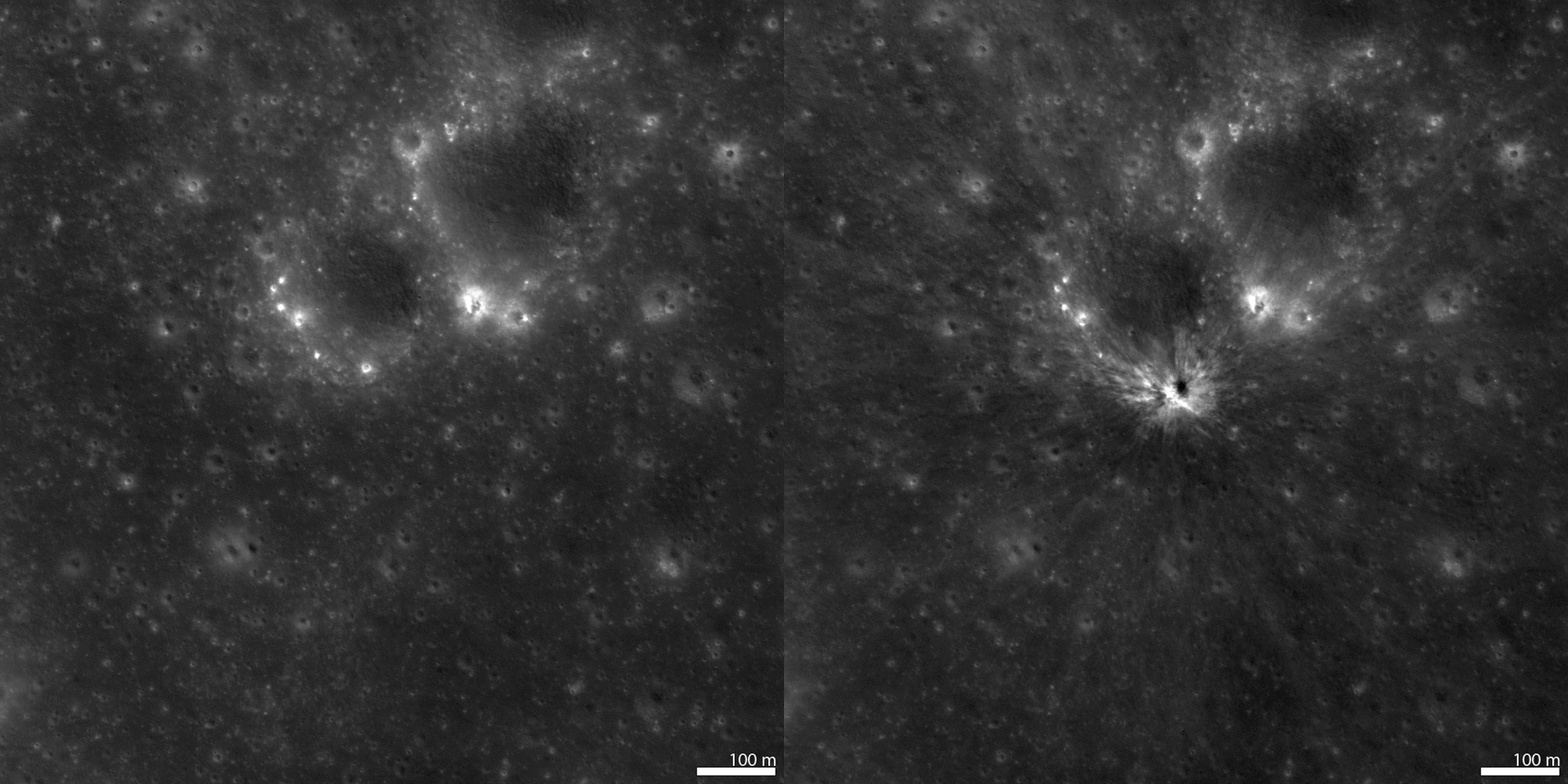
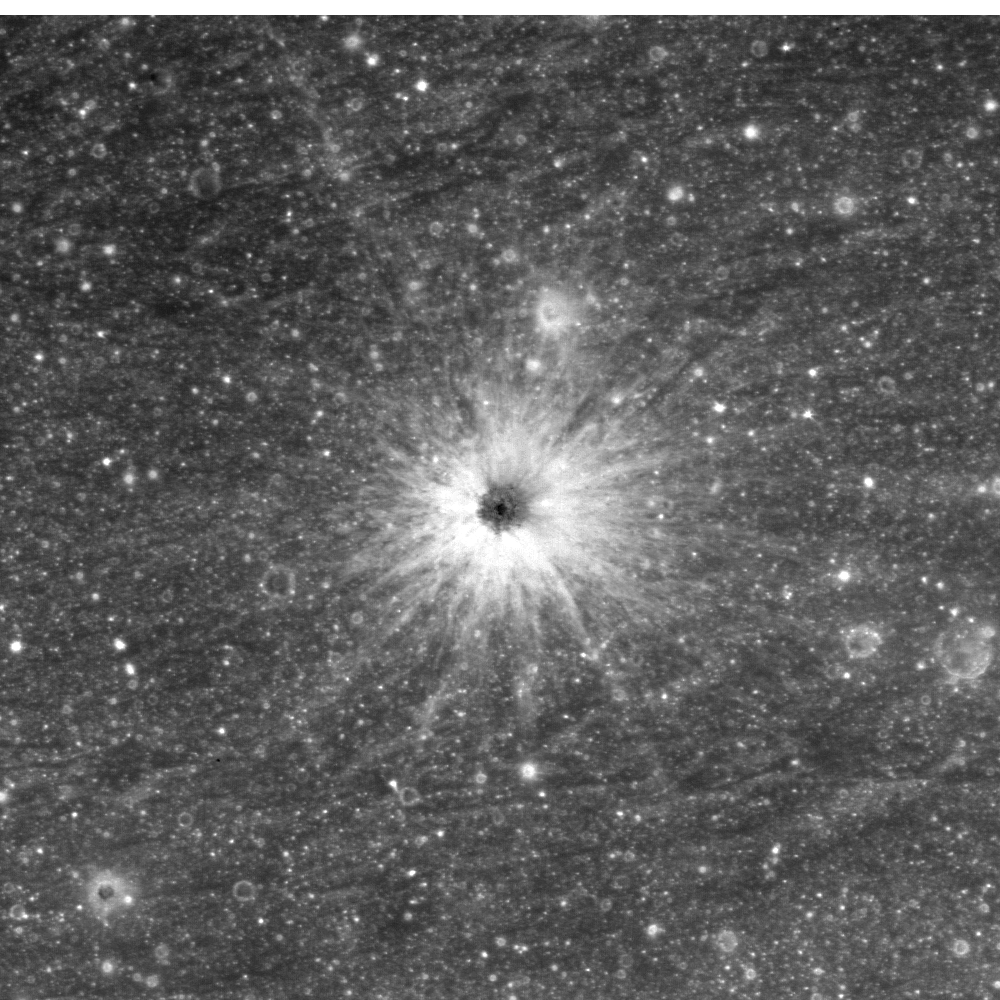
A new crater on the Moon, "found among so many." The bright flash of formation for this approximately 34 meter diameter crater was captured simultaneously by two Earthbound telescopes in Spain on September 11, 2013. From LRO, before-image LROC NAC observation M1119014742L, orbit 17116, March 27, 2013; incidence 23.66° resolution 82 cm from 84.41 km, After-image LROC NAC M1149637354L, LRO orbit 21423, March 16, 2014; incidence 23.18° resolution 91 cm from 89.12 km  [NASA/GSFC/Arizona State University].
Mark Robinson
Principal Investigator
Lunar Reconnaissance Orbiter Camera (LROC)
Arizona State University

On 11 September 2013 the "Moon Impacts Detection and Analysis System" (MIDAS) camera captured a bright 8-second long flash on the central nearside of the Moon.

This was the brightest event captured so far by the MIDAS team, and they estimated that the crater should be between 46 and 56 meters in diameter.

The LROC team targeted the reported coordinates (17.2°S, 339.5°E) of the flash and acquired several images over a few months until the crater was found in images acquired on 16 March 2014 and 13 April 2014.

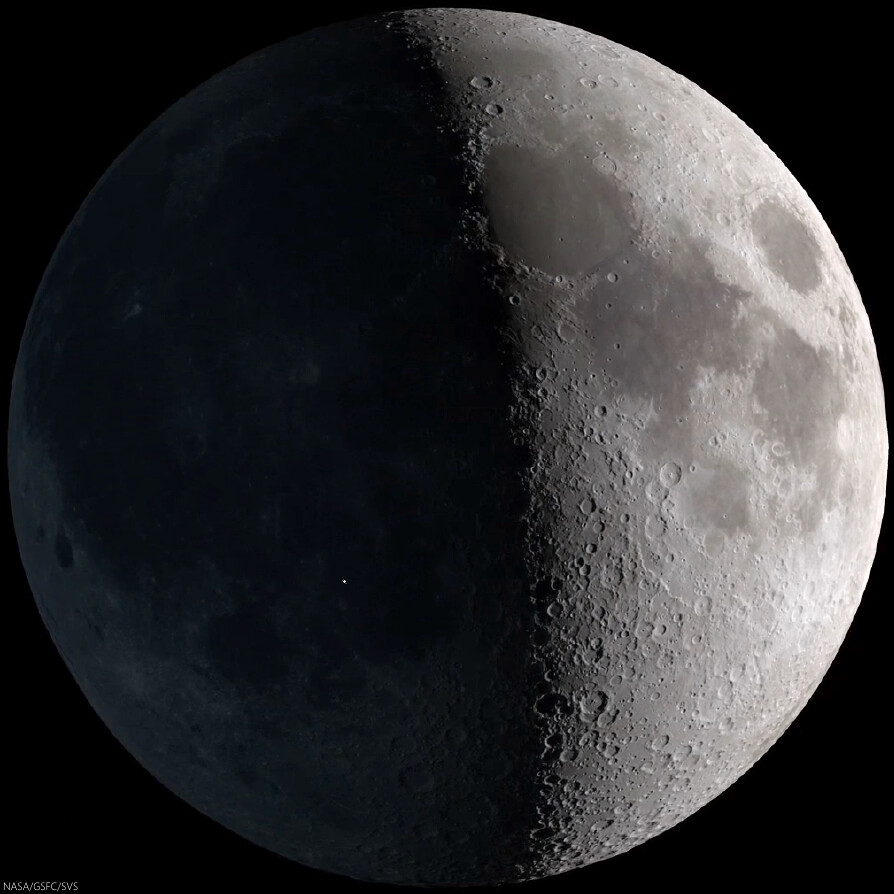
Strictly speaking, the 11 Sept. 2013 event was visible to the naked eye, though at nearly First Quarter the idealized reproduction above fails to account for the discriminating human eye. The illuminated east hemisphere would tend to have washed out Earthshine for all but those with the steadiest eyes. Fortunately, for at least ten years the unlit portion of the Nearside "visible" at night has been carefully monitored systematically, improving our understanding of hazards in the Near-Earth environment [NASA/GSFC/SVS].
Video sequence recording impact on the Moon's nearside in Mare Nubium. The magnitude of the explosion is estimated to have been roughly equal to that of Polaris, the North Star, and the recorded light curve following after lasted a remarkable eight seconds. Madiedo, et al. (2014) [IAA-CSIC/Universidad de Huelva].

Fortunately there was a NAC image of the target area acquired before the impact, so finding the new crater was relatively easy once an "after" image with comparable lighting to the "before" image was acquired.

As it turns out the new crater is ~34 meters (112 feet) in diameter and is located at 17.167°S, 339.599°E, only 2 kilometers (1.2 miles) from the original telescope-based prediction. In the before-after animation you can see ejecta effects from the crater extend out more than 500 meters in all directions!

See also LROC NAC image M1149637354L (16 March 2014).


Impact flash recorded on the unlit Nearside by Prof. Jose M. Madiedo, 11 Sept. 2013. North is to the right (note the visibility of Grimaldi, top center - the 173 km-wide walled plain is often the last recognizable feature on portion of the Nearside lit by Earthshine as the Moon waxes Full). The Moon was shy of First Quarter. This video was produced on the occasion of the publication (in Feb. 2014) in Monthly Notices of the Royal Astronomical Society (MNRAS) of the paper entitled "A large lunar impact blast on 2013 September 11," by J.M. Madiedo, J.L. Ortiz, N. Morales and J. Cabrera-Caño.

A longer, more instructive version was uploaded by the authors HERE

Wide Angle Camera morphology basemap overlaid with color-coded LROC GLD100 topography centered on the 11 September 2013 impact crater. The large crater just visible in the lower left is 60 kilometer diameter crater Bullialdus [NASA/GSFC/Arizona State University].
Revisit the LROC NAC image of new crater formed on 17 March 2013, HERE.

Read the paper describing the 11 September 2013 observation (Madiedo et al., 2014)

Thursday, June 12, 2014

Study in superpositioning at Vavilov D

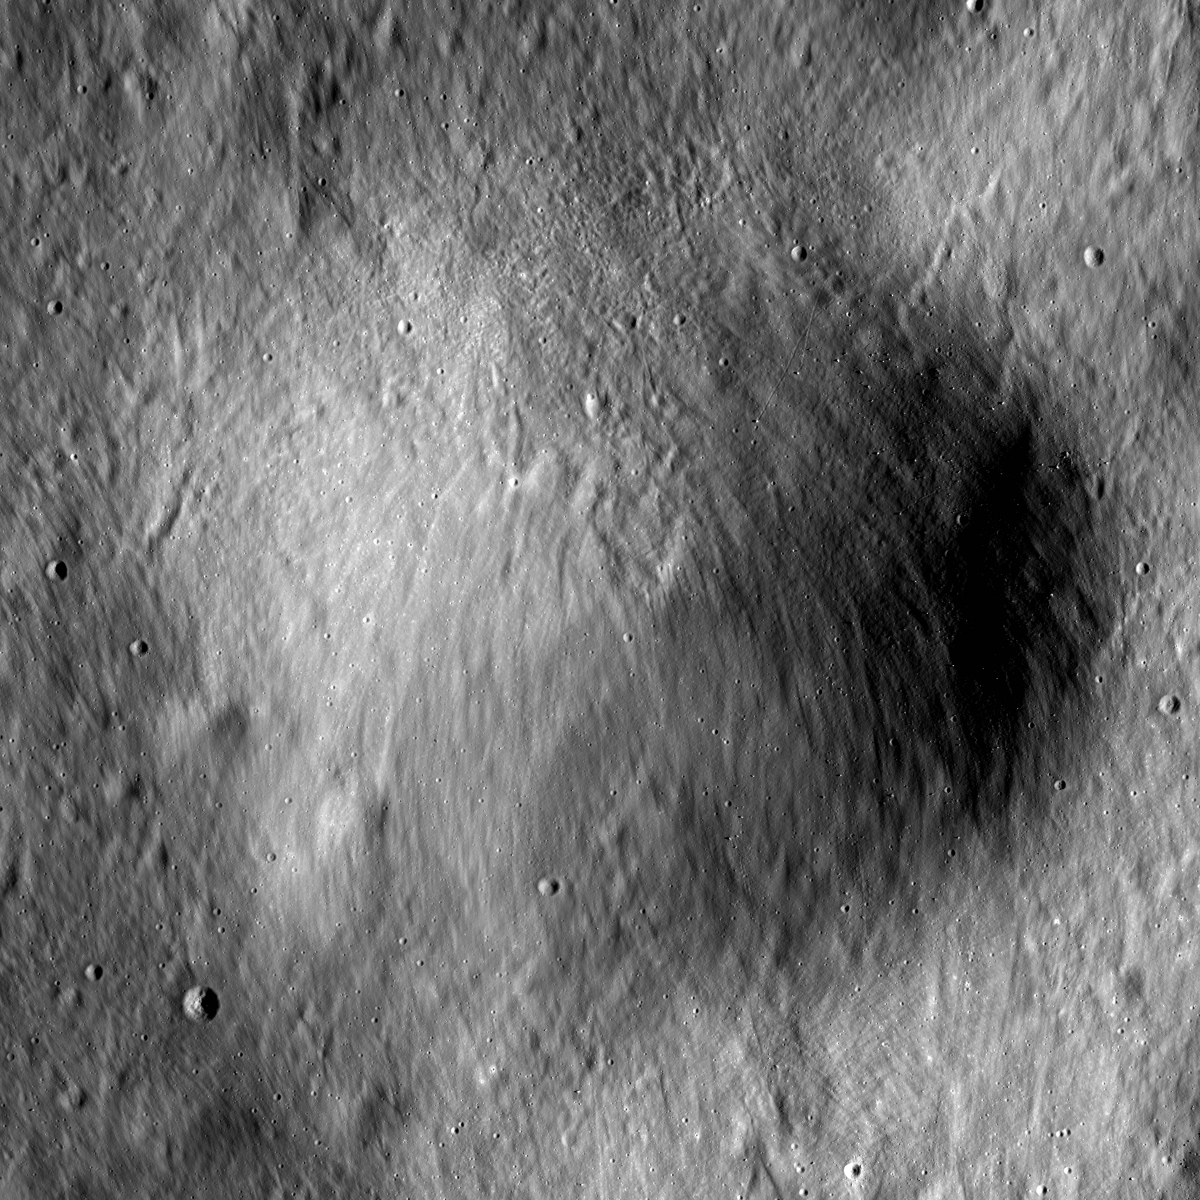
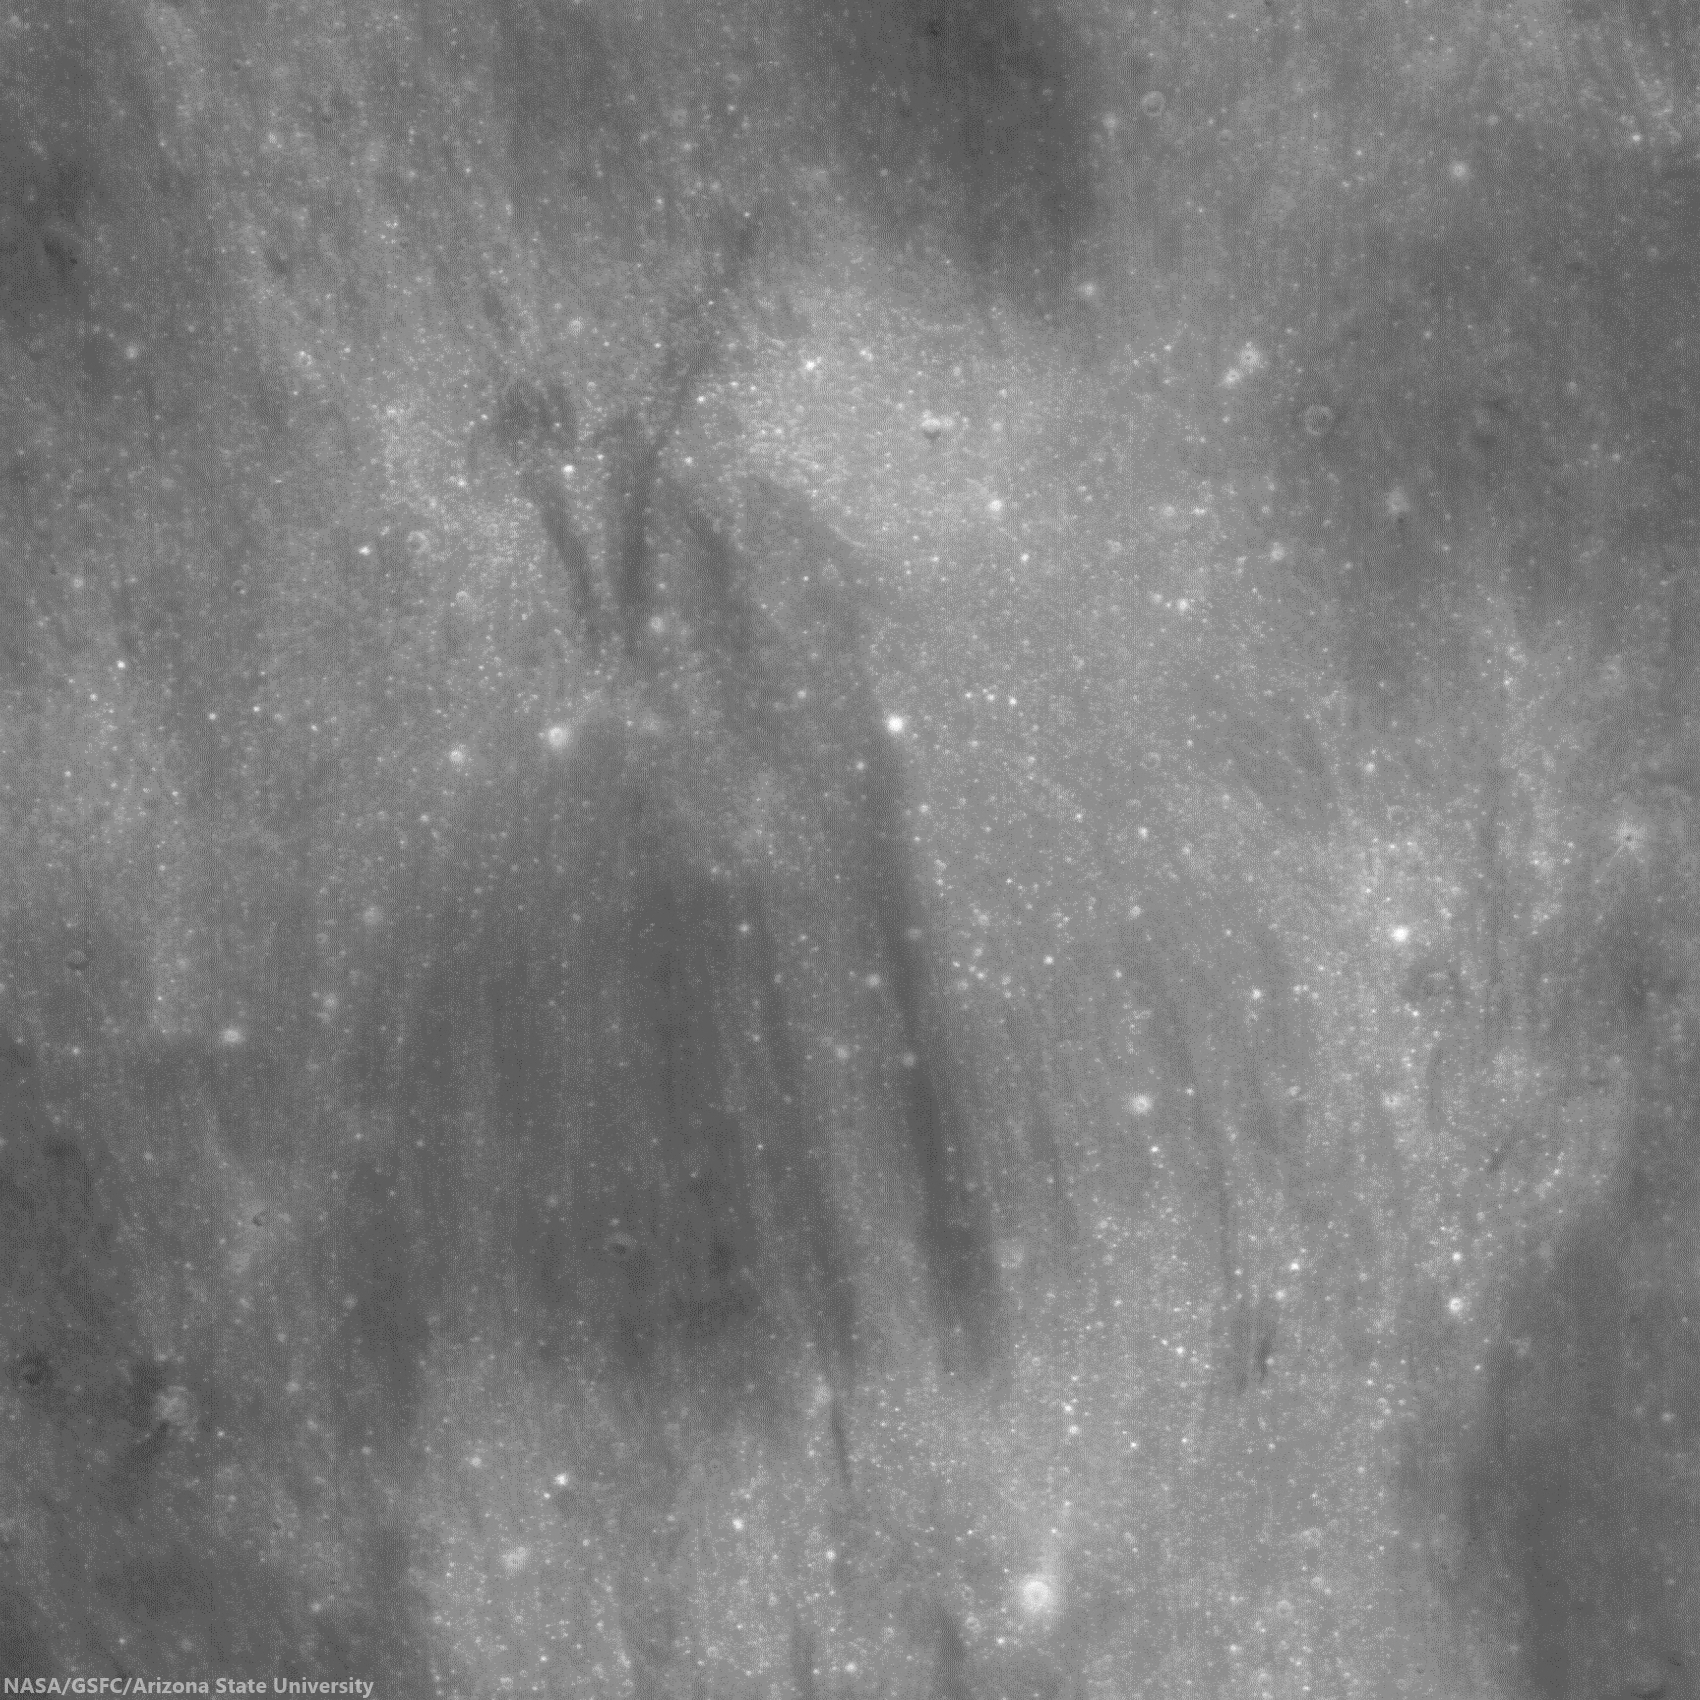
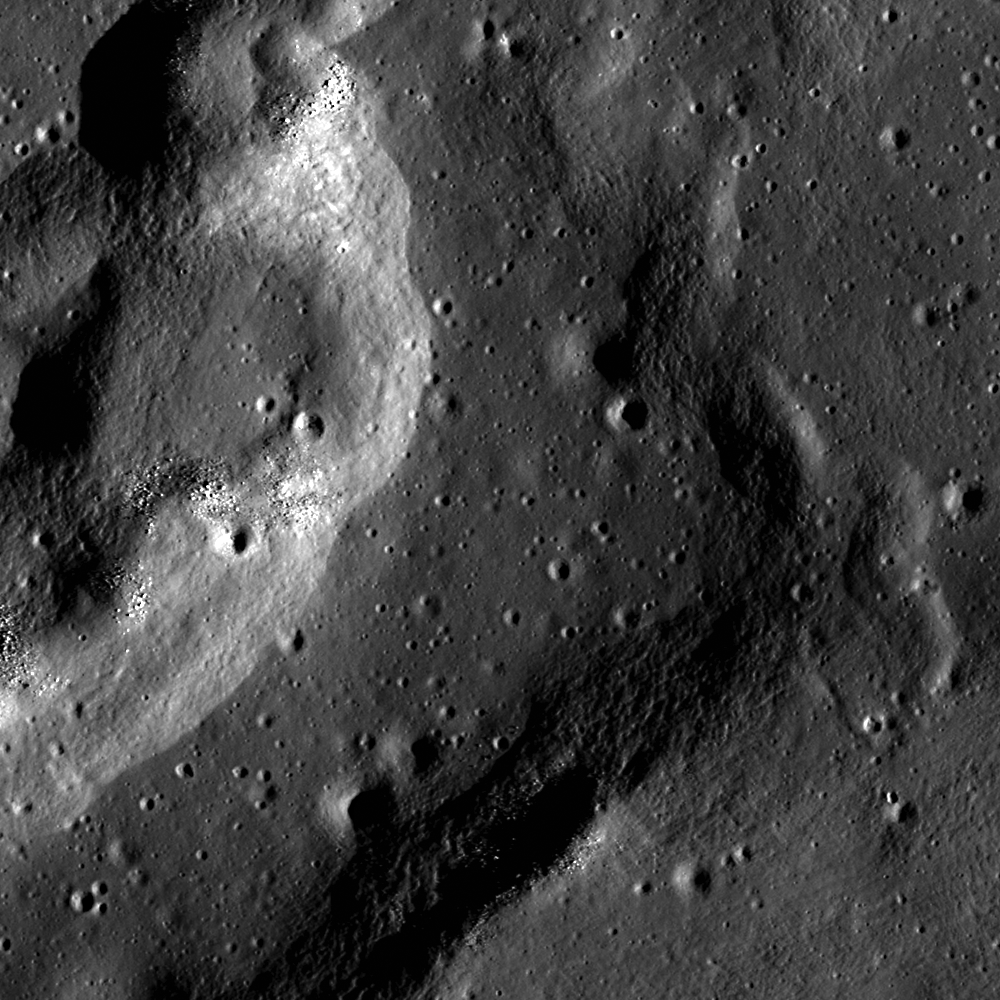
Sunrise, sunset. LROC NAC observations 10 months apart, one at local sunset and the other after local sunrise, both from nearly identical altitudes and resolutions, capture these views of double "dingleberries," drops of hot melt, very likely from the impact that created Vavilov crater, sit where they quickly flattened and cooled, just inside the steep slope of ancient Vavilov D. The Vavilov craters are a study in stratigraphy and superposition [NASA/GSFC/Arizona State University].
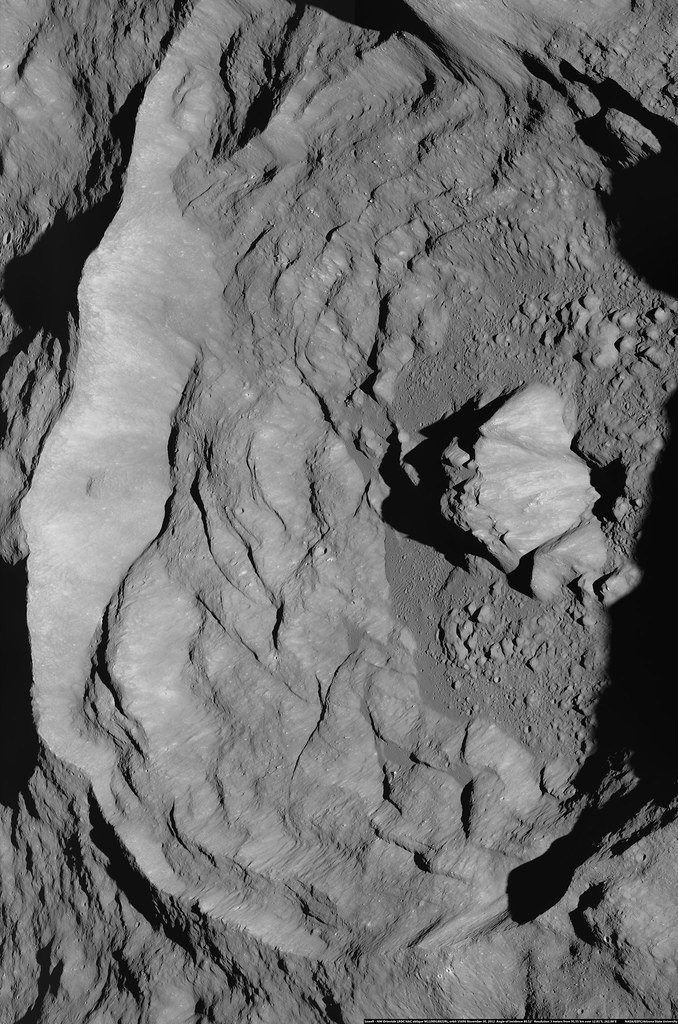
Immediately inside the northwest rim of highly degraded Vavilov D, twin disks of impact melt, likely from the formation of Vavilov, came to a standstill at the upper end of a contiguous slope of 5000 meters elevation, over about 40 km, into the complex floor of the latter Eratosthenian crater. This 1400 meter field of view (down slope is to the lower right, centered on 1.14°N, 221.536°E) from LROC NAC observation M1128031686L, LRO orbit 18385, July 9, 2013; 61° incidence angle, resolution 1.17 meters from 114.6 km [NASA/GSFC/Arizona State University]. 
Hiroyuki Sato
LROC News System

Vavilov D is an heavily degraded crater (96.1 km; 0.026°N, 220.93°E) sits between the Orientale basin and Jackson crater, both of which it may pre-date.

The later formation of the nearly identical, over-lapping Vavilov crater (98.2 km; 0.87°S, 221.23°E) eradicated the entire southwestern half of Vavilov D.

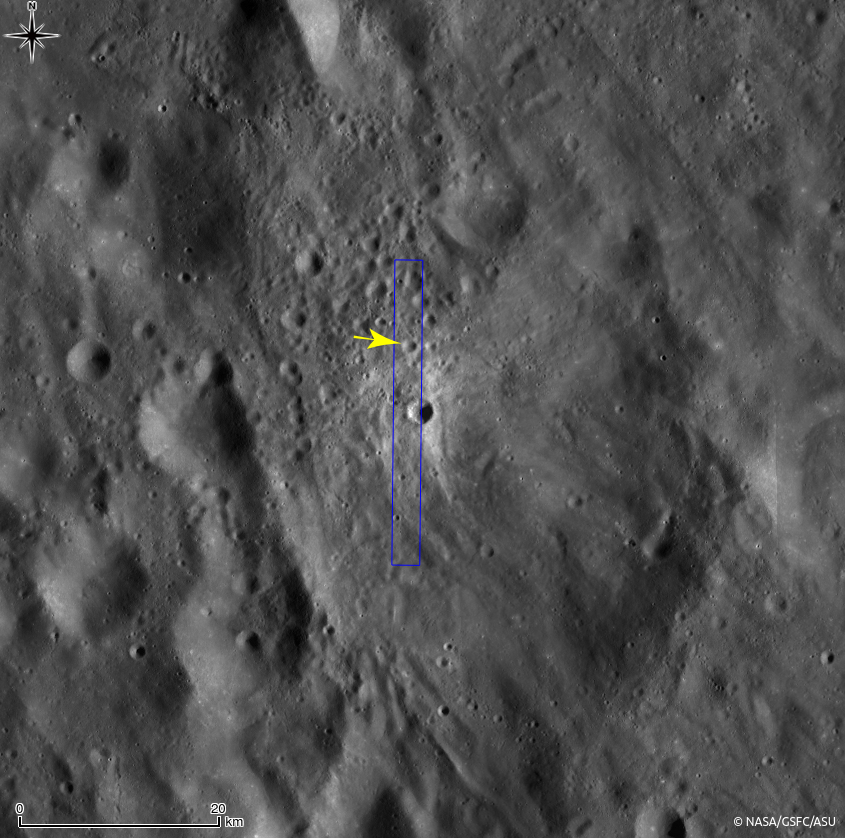
The second image above spotlights a spot on the northwestern curve of the wall of Vavilov D near where the Eratosthenian Vavilov erased the older crater's anatomy. The relatively smooth textured area in the upper left corresponds to the outside of Vavilov D, and the rest of rough/craggy surface is the interior crater wall's steep slope. 

The two degraded craters (~280 m in diameter) near the middle of the opening image exhibit fascinating overlying smooth features that may have formed as material flowed downslope (arrows).

View the full-resolution original HERE. The twin melt disks are located where the rim of Vavilov superseded that of Vavilov D, in the farside equatorial highlands,  where Vavilov is etched into terrain 8000 meters above the global mean elevation. It's possible an astronaut could walk from this location south into the interior of Vavilov. 5.6 km-wide field of view from LROC NAC observation M1128031686L [NASA/GSFC/Arizona State University].
Other morphologic pits/dents on this slope also have similar textures. What we are seeing here are most likely remnant impact melt that was thrown out of the Vavilov crater. Craggy sloped surfaces with patches of smooth material are often found associated with young impact craters -- formed as impact melt flowed over and around the newly formed crater.

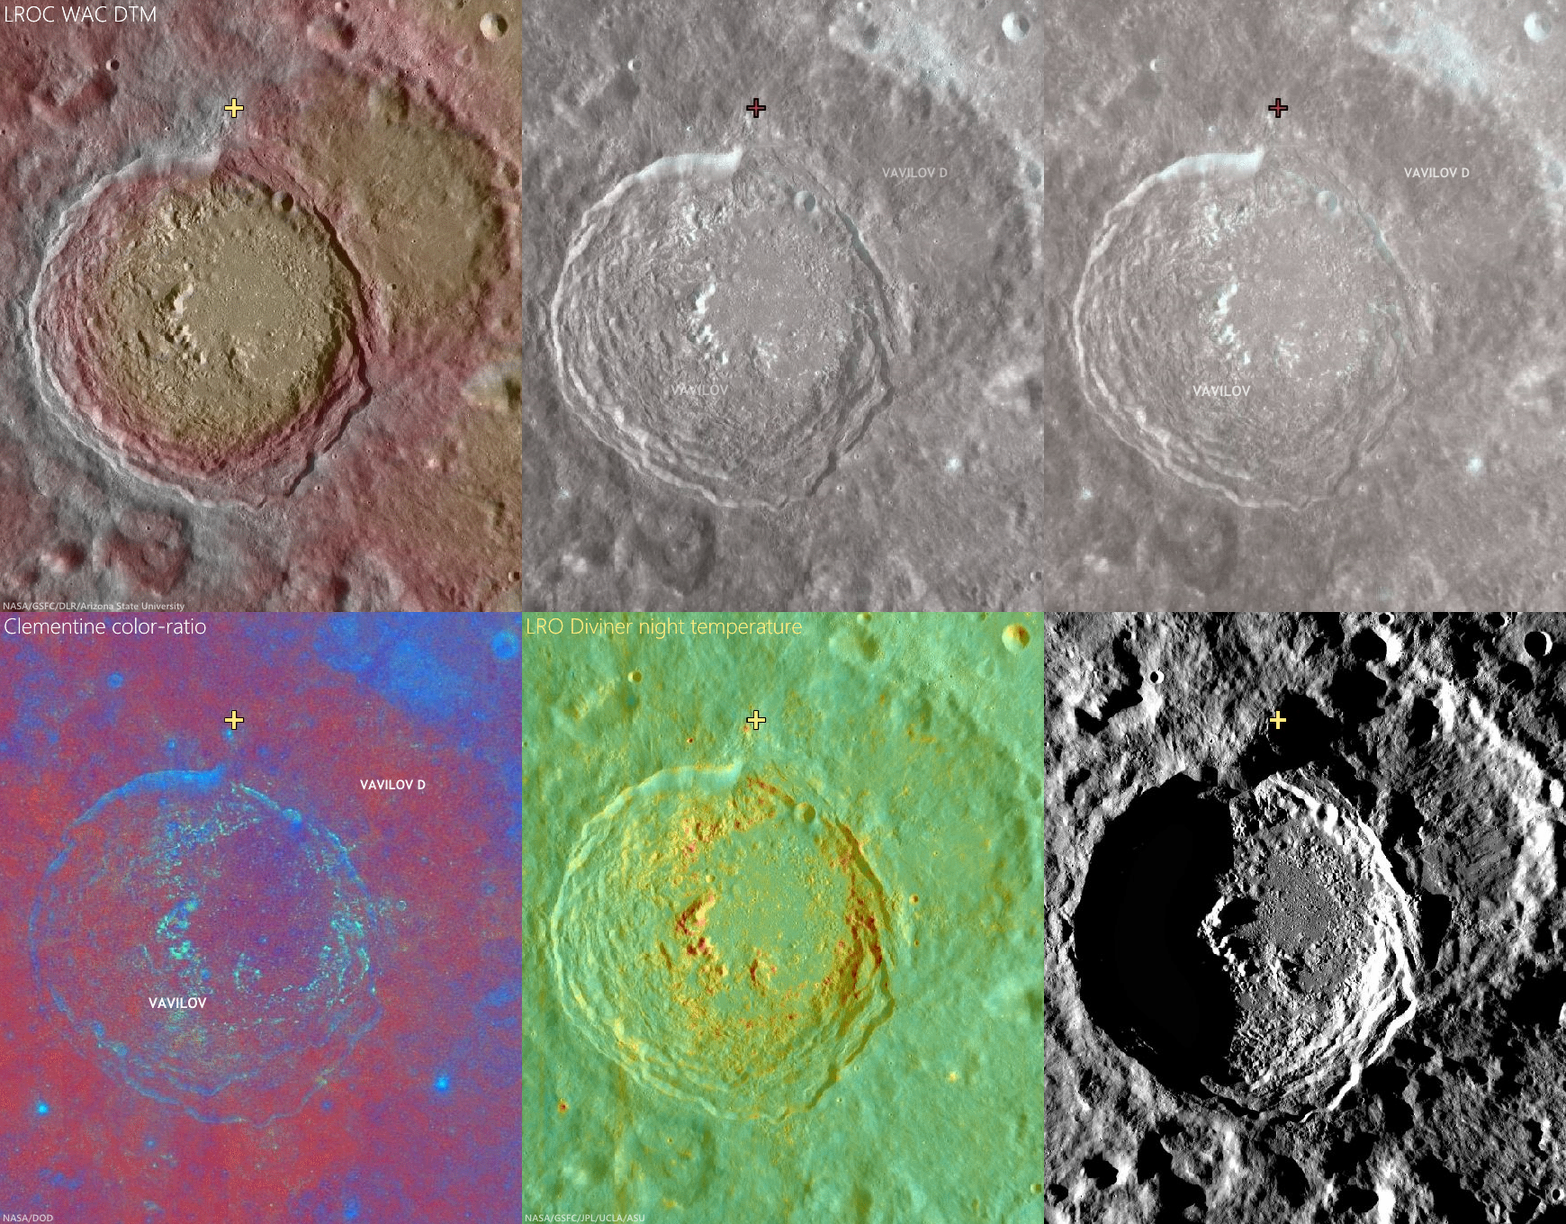
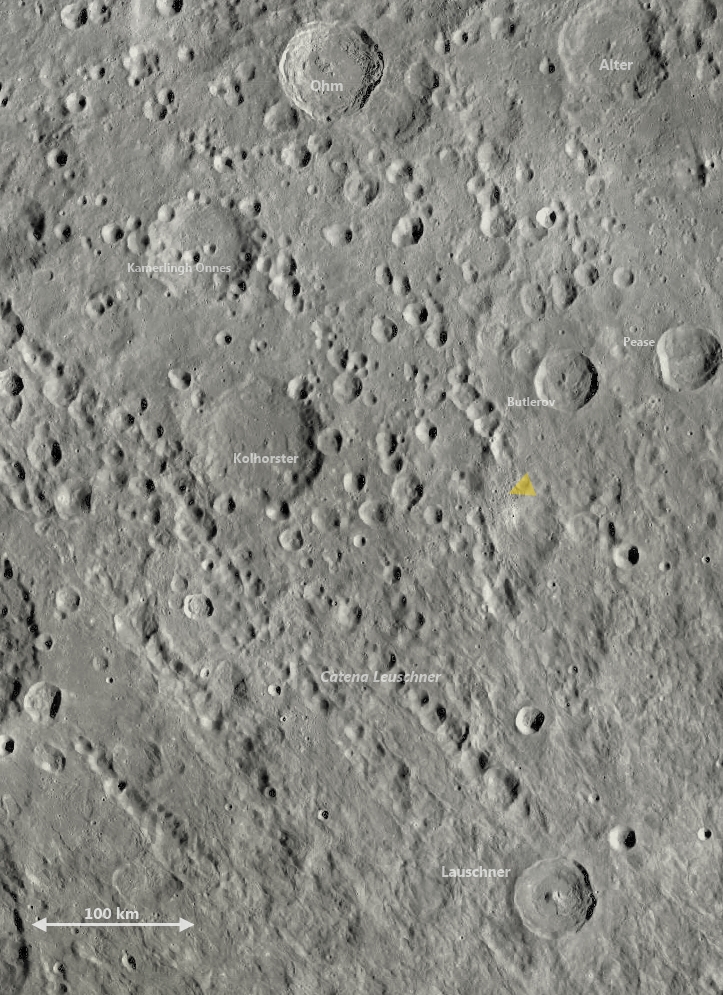
The deepest material brought to the surface by impacts on the Moon is found on the resulting crater's rim. A fresh crater near our area of interest, on the rim of Vavilov D (cross), exposes material excavated by that ancient impact, and Vavilov D, in turn, is nested on the Hertzsprung basin. The larger region is also at the outside range of the majority of secondary craters from the Orientale basin-forming impact. LROC Quickmap mosaic [NASA/GSFC/Arizona State University].
Depth of field in lunar photography is a fleeting quality. With the LROC WAC-derived elevation model (GLD100), however, the super-positioning of Vavilov D (and an aeon or two later, Vavilov) on Hertzsprung is much easier to detect, along with some of the most extreme elevation ranges, some 9 km above the global mean [NASA/GSFC/DLR/Arizona State University].
Related Posts:

Thursday, October 24, 2013

Ground hugging ejecta, northwest of Mare Orientale

LROC Featured Image 24 Oct 2013
Ejecta deposit of an unnamed crater  approximately 2.7 km in diameter 5 km south of this 567 meter-wide field of view centered on 9.80°N, 250.06°E. LROC Narrow Angle Camera (NAC) observation M130008764R, LRO orbit 4293, June 1, 2013; 57 cm per pixel resolution from 54.75 km, camera and spacecraft slewed 5.43° from nadir [NASA/GSFC/Arizona State University].
Hiroyuki Sato
LROC News System

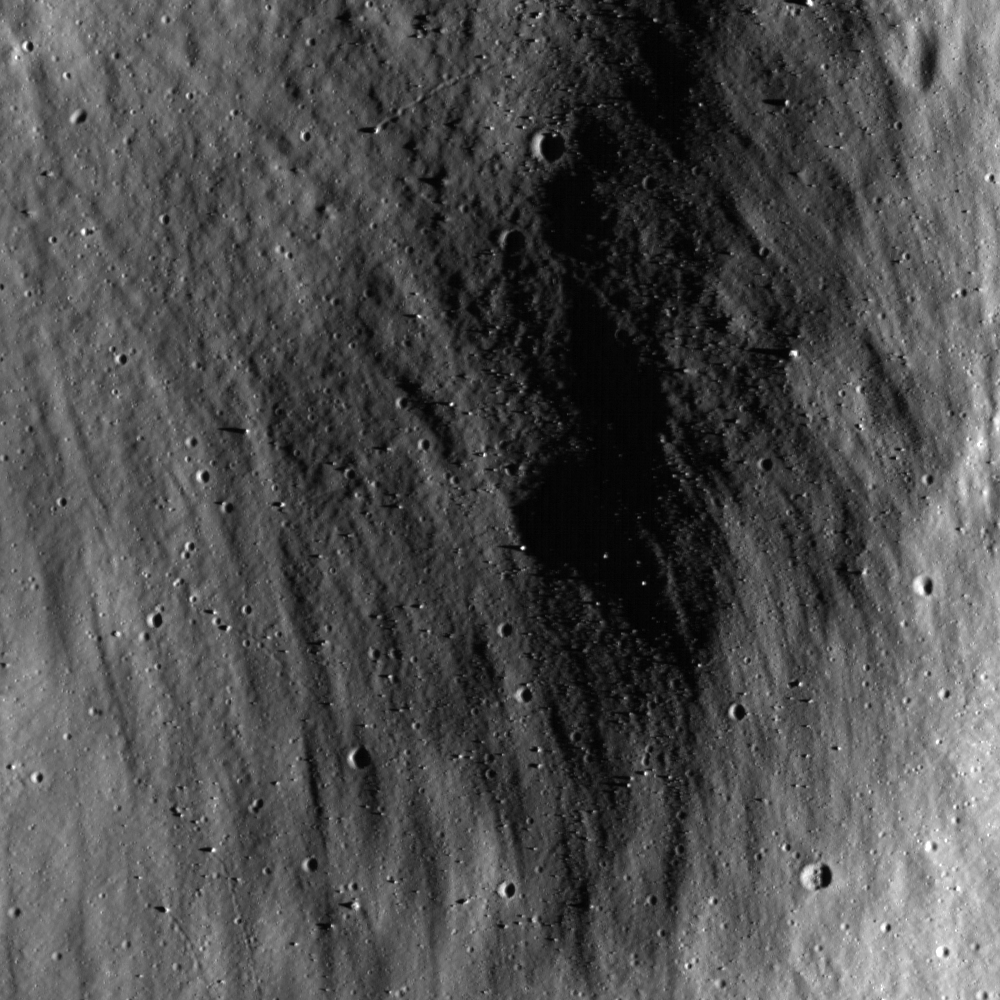
Today's Featured Image highlights the northern portion of the ejecta deposit splashed from an unnamed crater (~2.7 km in diameter, about 5 km south of this image) located in the highlands ~800 km northwest of Mare Orientale. The curved stripes from the bottom toward the upper-left of this image represent the flow direction of ground hugging ejecta deposits.

As shown in the classic impact cratering model, the ejecta is ballistically sprayed out of the impact center forming an ejecta curtain. After the ejecta curtain impacts the outside of the crater, it flows in a ground hugging horizontal motion until its kinetic energy is completely dissipated. The ejecta direction depends on flow speed and the local topographic slopes or undulations.

M130008764R_context2-1200
Wider 1.8 km field of view from LROC NAC M130008764R, highlighting ejecta deposits gushed into an bowl shaped topographic low [NASA/GSFC/Arizona State University].
M186606026LR-NSJ-1106-1700
Nearly the same field of view with the Sun overhead results in an image that puts the emphasis on albedo over topography (see the wide context in the image below), LROC NAC M18660602LR, LRO orbit 12574, March 17, 2012; angle of incidence 8.05° at 1 meter per pixel resolution, from 120 km [NASA/GSFC/Arizona State University].
M186606026LR-NSJ-1106-58b-16p-1325x1828
8280 meter-wide field of view from LROC NAC M186606026LR puts the highlighted topographical low in context with the source of the ejecta blanket from the fresh crater 5 km south [NASA/GSFC/Arizona State University].
M130008764R_context-580x800
Further context on the unnamed crater and surrounding ejecta from a LROC Wide Angle Camera (WAC) monochrome mosaic (100 meters per pixel) centered on 9.34°N, 250.08°E. The LROC NAC M130008764R footprint and location of the field of view shown at high resolution in the LROC Featured Image are designated [NASA/GSFC/Arizona State University].
As seen in this second image, the flow direction of ejecta curved along a bowl shaped topographic low (probably a degraded old crater). These characteristic flow lines following the local topography allows scientists to estimate the actual flow speed. In turn, these estimates elucidate detailed mechanisms of ejecta emplacement on the Moon and by comparison other airless bodies, such as asteroids and the planet Mercury

VMA-GHEj20131024-58b-723x995
Much wider context from LROC WAC (GLD100) mosaic puts the are of interest well within the secondary bombardment ejecta originating from the basin forming impact that created Mare Orientale [NASA/GSFC/Arizona State University].
Explore these illuminating ejecta flow patterns in full NAC frame, HERE.

Related Posts:
Dynamic Textures
Ejecta Patterns
Lassell D Ejecta
In the Wake of Giordano Bruno
Scalelike Impact Melts
Delicate patterns in Giordano Bruno ejecta
Swarm of Secondaries
Swept Surface

Tuesday, August 20, 2013

Karpinskiy, superpositioned on the farside north

Karpinskiy WACGLD 100m
LROC Wide Angle Camera (WAC) mosaic overlaid with WAC and NAC-derived GLD100 color-coded digital elevation model. Karpinskiy crater is approximately 90 kilometers across and nested within the remains of an even larger and more ancient crater [NASA/GSFC/Arizona State University].
Raquel Nuno
LROC News System


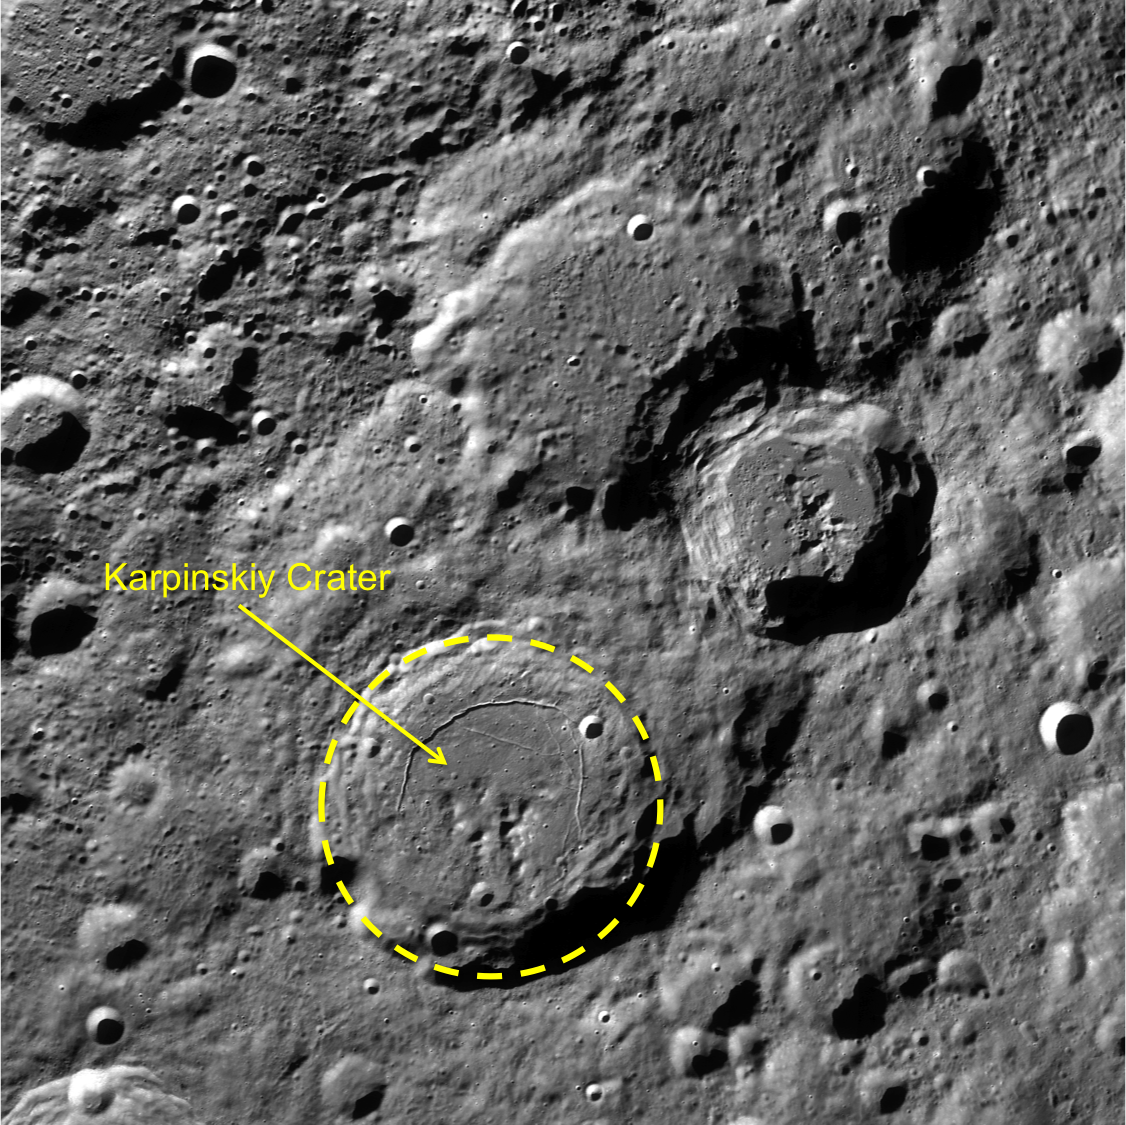
Karpinskiy crater, at 72.609°N, 166.801°E and (officially 91.403 km) in diameter, rests within a larger and far older unnamed crater. How do we know which crater is older? Stratigraphic studies, or the study of superposition of rock layers (or in this case, craters), will help determine the relative ages of craters here. Geologists derive relative ages between geological features by observing how they overlap - young formations will always overlie older formations, and on airless bodies, such as the Moon and Mercury, this method becomes particularly useful. Without wind to erode its surface, only four factors affect the lunar surface: space weathering, impacts, tectonism, and volcanic resurfacing. With respect to today’s Featured Image, the Moon accumulates impact craters over time. From the cratering record we can investigate not only stratigraphic relationships (which crater formed first), but we can also derive a quantifiable measure, or crater density, to determine relative ages on the Moon.

Karpinskiy passes under Kaguya
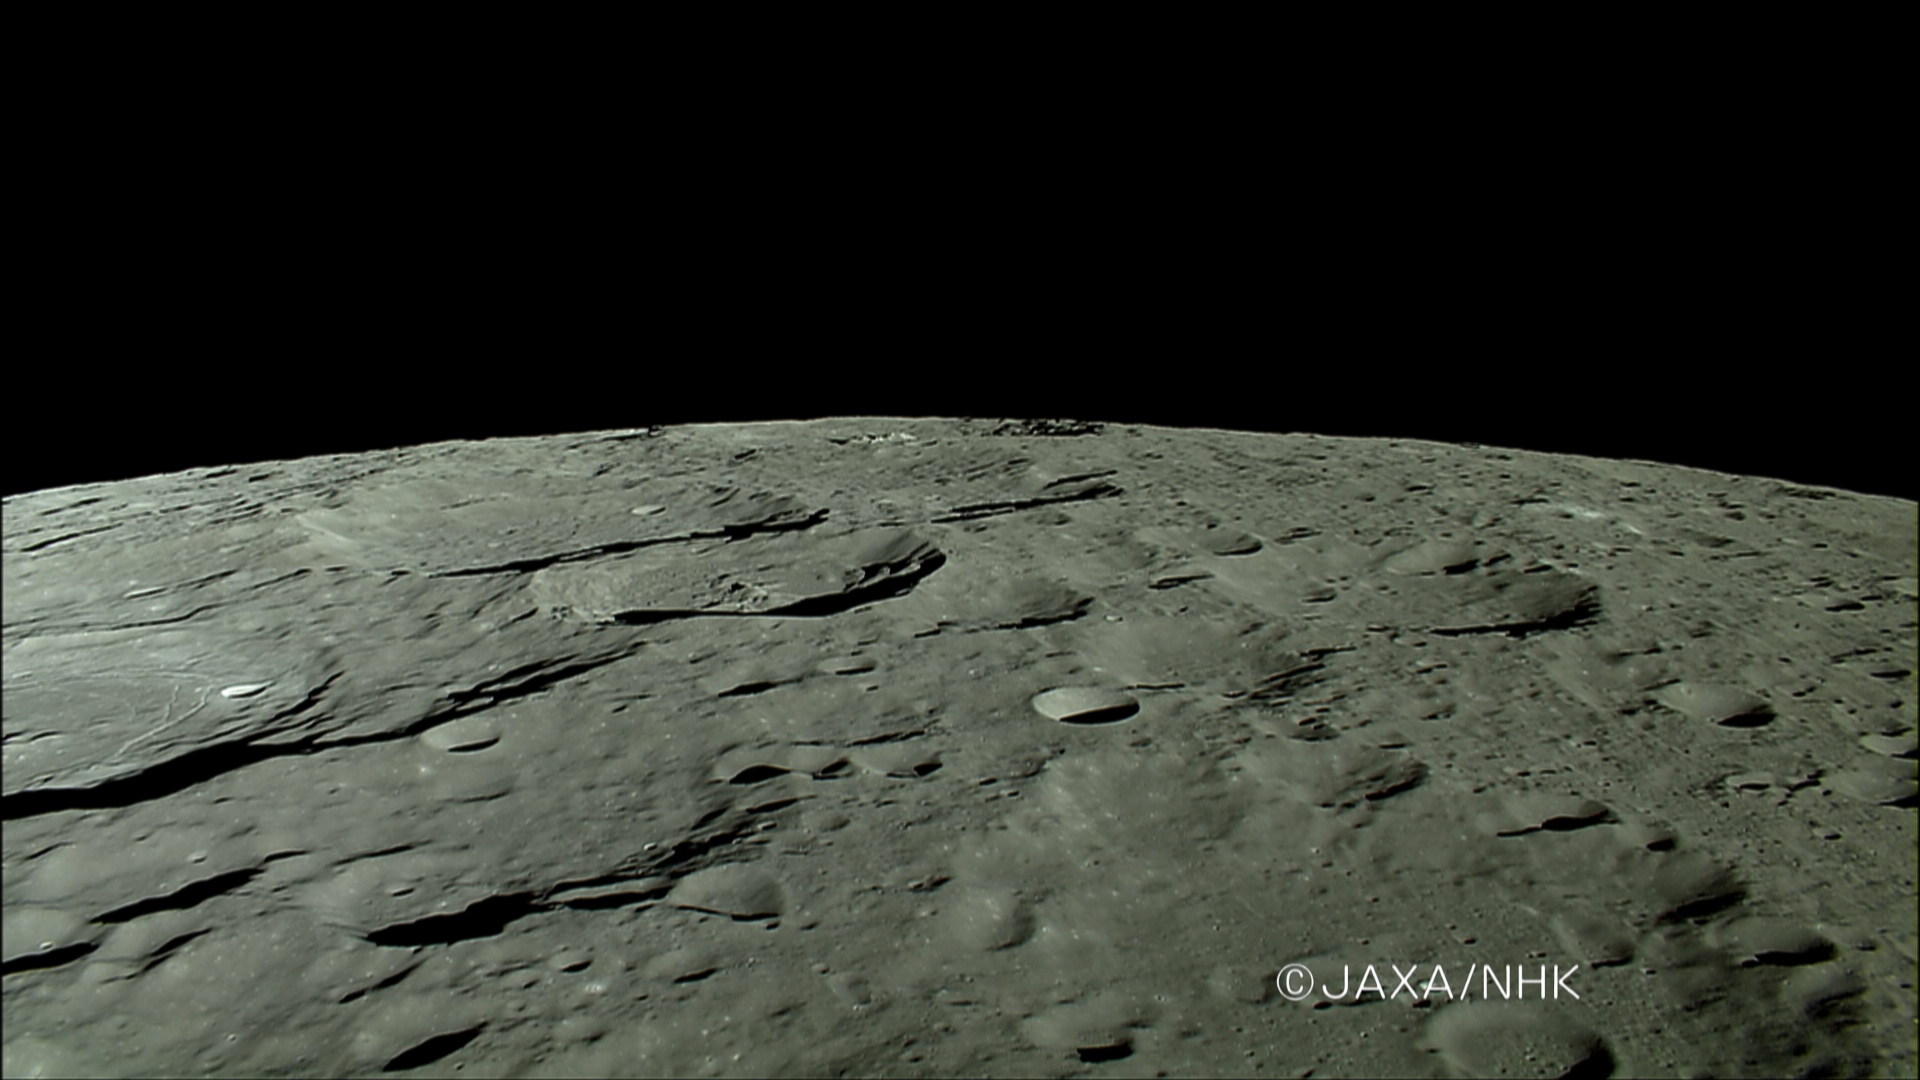
The HDTV camera onboard Japan's lunar orbiter Kaguya (SELENE-1) anticipates a rising Earth in 2007, looking north toward the Moon's north pole as it passes ancient craters of the Farside Highlands Terrain, including Karpinskiy, nested in a much older crater, passing out of view at left, followed by Milankovic and Plaskett. View the full-size image HERE [JAXA/NHK/SELENE].
Today’s Featured Image is a great example for stratigraphic studies. The LROC WAC mosaic of Karpinskiy crater overlaid with the GLD100 color topography presents a clearer outline of the older crater (WAC mosaic below). The top portion of the image is black because the GLD100 product does not have coverage at that latitude (>79°N). Karpinskiy crater is located inside a much older, degraded crater that does not have a well-defined rim and is somewhat difficult to see in the WAC mosaic. Karpinskiy is younger because it superposes, or formed on top, of the unnamed older crater. There are younger craters superposed on the floor of Karpinskiy, that must have formed later and are therefore younger based on the relative age relationships. Thus, using stratigraphic relations we are able to derive a relative age for Karpinskiy, but what if we want to determine the absolute age? The number of craters that formed on Karpinskiy can be used to estimate its absolute age, however with such a small area the crater size frequency distribution absolute age estimate has a large uncertainty. To accurately determine the absolute age of Karpinskiy crater we have to go there and acquire samples of impact melt rock that we can radiometrically date!

Karpinskiy WAC superposition context
LROC WAC context image. Karpinskiy crater outlined in yellow, with the two neighboring craters to the north and east are Ricco, Milankovic and Milankovic E[NASA/GSFC/Arizona State University].
Explore the full image, HERE.

Related Posts:
Absolute Time
Copernicus Crater and The Lunar Timescale
Dating an Impact

Monday, August 19, 2013

Oblique look deep into the heart of Lowell crater

Lowell (LROC oblique)
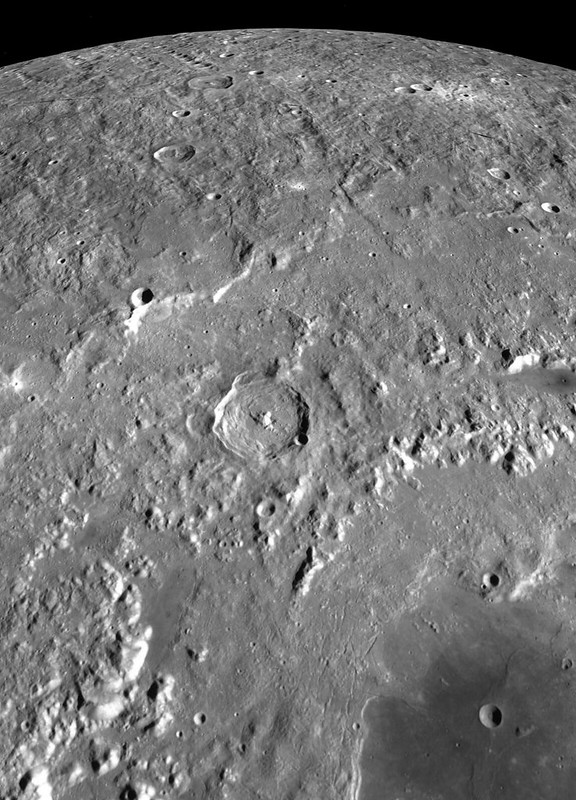
Oblique LROC Narrow Angle Camera (NAC) mosaic of Lowell crater (62.65 km - 12.96°S, 256.58°E), super-positioned (or is it?) on the northeast quadrant of the Orientale basin. LROC NAC observations M1108918822R & L, spacecraft orbit 15696, November 30, 2012; angle of incidence 80.52° averaging 3 meters per pixel resolution (spacecraft and camera slew -62.35° from 91.55 km over 12.81°S, 262.88°) [NASA/GSFC/Arizona State University].

Named for the one and only Percival Lawrence Lowell (March 13, 1855 – November 12, 1916), popularizer of Mars lore in the late 19th century, and celebrated in part also by Clyde Tombaugh when he chose a name for "Pluto" in 1930, in the first two letters of that now "former planet's" Olympian moniker.
ILIADS-Lowell-2-1159x1611
Looking north over Lowell and the northwest Orientale basin. LROC Wide Angle Camera (WAC) global mosaic draped on LOLA laser altimetry using NASA ILIADS application [NASA/GSFC/MSFC/ASU].
Related Posts:
Oblique views of Moon's highest and lowest places (October 3, 2012)
Impact melt lobes (April 12, 2012)

Friday, March 29, 2013

Bright small crater ejecta - with a black eye

Fifty meter crater with bright ejecta extending several crater radii. The dark deep interior of the crater could be the disk of of an impact melt pond Field of view 1000 meters across from LROC Narrow Angle Camera (NAC) observation M1117189620R, LRO orbit 16860, March 6, 2013; 0.9 meters resolution [NASA/GSFC/Arizona State University].
Drew Enns
LROC News System

Our impressions (and interpretations) of surface features on planetary bodies are affected by the way they interact with sunlight when we image them.

For instance, the shape of a crater is brought out by shadows in large incidence angles (Sun near the horizon) images.

In today’s Featured Image, we are observing a crater with the Sun nearly directly above the surface. This type of image (small incidence angle) helps scientists understand the physical properties of the surface. Why might the ejecta blanket of the crater be highly reflective? Why is the interior have a much lower reflectance? Two different surface properties could be affecting what we see. First, 'fresh' material should be brighter than surrounding material. And second, the composition of materials affects how they reflect light (see albedo).

A similar, somewhat larger crater for comparison - one also considered to be relatively fresh - in Oceanus Procellarum, northeast of the central eye of the Reiner Gamma albedo swirl. The explicit central melt floor, or disk, may resemble the less clearly resolved fresh crater spot-lighted in this post. You can read the feature story about this comparable crater HERE. LROC NAC observation M111972680L [NASA/GSFC/Arizona State University].
LROC Wide Angle Camera (WAC) context of the region around the small crater highlighted in the LROC Featured Image, located near the red cross (3.022°N, 258.698°E). Image field of view roughly 85 km [NASA/GSFC/Arizona State University].
In the case of today's Featured Image, the crater looks very young. We have some stratigraphic evidence for this as the crater is sitting on top of a larger flesh unnamed crater's ejecta deposit (see context image below).

A quickly put-together crop from the Chang'E-2 (CNSA/CLEP) global medium resolution mosaic, highly emphasizing albedo over the relief made visible by long shadows. Even old and deep craters in this 170 km-wide field of view north of Mare Orientalis seem to disappear under the low solar incidence. If the ejecta blanket from the unnamed crater near center were just a little further east and clearly on the Moon's nearside it would rival the similarly bright ejecta from Tycho, Copernicus or Brygius A. The small crater, clearly overwhelmed in this crop, is marked by a small "X" on he theouter slope of Lents (Lenz) C.
Therefore the brightness of the ejecta blanket is likely due to the young nature of the crater! But that doesn't solve the problem of the crater's interior. The interior could have been mantled by a thin veneer of impact melt which then pooled in the center. We know from many examples that impact melt rock reflects less light than its source material.

The small crater (arrow), situated on the ejecta blanket of a fresh crater further east which, in turn, sits on the wide outer reaches of the Mare Orientalis impact basin. View toward the south, [NASA/ILIADS/LMMP].
The impact melt hypothesis is not certain, though a follow up image at a larger incidence angle to help us understand morphology and could certainly help test this hypothesis!

Explore more ejecta in full the NAC frame, HERE.

Related Posts:
Ejecta Starburst
Swept Surface
Symmetric Ejecta
Shades of Grey

Wednesday, February 13, 2013

Wrinkle Ridge in Mare Crisium

A complex wrinkle ridge in Mare Crisium at low Sun (angle of incidence 72.8° from the east). Boulders occupy the tops of mounds on the west ridge, and the central depression is more heavily cratered than the ridge. LROC Narrow Angle Camera (NAC) M146573730RE, LRO orbit 6734, December 9, 2010; field of view 700 meters at 89 cm resolution from 43.27 km [NASA/GSFC/Arizona State University].
Drew Enns
LROC News System

Wrinkle ridges are complex structural features that tend to develop in contracting regions of the Moon. Unlike lobate scarps (also contractional structural features), wrinkle ridges are thought to result from a mix of folding and faulting.

A buried thrust fault cuts through the mare, but not completely. Instead of breaking the surface, the fault pushes material upwards and causes the mare to fold over the fault.

This folding leads to a wide variety of wrinkle ridge morphologies. Despite this variation, all wrinkle ridges are made up of a larger ridge with a smaller superposed ridge.

A reproduction from the full 2.3 km-wide field of view, including the area at full resolution in the LROC Featured Image released February 13, 2013. LROC NAC M146573730R [NASA/GSFC/Arizona State University].
LROC Wide Angle Camera context image for the LROC Featured Image, highlighting the anatomy of the wrinkle ridge at 16.09°N, 61.68°E. Several other wrinkle ridges are nearby, each with a distinctive form. There are hints also of ghost craters and the kind of volcanic vent structures characteristic of the Marius Hills [NASA/GSFC/Arizona State University].
So when did all of these wrinkle ridges form?

The law of superposition argues that they must be younger than the mare basalt they deform. The basalts in Mare Crisium range in age from 2.5 to 3.3 billion years old!

These dates come from measuring the radioactive isotopic systems of samples returned by the Soviet Luna 24 mission. If these dates are correct and representative of the surface, the wrinkle ridges here formed after the basalts were deposited. Did the ridges start forming after 2.5 billion years? Probably not. Several mare flows also 'pond' behind wrinkle ridges, so the wrinkles must predate at least some mare material and potentially formed over the same time period. One billion years is a long time to go without tectonic deformation after all. One thing is probable, the wrinkle ridges continued developing after mare volcanism shut off in the area.

Explore more of the wrinkle ridge in the full LROC NAC, HERE.

Related Posts:
Bulging Wrinkle
Tectonics in Mare Frigoris
Relative Age Relationships

Friday, January 25, 2013

Geological mapping of another world

Eugene Shoemaker with some of the first geological maps of the Moon, in Flagstaff, Arizona during the mid-1960's
Paul D. Spudis
The Once & Future Moon
Smithsonian Air & Space

Many people are surprised when they learn that well before the first landing of Apollo in 1969, we already understood the geological history of the Moon.  The idea that such a thing was even possible drew considerable skepticism during early preparations for landing on the Moon.  The principles for the remote mapping of the geology of the Moon came from several closely related but distinct threads.  Eugene M. Shoemaker, a geologist with the U. S. Geological Survey (USGS) who founded the Branch of Astrogeology, laid out the methodology in broad outline from and through the systematic study of lunar surface images in the early 1960s.

One of the basic principles of geology is that younger rocks lie on top of (or intrude into) older rocks.  Interestingly, this relationship can be discerned from a photograph.  In the case of the Moon, images show the dark smooth plains of the maria (lava) and the rough, cratered highlands.  Some craters were found on top of the dark mare plains, while others were filled with mare.  Clearly, the craters on top of the mare formed after those plains existed and were thus younger than the maria.  On the other hand, dark mare that fills a crater must have formed after that crater existed and so in this case, the crater was older.

By following these simple relations over large areas, it is possible to determine the relative ages of mare and craters, both among themselves and to each other.  But such information is trivial unless we can relate these individual ages to some unit or event of regional significance.  In principle, if such a relationship can be defined we can extend relative age assignments over large areas, ultimately on a global basis.

The first effort to map the geology of the Moon was by the USGS, but not by the then-newly created Astrogeology Branch.  Branch of Military Geology scientists Arnold Mason and Robert Hackman produced the “Engineer’s Special Study of the Moon” in 1960.  This special one-off product documented the principal terrain types of the Moon (maria and highlands) and ordered features into three categories of relative age: post-mare craters (youngest), maria, and highlands (oldest).  Additionally, the map showed the distribution of linear features, presumed to be faults (fractures along which movement has occurred), and mare ridges (presumed to be folds) over the near side.  In this sense, the Engineer Special Study was a geological map because it showed the spatial distribution of rock types, their relative ages, and the inferred structure of the lunar surface.  This map was accompanied by a detailed text chart, which showed a region-by-region evaluation of the terrain and construction challenges for each area.  But a critical element was still missing.

On Earth, the geologist recognizes the rocks in the field, maps their locations and orientation, and documents the structure of the area under study.  But a key part of this work is to figure out where a particular area fits in the global column of geologic units.  On Earth, by documenting the slow, gradual nature of geological processes the stratigraphic column was developed slowly over the course of about a hundred years.  The terrestrial stratigraphic column also provided key evidence needed to show the gradual transition of life forms from simple invertebrate organisms in the earliest rocks, to the complex and varied life forms in succeeding strata.  With the development of a global stratigraphic system and accompanying geologic time scale for the Earth, a framework for understanding the history and processes of the Earth was created.

Gene Shoemaker recognized the need for an organized stratigraphy to aid in our understanding of the Moon.  He wanted to understand the Moon’s evolution and age, but also to correlate events on the Moon with events in Earth history.  He recognized that a major step forward to such an end was to define a formal stratigraphic system for the Moon – a clear succession of rock types with key regional units defining the system boundaries.  He began mapping the area around the crater Copernicus, which lies on the central near side of the Moon, recognizing that the rocks exposed there (from what had been discerned from images) represented all the distinct phases of lunar history.

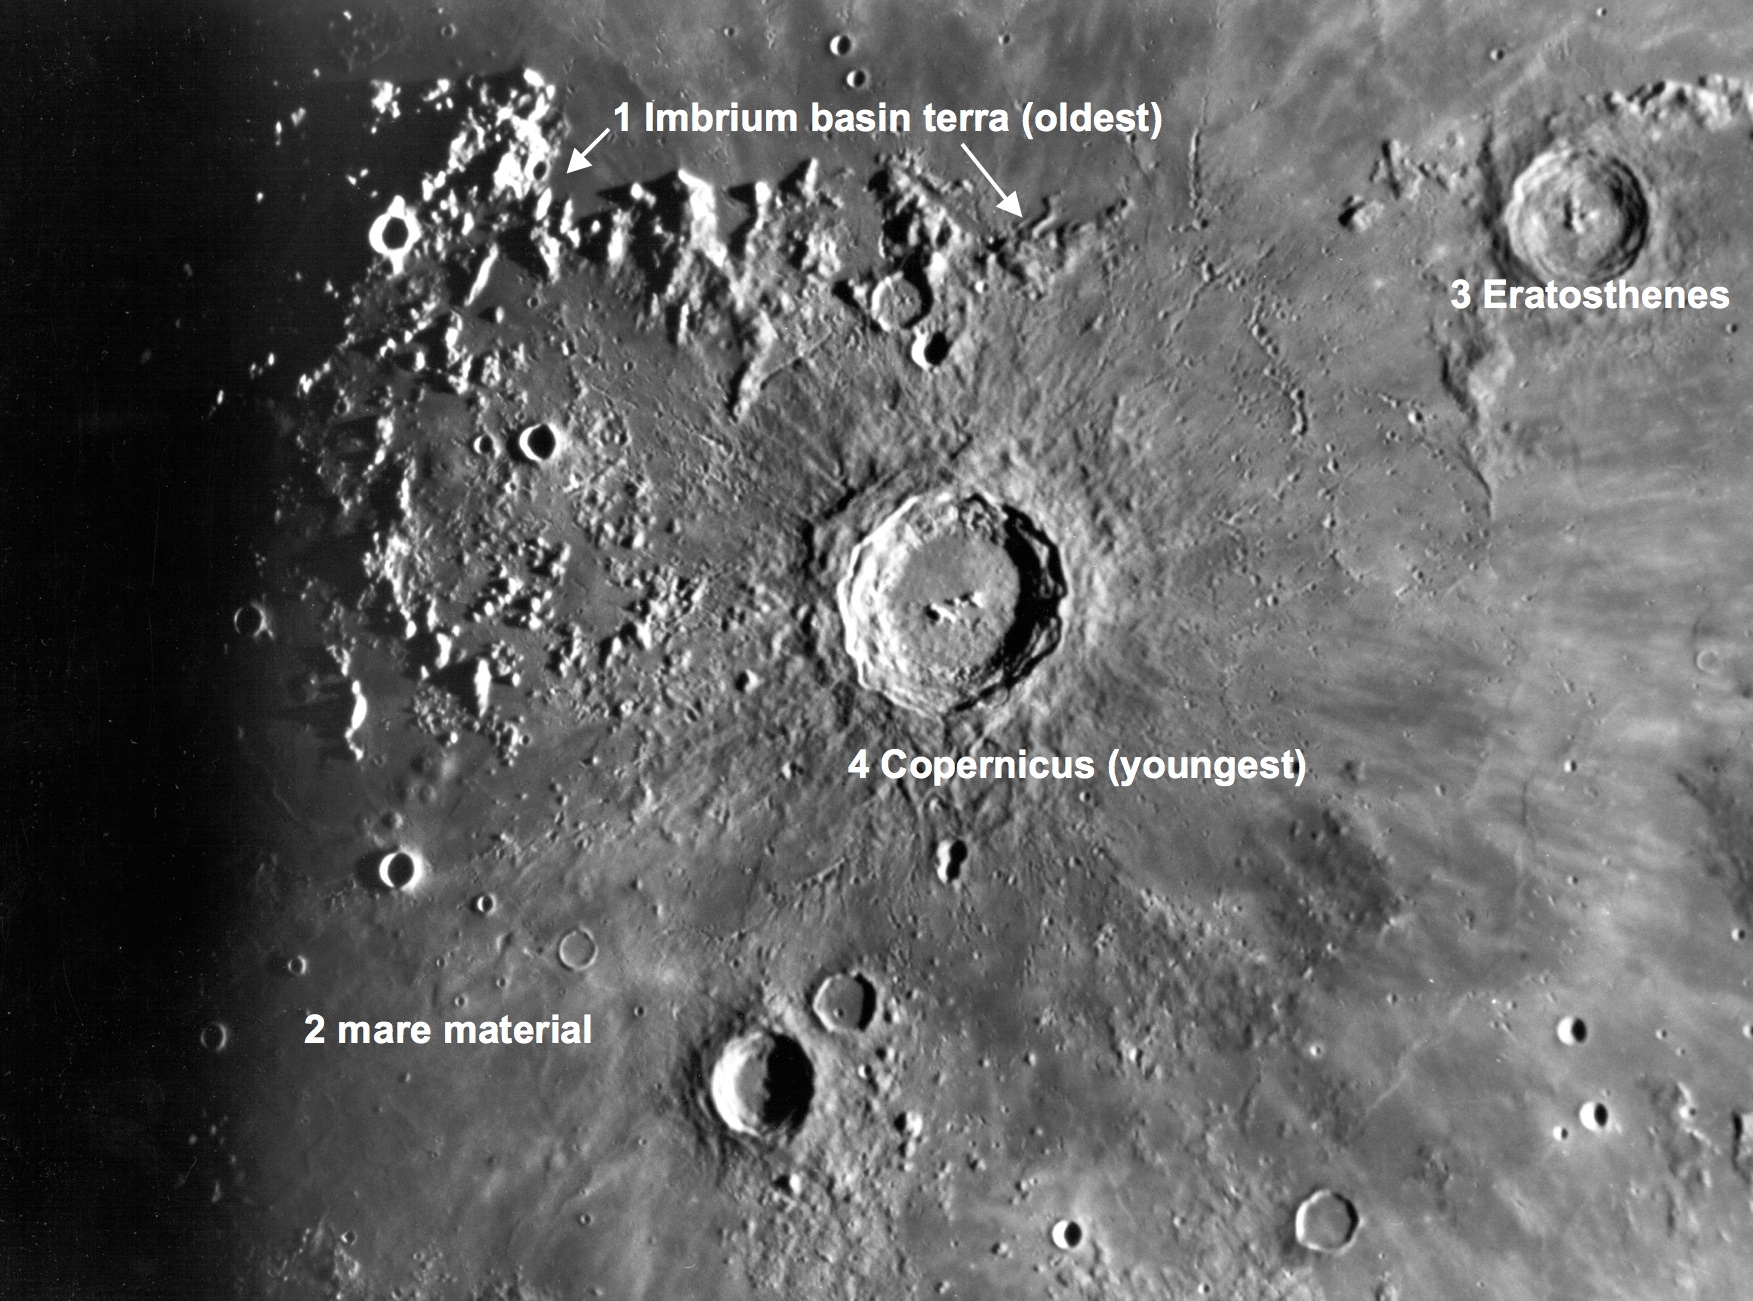
From Earth, a telescopic image of Copernicus and vicinity, showing how the relative ages of geological features are determined using the principle of superposition.
The basic sequence is easy to follow.  The oldest rocks (1) are those that form the highland units of the large, circular Imbrium impact basin.  These units are the mountains that make up the rim of the basin as well as the regional highlands around Copernicus, which are ejecta from the basin forming event.  Partial flooding by the dark, smooth maria followed (2), including both dark, ash-like materials and smooth flood-like plains (interpreted even then as flows of basalt, the most common volcanic rock type on Earth).  These eruptions were followed by the formation of impact craters, of which two kinds could be recognized:  an older group (3) that had slightly eroded and lost their bright rays (such as Eratosthenes) and a younger group (4) that preserved the bright rays and showed a fresh, unmodified form (such as Copernicus.)

Shoemaker used these rock units to define the lunar time-stratigraphic systems:  the Imbrian, Procellarian, Eratosthenian and Copernican Systems were each assigned to represent an archetypical deposition event.  Rocks that existed before the formation of the Imbrium basin were assigned to an informal category, the pre-Imbrian.  Thus, Shoemaker created a geologic map that not only showed the distribution of rock units and the structure of a given area, but also classified these rock types into a stratigraphic column for the Moon, one that (because of the enormous extent of the Imbrium basin) could be applied to areas across the lunar near side.  With slight modification (the “Procellarian” System is no longer used and the pre-Imbrian has been subdivided into the Nectarian System and pre-Nectarian), this classification scheme subsequently has been applied to the entire Moon.

Shoemaker’s work on geologic mapping of the Moon gave us the ability to immediately put the lunar samples returned by Apollo into a regional and global context.  We found that most lunar events occurred very early in its history, with intense geological activity in the first 1-2 billion years and little activity since.  Thus, the Moon’s geological record perfectly complemented that of the Earth, whose traces of earliest activity have been erased over time by the active processes of erosion and plate tectonics.

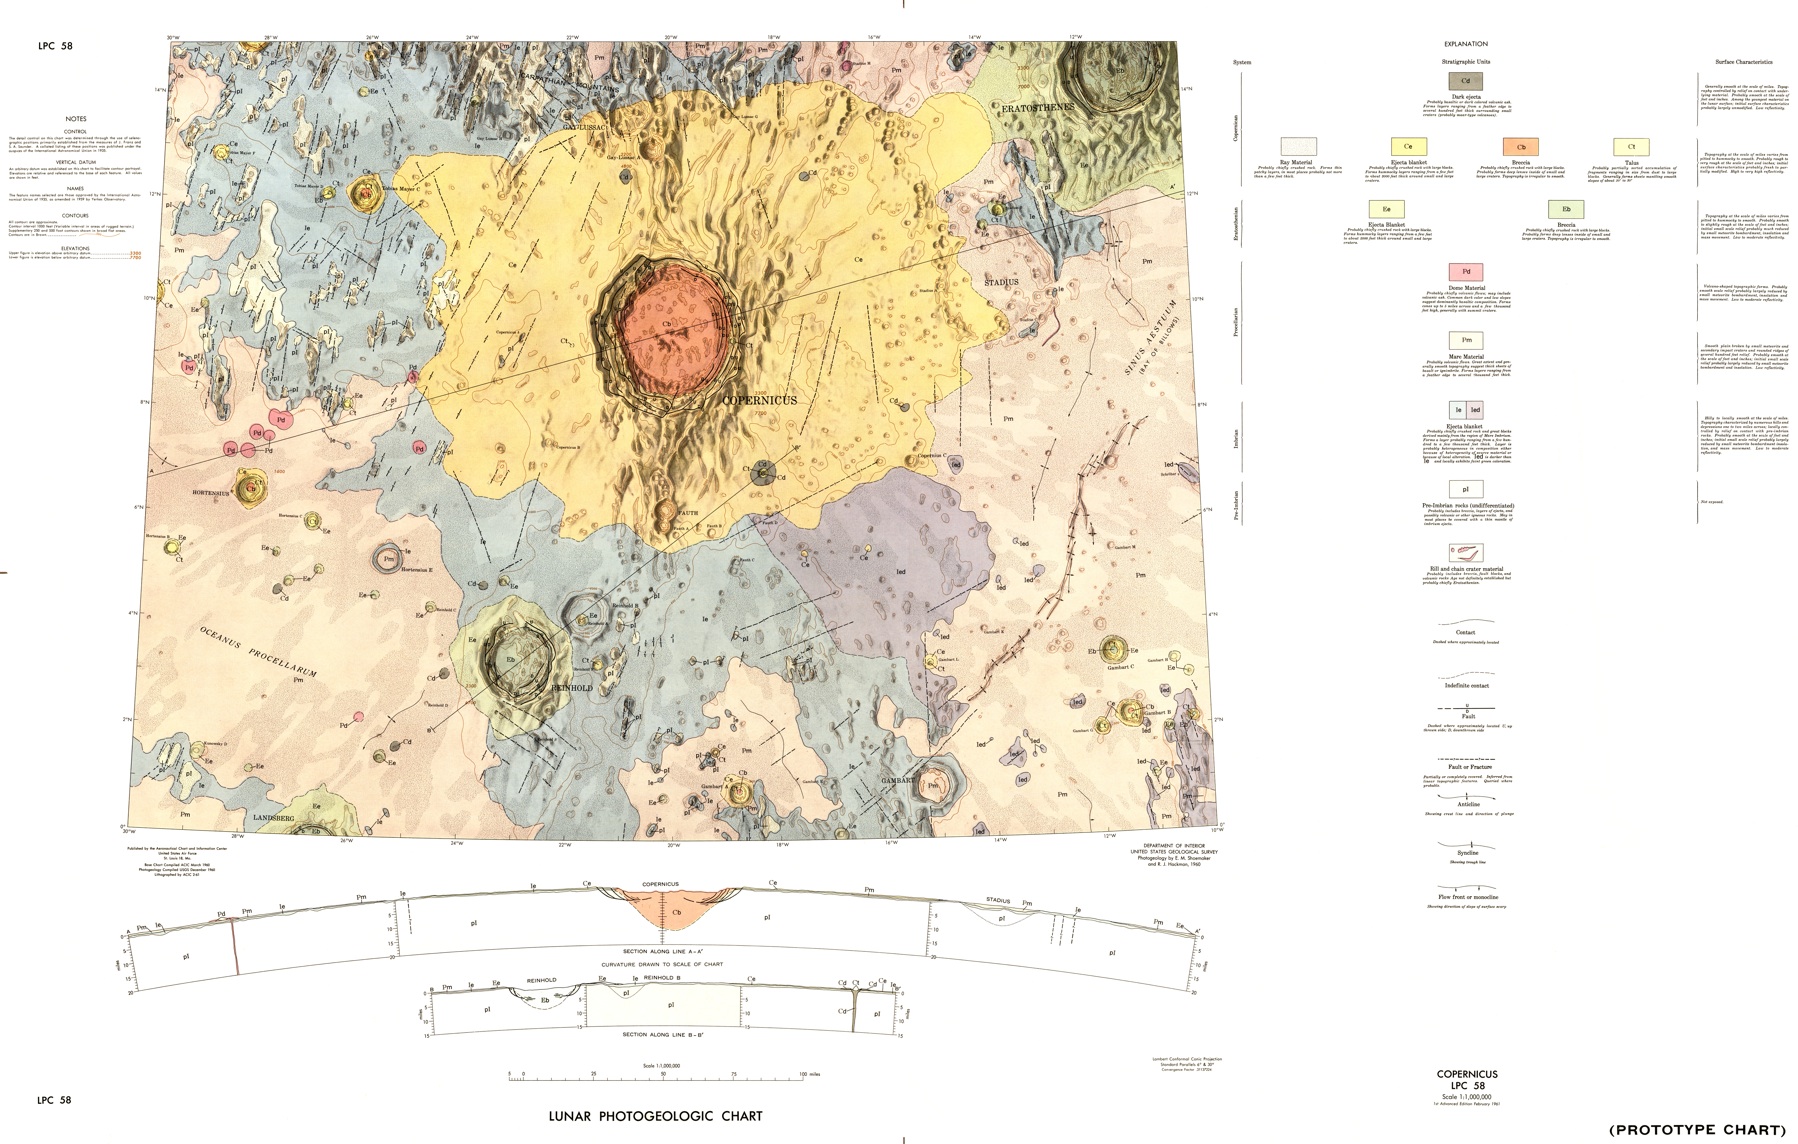
The first geologic quadrangle map of the Moon, showing rock units (basin, crater and mare materials), structures and their stratigraphic arrangement.
The 1960 Copernicus Prototype Chart LPC-58, the first true geological map of the Moon, was not formally published by the USGS, though a modified and updated version was published later in that decade.  By then, Gene had picked up a couple of co-authors for his effort, including one Harrison Hagan Schmitt (a young geologist with the USGS in the early 1960s), who in 1972 ultimately got the chance on the Apollo 17 mission to do what Gene Shoemaker originally got into the space business to do – check the interpretations of the remote lunar geologic mapping by doing field work on the Moon.

Click HERE to view Shoemaker’s LPC-58 geological map at full resolution.

Just publishedThe Clementine Atlas of the Moon, Revised Edition, an updated atlas and reference guide to lunar features, by Ben Bussey and yours truly.

Originally published at his Smithsonian Air & Space Magazine blog "The Once and Future Moon," Dr. Spudis is a senior staff scientist at the Lunar and Planetary Institute. The opinions expressed are those of the author and are better informed than average.