Showing posts with label DEM. Show all posts

Saturday, July 14, 2012

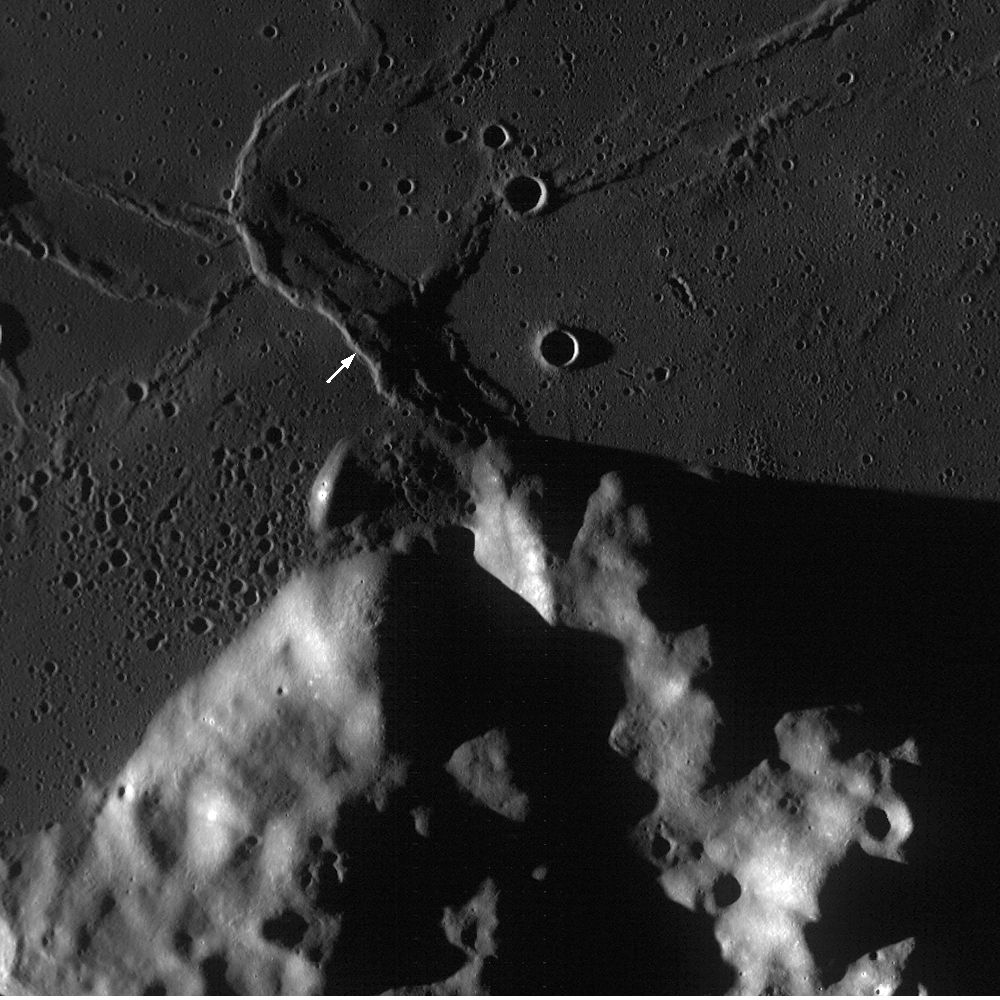
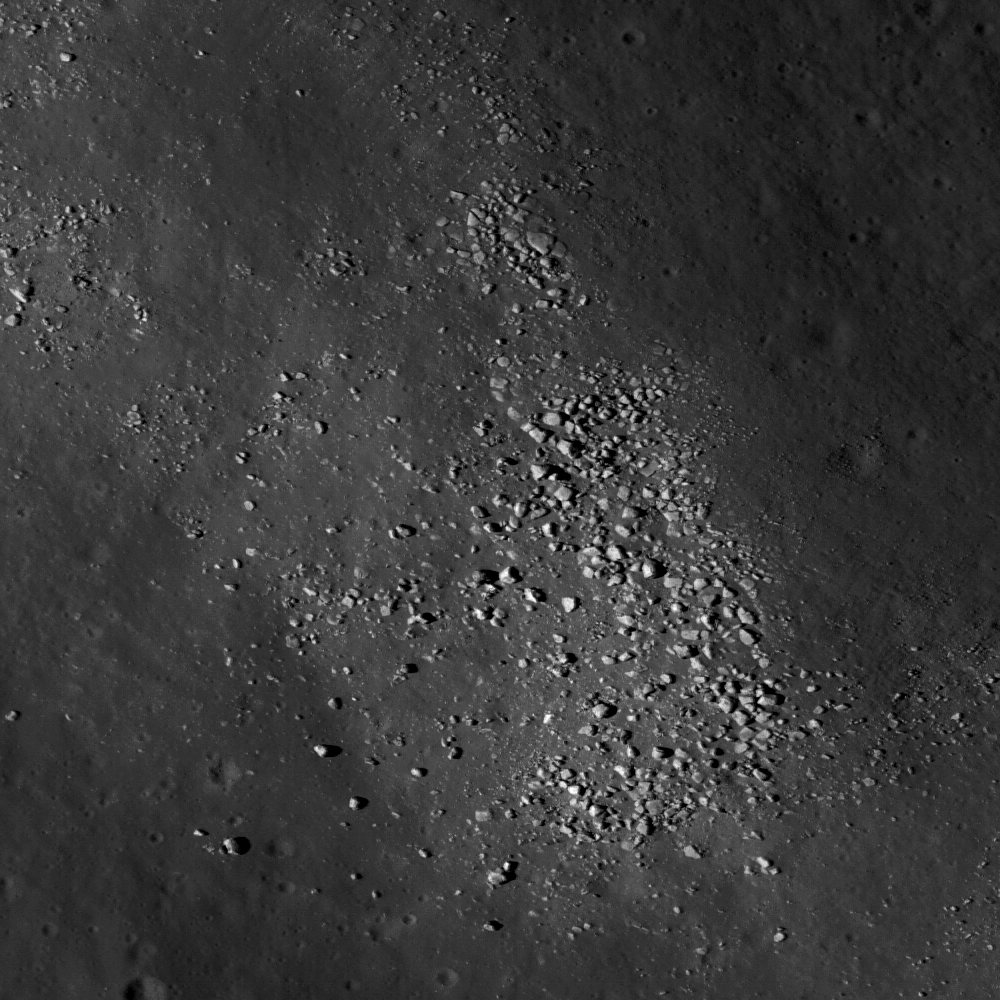
Kaguya's digital elevation model as fine wall art

"Mare Orientale," is both title and subject of this 96.5 centimeter-wide, three-panel work carved in Sapele, a 'flesh-colored African wood.' Sirsalis is easy enough to pick out, at lower right, along with other highlights of west central Procellarum, and westward along the north east quadrant of Orientale. The work is said to have 'has an opalescent grain,' the highlights of which 'shimmer as the viewer passes by,' writes Craig Dorety, the artist who currently has this and similar works based on the Kaguya (SELENE-1) digital elevation model on exhibition until August 17 [Photographed by Susan Fowler].
Xeni Jardin
San Francisco-based artist Craig Dorety has a series of carvings that "represent segments of the moon's surface as found in the topograhical data from JAXA's Kayuga mission."

"Painstaking attention is paid to the relationship of crater groups in the composition of each carving," Craig explains. "Areas of special interest have a natural balance of crater to sea; rough to gentle in texture."

Read the full article, HERE.

Monday, February 13, 2012

Howard Fink takes a closer look at Hermite A

Howard Fink at New York University continues to make full sense of the hundreds of millions of laser altimetry data points measured by the LOLA instrument on board the Lunar Reconnaissance Orbiter since June 2009 [Howard Fink/NYU/NASA/GSFC/LOLA].
Joel Raupe

A lingering concern from those early, heady days of the Vision for Space Exploration, the initiative that set in motion the five spacecraft now orbiting the Moon, has been how to take full advantage of the unprecedented amount of data the precursor robotic spacecraft would return to Earth. This was true especially of LRO, a mission that broke the record for the sheer volume of information returned from deep space (from all previous missions combined). One answer emerging has proven to be crowd-sourcing.

The regular release of data in three month intervals has inspired many not professionally attached to the mission to assemble new global maps and montages. Even so, if the science still being pulled from the data record returned by the relatively modest Lunar Pioneer mission is used as a guide it's likely new discoveries about the Moon will still be being announced a least a decade after the LRO mission comes to an inevitable end.

One of those assembling lunar terrain models from LRO data is Howard Fink of New York University, in his case the LRO laser altimetry collected by the LOLA instrument - the most comprehensive of its kind.

Fink has just released a new and better model of Hermite A, a 22 kilometer-wide highland crater with an interior in permanent shadow not far from the Moon's north pole. That model can be viewed in detail at his Wordpress AstroPhoto blog, HERE.

In addition, "in tribute to all those who don't still have to look up how to spell its name," Fink released in February a remarkable look at Rozhdestvenskiy, HERE, in the context of the whole lunar pole region. Both can readily be compared with the data gleaned from the LROC Wide Angle Camera (WAC) derived elevation model, visible using the tools accompanying the LROC QuickMap, HERE.


Related Posts:
The replicators have arrived (November 7, 2011)
LOLA: Cold Hermite (April 10, 2011)
Lunar elevation models come in many forms (March 4, 2011)
LRO's unprecedented topography of the Moon (December 17, 2010)
LROC: The Lunar North Pole (October 5, 2010)
LRO Mini-RF spends month mapping lunar poles (August 8, 2010)
'Potentially ice-rich' crater in Rozhdestvenskiy (July 2, 2010)
Coldest Spot on the Moon (December 16, 2009)

Monday, November 21, 2011

Apollo Metric Camera maps completed

The final three Apollo "J" missions as planned were devoted to science, and each of their Service Modules were equipped with an array of equipment that remained in orbit as their surface expeditions were carried out. Mapping Metric and Panorama Cameras operated over the sunlit surface over multiple orbits as part of the Apollo 15, 16 and 17 missions. Film canisters for these cameras were retrieved in spacewalks during the long cruise home. Until recently, the orbital corridors under the orbital plain of these last missions were the most well-understood detailed portions of the lunar surface [NASA/Google Earth].
Dr. Terry Fong
Director, Intelligent Robotics Group
NASA Ames Research Center

It gives me great pleasure to announce the release of the "Apollo Zone" Digital Image Mosaic (DIM) and Digital Elevation Model (DEM). These maps cover approx. 18% of the Lunar surface at a resolution of 1024 pixels per degree (approx 30 m/pixel). The maps are the result of 3 years worth of work by the NASA Ames Intelligent Robotics Group (IRG) to align and process more than 4,000 images from the Apollo Metric Camera (AMC), which flew aboard Apollo 15, 16, and 17. The AMC images were provided by the Apollo Image Archive at Arizona State University.

To preview the "Apollo Zone" maps, download the following "KML" file for viewing in Google Earth:

http://byss.ndc.nasa.gov/stereopipeline/dataviz/apollo_metric.kml

Once you open that file in Google Earth you will have options to view these "Apollo Zone" maps overlaid on Google Earth's "Moon mode". The full maps (in GeoTIFF format with complete metadata) have also been uploaded to the Lunar Mapping and Modeling Project (LMMP) portal (http://lmmp.nasa.gov) and will soon be available for visualization and download via that site.

The "Apollo Zone" maps cover the following sites of interest: Apollo 15, Apollo 16, Alphonsus Crater, Rima Prinz, Aristarchus Plateau-2, Ina D Caldera, Sulpicius Gallus, Mare Crisium, Mare Smythii, King Crater, Tsiolkovskiy Crater, Aitken Crater, and half of Van de Graaf Crater.

The terrain model has an average vertical accuracy of 40 m/pixel and standard deviation of 37 m (compared to LOLA laser altimetry tracks). Over 46% of the covered surface has vertical errors lower than 25 m.

The "Apollo Zone" maps (image, elevation, hillside, colorshade, confidence and precision) were automatically generated using new computer vision algorithms developed by IRG:

 - robust statistical sub-pixel stereo correspondence
 - robust bundle adjustment and radiometric corrections for large-scale
   image mosaics
 - orbital camera position/orientation estimation using interest point
   extraction
 - photometric correction of exposure time, shadow removal and generation of
   seamless large-scale image mosaics.
 - photometric method for reconstructing lunar albedo
 - photoclinometric terrain reconstruction method that improves lunar
   DTM precision
 - statistical method for multiple stereo digital terrain model mosaicking
 - multi-view 3D terrain reconstruction
 - DTM / LOLA alignment and lidar / image matching

These algorithms have been released as NASA open-source (Ames Stereo Pipeline, Neo-Geography Toolkit, and NASA Vision Workbench). Map processing was performed using the NASA Pleiades supercomputer. In addition to the Apollo Metric Camera images, the fully automatic map processing pipeline has also been used with data from the Lunar Reconnaissance Orbiter Camera (LROC) and by several planetary science groups.

This work was funded by the Lunar Mapping and Modeling Project (LMMP). We gratefully acknowledge the support of our collaborators at NASA MSFC, NASA GSFC, JPL and USGS. We sincerely thank Mark Robinson and the Apollo Image Archive at ASU for restoring and bringing the AMC data to "digital life". Our special thanks go to Ray French and Mark Nall for their support and leadership of LMMP.

If you have any questions, or would like more information, please let me know.

Cheers,

Terry Fong

Monday, November 7, 2011

The replicators have arrived

"Slide show" comparing an illumination model of the lunar north pole region, made using a three-dimensional printer and LRO laser altimetry by Howard Fink of New York University, with standard representations of LOLA data and one LROC WAC mosaic [Howard Fink/NYU/NASA/GSFC/ASU].
Paul D. Spudis
The Once & Future Moon
Smithsonian Air & Space

Of all the wonders depicted in science fiction books and movies, one of the most intriguing is the machine that makes anything that you need or desire.  Merely enter a detailed plan, or push the button for items programmed into the machine – dials twirl, the machine hums and out pops what you requested.  Technology gives us Aladdin’s Lamp.  A handy device that will find many uses.

We’re not quite there yet but crude versions of such imagined machines already exist.  These machines are called “rapid prototype” generators or three-dimensional printers.  They take digitized information about the dimensions and shape of an object and use that data to control a fabricator that re-creates the object using a variety of different materials.  Typically, these machines use easy to mold plastics and epoxy resins but in principle, any material could be used to create virtually any object.

3-D printers contribute to the advancement our understanding of lunar morphology, as LRO fills long-neglected gaps in lunar morphology. Malapert Massif (85.9°S, 0.42°E). From an 80 meter resolution image of the South Pole region of the Moon built from a 20 meter original supplied by the LRO/LOLA science team [Howard Fink/NYU].
For comparison nearly the same area modeled by laser altimetry (LOLA) above, Malapert from the LROC Wide Angle Camera (WAC) RDR 100 meter Global Mosaic [NASA/GSFC/Arizona State University].

What’s the relevance of this technology to spaceflight and to the Moon?  One of the key objects of lunar return is to learn how to use the material and energy resources of the Moon to create new capabilities.  To date, we have focused our attention on simple raw materials like bulk regolith (soil) and the water found at the poles.  It makes sense to initially limit our resource utilization ambitions to simple materials that are both useful and relatively massive, which currently have those killer transportation costs when delivered from Earth.  Bulk regolith has many different uses, such as shielding (e.g., rocket exhaust blast berms) as well as raw material for simple surface structures.

However, once we are on the Moon and have met the basic necessities of life, we can begin to experiment with making and using more complex products.  In effect, the inhabitants of the Moon will begin to create more complicated parts and items from what they find around them, just outside their door.  The techniques of three-dimensional printing will allow us to discover what makes life off-planet easier and more productive.  We will experiment by using the local materials to maintain and repair equipment, build new structures, and finally begin off-planet manufacturing.

To illustrate the obliquity of the view angle and the problem posed in gathering information about the tantalizing but permanently shadowed regions of the Moon, Shackleton crater, with the Moon's South Pole on its rim (upper left) together with Malapert Massif on the horizon, seen with Earth as a back drop. HDTV still from Japan's Kaguya orbiter released November 2007 [JAXA/NHK/SELENE].
During the early stages of lunar habitation, material and equipment will be brought from Earth.  With continued use, particularly in the harsh lunar surface environment, breakdowns will occur.  Although initially we will use spare parts from Earth, for simple uncomplicated structures that are needed quickly, a three-dimensional printer can make substitute parts using local resource materials found near the outpost.  Most existing 3-D printers on Earth use plastics and related materials (which are complex carbon-based compounds, mostly derived from petroleum) but some processing has used concrete, which can be made on the Moon from sieved regolith and water.  In addition, we also know that regolith can be fused into ceramic using microwaves, so rapid prototyping activities on the Moon may eventually find that partially melting particulate matter into glass is another way to create useful objects.

The lunar surface is a good source of material and energy useful in creating a wide variety of objects.  I mentioned simple ceramics and aggregates, but additionally, a variety of metals (including iron, aluminum and titanium) are available on the Moon.  Silicon for making electronic components and solar cells is abundant on the Moon.  Designs for robotic rovers that literally fuse the in-place upper surface of the lunar regolith into electricity-producing solar cells have already been imagined and prototyped.  We can outsource solar energy jobs to the Moon!

These technical developments lead to mind-boggling possibilities.  Back in the 1940s, the mathematician John von Neumann imagined what he called “self-replicating automata,” small machines that could process information to reproduce themselves at exponential rates.  Interestingly, von Neumann himself thought of the idea of using such automata in space, where both energy and materials are (quite literally) unlimited.  A machine that contains the information and the ability to reproduce itself may ultimately be the tool humanity needs to “conquer” space.  Hordes of reproducing robots could prepare a planet for colonization as well as providing safe havens and habitats.

We can experiment on the Moon with self-replicating machines because it contains the necessary material and energy resources.  Of course, in the near-term, we will simply use this new technology to create spare parts and perhaps simple objects that we find serve our immediate and utilitarian needs.  But things like this have a habit of evolving far beyond their initial envisioned use, and often in directions that we do not expect; we are not smart enough to imagine what we don’t know.  The technology of three-dimensional printing will make the habitation of the Moon – our nearest neighbor in space – easier and more productive.  Even now, creative former NASA workers have found a way to make this technology pay off.  In the future, perhaps their talents could be applied to making the Moon a second home to humanity.

Originally published October 24, 2011 at his Smithsonian Air & Space blog The Once and Future Moon, Dr. Spudis is a Senior Staff Scientist at the Lunar and Planetary Institute in Houston. The opinions expressed are those of the author and are better informed than average.

Friday, December 17, 2010

LRO's unprecedented topography of the Moon


The rugged South Pole, revealed through LOLA's millions of laser hits centered on prominent (if small, at only 10 kilometers) Shackleton. The jagged ancient rim of South Pole-Aitken (SPA) Basin, it's smaller near side component to the north of Malapert (center top) and the fantastically high Liebnitz beta massifs. To their left Cabeus hides the highest concentrations of water while some of the other permanently-shadowed areas do and others mysteriously do not hold such promise [NASA/GSFC/MIT/SVS].

Nancy N. Jones
Goddard Space Flight Center

NASA's Lunar Reconnaissance Orbiter is allowing researchers to create the most precise and complete map to date of the moon's complex, heavily cratered landscape.


LOLA topographic map centered on the Apollo 15 landing site, highlighting the Apennine and Caucasus ranges and the fairly subtle wrinkling in Serenitatis. The false colors indicate elevation: red areas are highest and blue lowest [NASA/GSFC/MIT/SVS].

"This dataset is being used to make digital elevation and terrain maps that will be a fundamental reference for future scientific and human exploration missions to the moon," said Dr. Gregory Neumann of NASA's Goddard Space Flight Center in Greenbelt, Md. "After about one year taking data, we already have nearly 3 billion data points from the Lunar Orbiter Laser Altimeter on board the LRO spacecraft, with near-uniform longitudinal coverage. We expect to continue to make measurements at this rate through the next two years of the science phase of the mission and beyond. Near the poles, we expect to provide near-GPS-like navigational capability as coverage is denser due to the spacecraft's polar orbit." Neumann will present the map at the American Geophysical Union meeting in San Francisco December 17.

The Lunar Orbiter Laser Altimeter (LOLA) works by propagating a single laser pulse through a Diffractive Optical Element that splits it into five beams. These beams then strike and are backscattered from the lunar surface. From the return pulse, the LOLA electronics determines the time of flight which, accounting for the speed of light, provides a precise measurement of the range from the spacecraft to the lunar surface. Range measurements, combined with accurate tracking of the spacecraft's location, are used to build a map revealing the contours of the lunar landscape. The five beams create a two-dimensional spot pattern that unambiguously reveals slopes. LOLA will also measure the spreading of the return pulse to get the surface roughness and the change in the transmitted compared to the return energy of the pulse to determine surface reflectance.


The "resource-rich" lunar North, triangulated by Hermite on the right, where the Solar System's coldest temperatures have been recorded, wide-spread Rozhdestvenskiy across the top and Perry, bottom right, hugging the North Pole along with recently-designated Whipple [NASA/GSFC/MIT/SVS].

The new LOLA maps are more accurate and sample more places on the lunar surface than any available before. "The positional errors of image mosaics of the lunar far side, where direct spacecraft tracking – the most accurate -- is unavailable, have been one to ten kilometers (about 0.62 to 6.2 miles)," said Neumann. "We're beating these down to the level of 30 meters (almost 100 feet) or less spatially and one meter (almost 3.3 feet) vertically. At the poles, where illumination rarely provides more than a glimpse of the topography below the crater peaks, we found systematic horizontal errors of hundreds of meters (hundreds of yards) as well." In terms of coverage, the nearly three billion range measurements so far by LRO compare to about eight million to nine million each from three recent international lunar missions, according to Neumann. "They were limited to a mile or so between individual data points, whereas our measurements are spaced about 57 meters (about 187 feet) apart in five adjacent tracks separated by about 15 meters (almost 50 feet)."

"Recent papers have clarified some aspects of lunar processes based solely on the more precise topography provided by the new LOLA maps," adds Neumann, "such as lunar crater density and resurfacing by impacts, or the formation of multi-ring basins."

"The LOLA data also allow us to define the current and historical illumination environment on the moon," said Neumann. Lunar illumination history is important for discovering areas that have been shaded for long periods. Such places, typically in deep craters near the lunar poles, act like cold storage, and are capable of accumulating and preserving volatile material like water ice.

The landscape in polar craters is mysterious because their depths are often in shadow. The new LOLA dataset is illuminating details of their topography for the first time. "Until LRO and the recent Japanese Kaguya mission, we had no idea of what the extremes of polar crater slopes were," said Neumann. "Now, we find slopes of 36 degrees over several kilometers (several thousands of yards) in Shackleton crater, for example, which would make traverses quite difficult and apparently causes landslides. The LOLA measurements of shadowed polar crater slopes and their surface roughness take place at scales from lander size to kilometers. These measurements are helping the LRO science team model the thermal environment of these craters, and team members are developing temperature maps of them."

LRO and LOLA were built and are managed by NASA Goddard. The research was funded by NASA's Exploration Systems Mission Directorate at NASA Headquarters in Washington.

Wednesday, October 13, 2010

LROC: Slipher Crater: Fractured Moon in 3-D


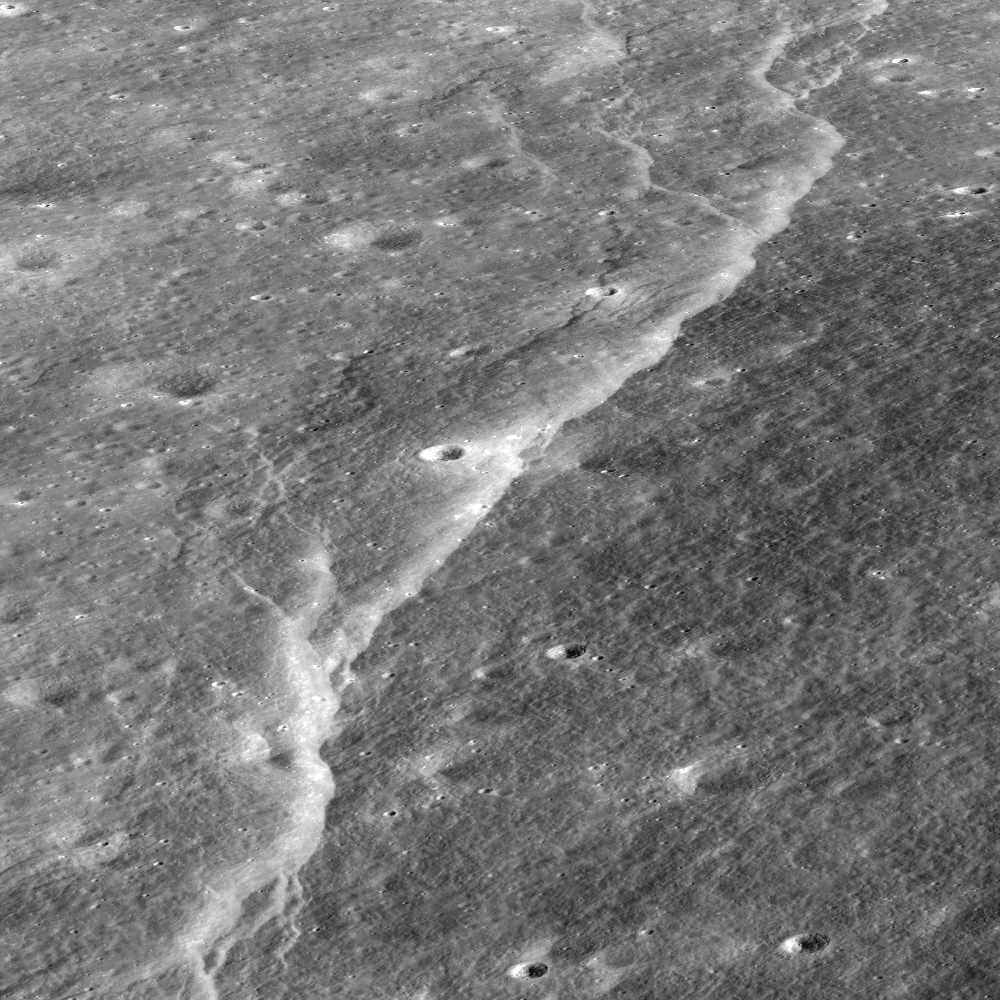
Over time, the surface of the Moon fractures and buckles as it cools and shrinks, resulting in spectacular landforms. Stereo images provided by the LROC Narrow Angle Camera (NAC) allow a detailed look at these amazing features; view is to the east, foreground to background distance is ~3 km [NASA/GSFC/Arizona State University].

Mark Robinson
Principal Investigator
Lunar Reconnaissance Orbiter Camera
Arizona State University


The wall of Slipher crater is deformed by one of many scarps found in the lunar highlands, which are thought to form as the Moon shrinks due to magma deep inside the Moon cooling and "freezing" to solid rock. Unlike water-ice (ice floats), most rocks are denser than their magma (you can think of water as magma and ice as rock), meaning rocks occupy less volume than their parent melt.

As the interior of the Moon shrinks due to this volume change, the outer crust of the Moon wrinkles and folds, and the linear, rounded shape of the lobate scarp occurs as the crust breaks and one segment is thrust on top of another.


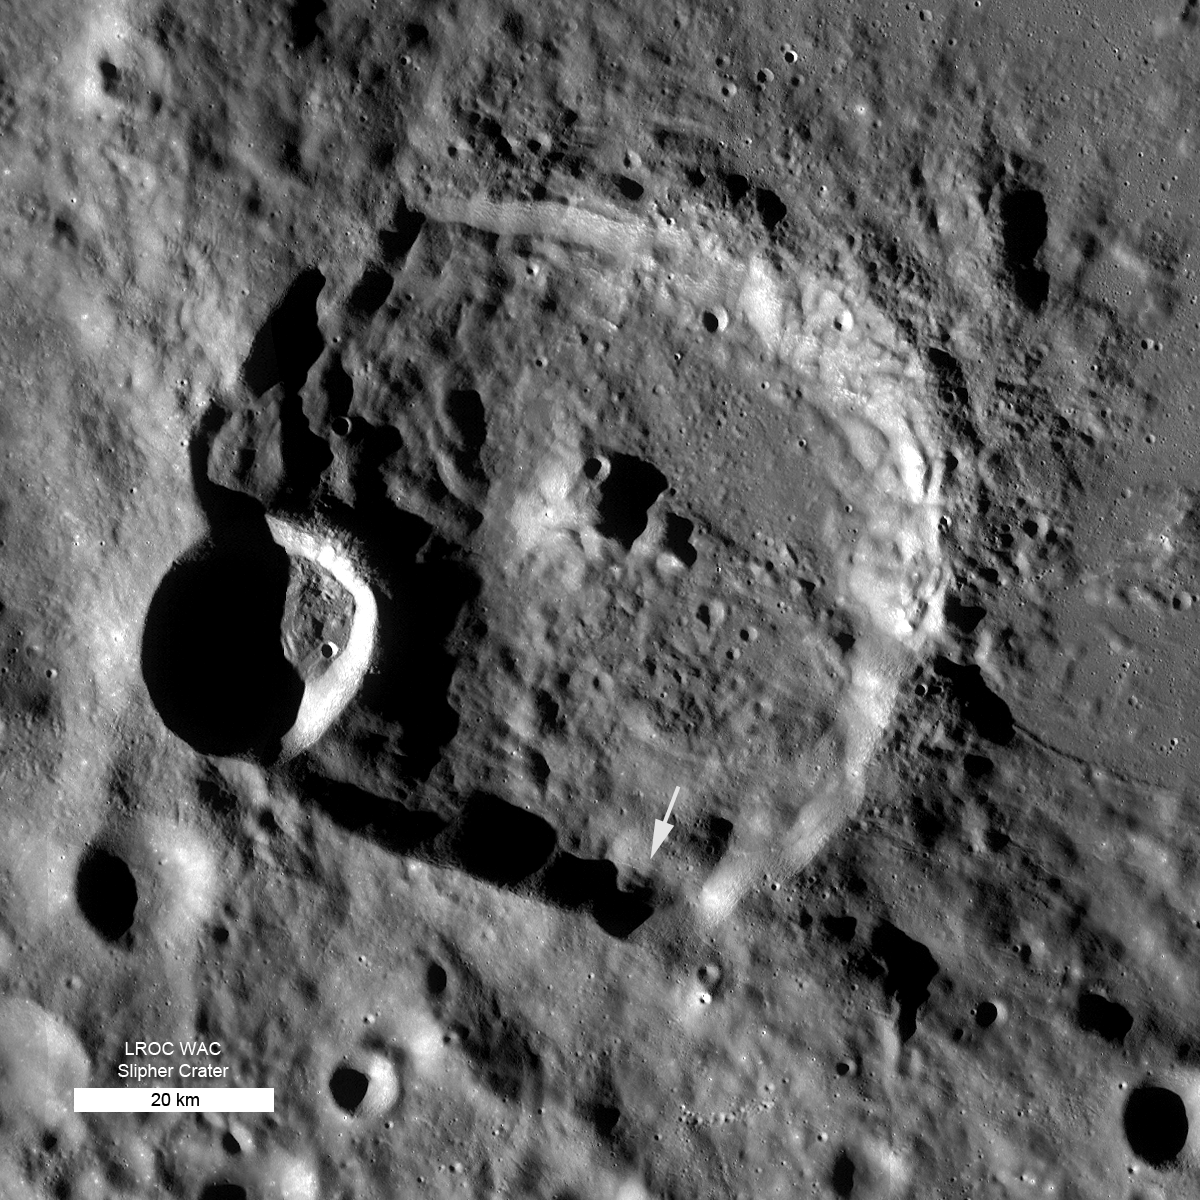
LROC Wide Angle Camera (WAC) context mosaic of ~70 km Slipher crater (49.5°N, 160.1°E) - north is up, arrow indicates location of scarp seen in Narrow Angle Camera Featured Image [NASA/GSFC/Arizona State University].


A broader view of the Slipher lobate scarp created by rotating the stereo-based topography with the image draped on top. The scarp is about 20 meters high, foreground to background distance is ~3.5km. View towards the east [NASA/GSFC/Arizona State University].

LROC NAC stereo observations allow scientists to create high resolution topographic maps, sometimes known as digital elevation models (DEMs); details on LROC stereo processing can be found HERE. A (DEM) is a simple raster (two dimensional array) file where each pixel represents the local elevation relative to a reference point. For these lunar data the reference is a sphere with a diameter of 1737.4 km - the average radius of the Moon. To visualize the DEM, software can be used to create views from any perspective, as in the images above where you appear to be hovering above the surface, looking at the terrain from the side.


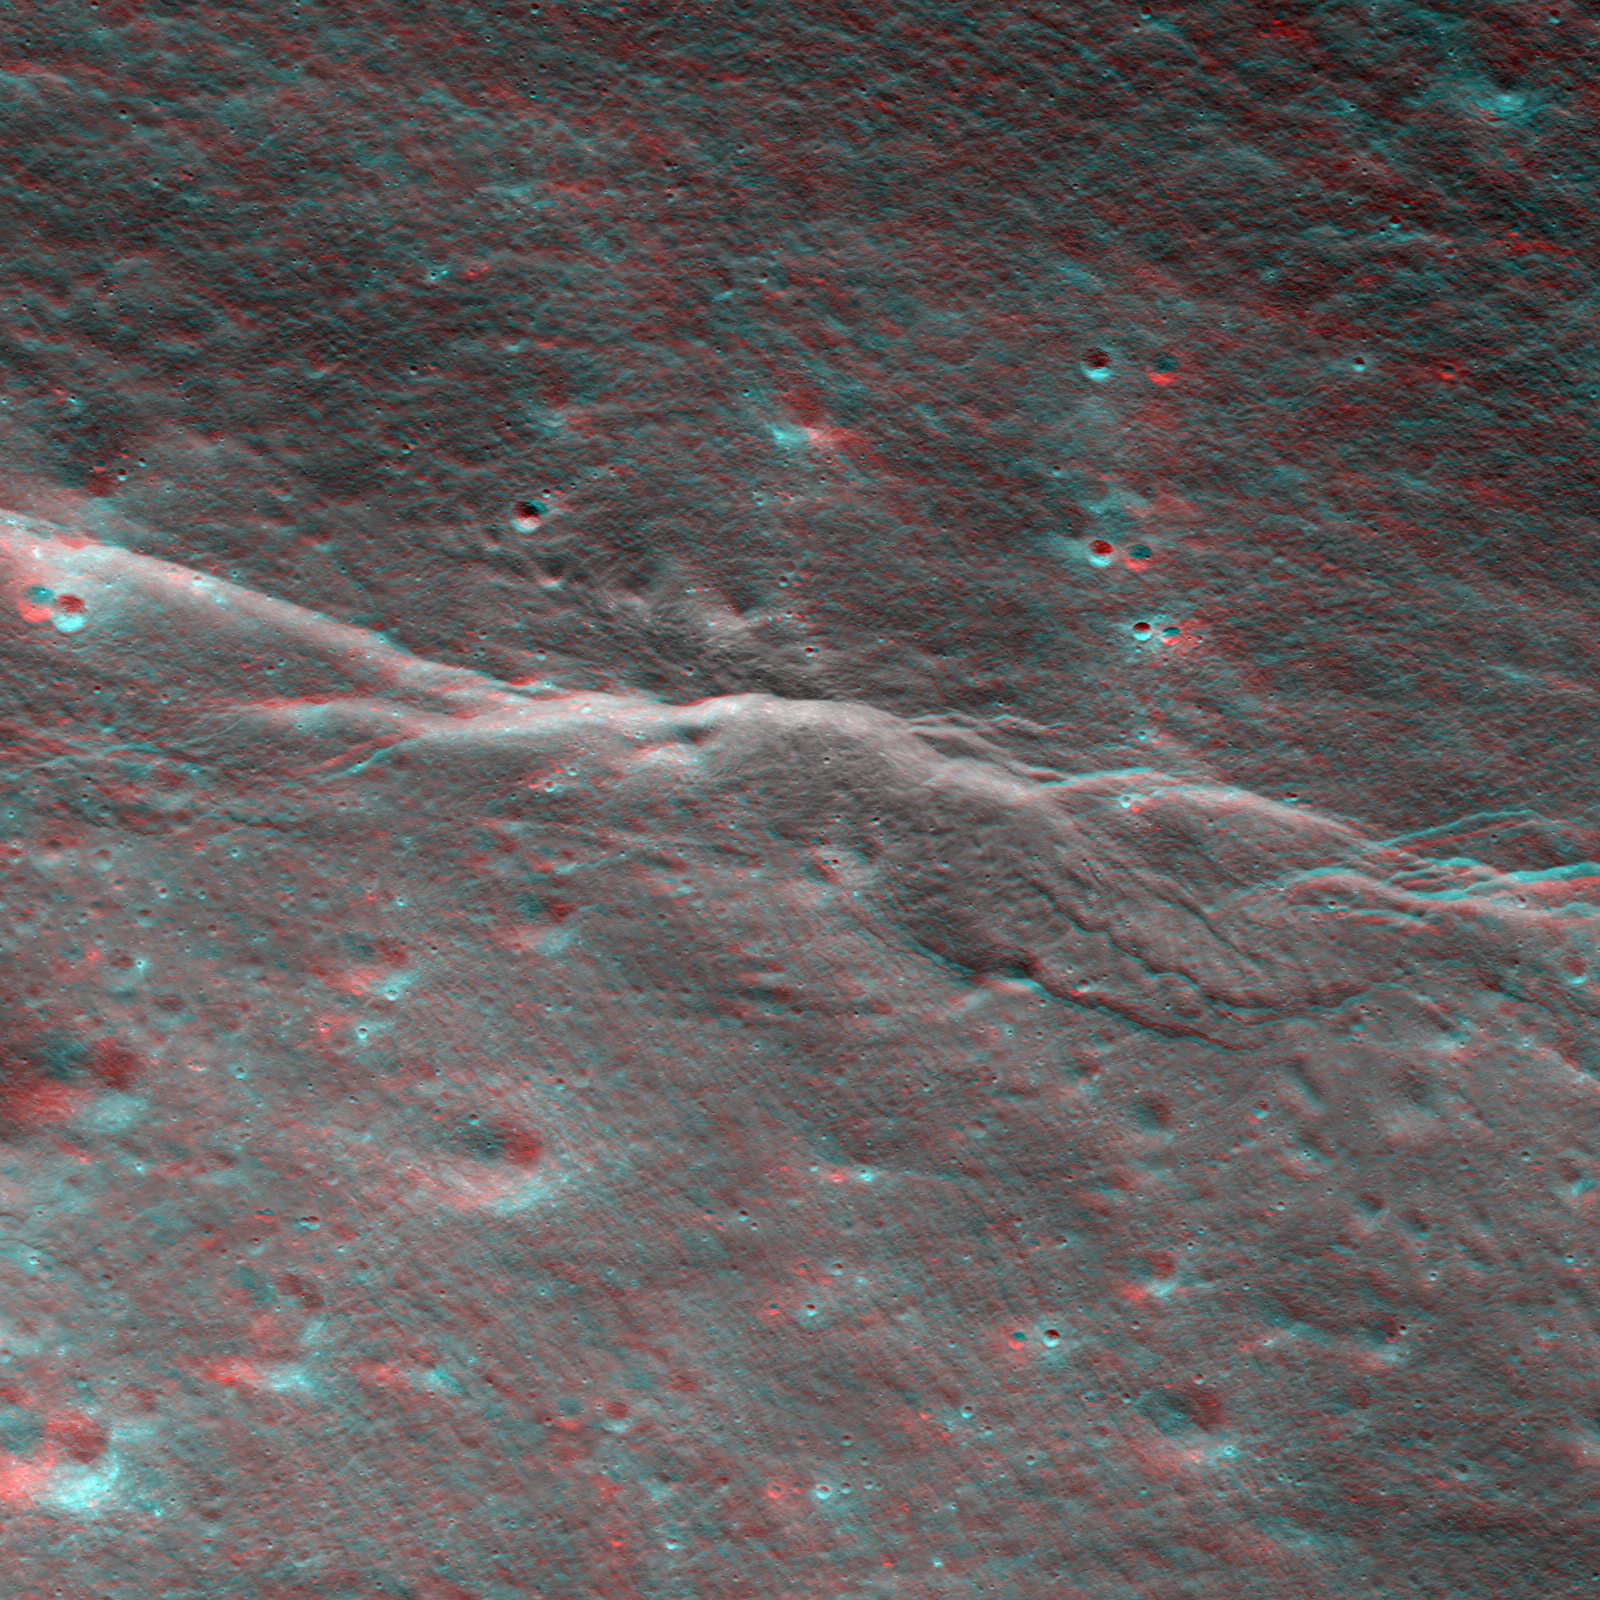
For a 3-D effect, put on your anaglyph glasses (red on the left)! In this view, south is to the top of the image, width is 1.7 km [NASA/GSFC/Arizona State University].

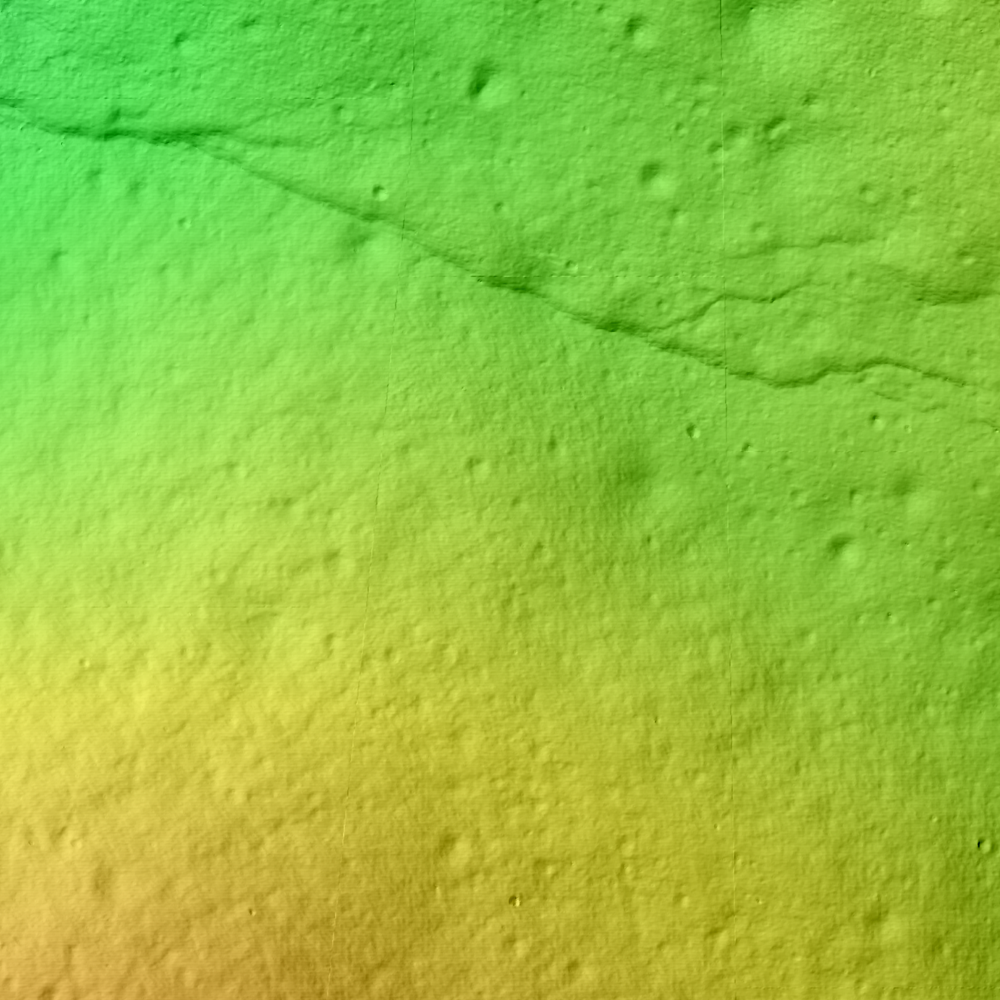
Color shaded relief is another common product used to convey topography from a DEM. In the image below, a shaded relief map was generated from the DEM and then a color overlay was added that depicts the elevation. In this small area green values are the lowest and red areas the highest. DEMs are one of the most important datasets scientists use to analyze terrain and obtain quantitative measurements of height and slope.


Shaded relief map of a small portion of Slipher crater, image width is 2.0 km [NASA/GSFC/Arizona State University].

Additionally, high-resolution topography gives engineers the means to decide the safest place to land a spacecraft, robotic or piloted. The new LROC topographic maps will enable future mission planners to select safe and feasible routes for rovers and explorers. What questions are left regarding these fascinating scarps? How would astronauts investigate their origin? Right now LROC is collecting high resolution images from all over the Moon. As the data accumulates, scientists can explore spatial relations between the scarps themselves and the their surroundings. For example, you can see Slipher crater has a somewhat square form (similar to Meteor Crater, AZ) indicating pre-existing fractures in the crust. We do know that the Slipher scarp formed as the crust was compressed - what role did the older fractures have in the location and size of the scarp? What triggered the compression event? Did the scarp form in one instant or over a series of events? Detailed examination of the fault surfaces, combined with a long term seismic characterization, would reveal the complex history of the Slipher scarp and the highland scarps in general. So there is much to do in terms of unraveling the thermal and seismic history of the Moon!

What a fantastic destination for explorers - imagine seeing the Slipher scarp appear while descending to the Moon's surface! In the meantime, 3-D anaglyphs help you see the landscape as it would appear as your spacecraft comes close to the surface.

Explore the full resolution NAC orthimage at 0.50 meter/pixel and the color shaded relief image at 2.0 meter/pixel!

For more information about the use of LROC NAC images in DEM generation and topography studies, be sure to check out the: Topography of ancient lunar basins and Orientale basin.

Thursday, September 23, 2010

Copernicus


In late afternoon. LROC Wide Angle Camera mosaic (LROC WAC Previewer, Microsoft ICE) from six consecutive passes during LRO orbits 2466-2471, January 8 & 9, 2010. (Closer view HERE. Images assembled with LROC_WAC_Image_Previewer, mosaic stitched with Microsoft ICE) [NASA/GSFC/Arizona State University]. [NASA/GSFC/Arizona State University].

Saturday, September 18, 2010

The deepest spot on the Moon nearly wasn't


The 10 km crater at bottom center, home of the Moon's lowest mean elevation (-9,020 meters - JAXA/SELENE, 2008 ) appears to have once nearly disappeared. Even though it's high in latitude, at 70 degrees south, it is not close enough to the pole to be permanently shadowed. It's a fairly normal crater for it's size, generally too small for a central peak with a rubble-lined middle interior and steep sloping inner rim. It's outer rim, however, disappeared one day, as it's host-crater's deep interior flooded with lava. LROC Wide Angle Camera observation M118639861M, LRO orbit 2617, January 20, 2010; alt. 53.95, res. 76.145, phase angle 85.12. Field of view = 32.3 km [NASA/GSFC/Arizona State University].

Not that anyone on Earth would have noticed. This "high-water" mark of molten lava, in this case probably oozing up from underground, was tucked away on the Moon's far side. If the "Man in the Moon" were a real face, the crater where the event took place was on the nape of the neck, where the spine meets the skull. In fact, because all the astronauts who ever visited there orbited much closer to the Moon's equator, no one has yet really seen this spot. Not that we haven't visited by proxy, plenty of times, since the Soviet Union managed to return the first photographs of the Moon's far side in 1959.

On Earth, multicellular life forms may have taken form by then. The raft of the melt that began flooding the host crater, 143 km Antoniadi (69.7°S, 188°E), came very close to spilling over it's north rim before it cooled. Because this flood event almost certainly happened long after after the formation of Antoniadi itself suggests it arose from the depths below Antoniadi, perhaps in the transfer of tremendous kinetic energy following the creation of Mare Orientale.

Studies just published, based on data returned from the Lunar Reconnaissance Orbiter, inform us this and the other "ponds" of mare-like material found in many place around there, near the center of the oldest, widest and deepest impact basin on the Moon - South Pole-Aitken (SPA) basin -is not composed of the "pristine magma" of the kind that may have once covered the entire Moon. The Moon's global "Magma Ocean" now appears to have "differentiated" as it cooled even before the basin-forming impact happened that formed SPA around 4 billion years ago, when no life we know of existed on Earth.

With no plate tectonics or the kinds of swift flowing water and wind we generally think of when we think of weather or climate on the Moon, our companion world holds fast to its ancient record of the history of the part of our star system also occupied by Earth. Because our record of the oldest life on Earth is mostly erased, its possible - even likely - that one day the oldest fossil record of life on Earth will be found on "terrestrial meteors" found on the Moon.

Monday, September 6, 2010

Lunar superlatives from LROC WAC


The 'Rooftop of the Moon' appears to be on the wide, flat northwest rim of 43 km-wide Engel'gard, the largest crater in this monochrome sample from the LROC Wide Angle Camera. The actual spot (5.44°N, 201.36°E) is not immediately distinct, as are Everest or Denali, for example. A future traveler standing there, 10.75 km above the global mean elevation might notice little beyond a close horizon. A brief 'bunny hop' may be necessary to get to an overlook, to see breathtaking views of astounding depths and distances. LROC WAC observation M103209735ME, field of view roughly 100 km; LRO orbit 379, July 26, 2009; alt. 112.88 km, res. 178.3 meters, phase angle 66.22° [NASA/GSFC/Arizona State University].


Barely 2400 km from the Moon's highest point is it's lowest point, invisible above, inside the shadows of the 12 km crater at middle-left, within the wide interior of 143 km-wide Antoniadi, not far from the center of 4 billion year old South Pole-Aitken basin. From Kaguya the smaller crater's interior (70.43°S, 187.42°E) was measured to a depth of 9.06 km below global mean (19.85 kilometers below the high point at Engle'hardt and 2 km more than the range gauged as recently as 2005). This image was processed using LROC WAC Previewer (v.1.2) from LROC WAC observation M103254154ME; field of view approximately 150 km; LRO orbit 385, July 26, 2009; alt. 42.68 km, res. 66.03 meters, phase angle 82.5° [NASA/GSFC/Arizona State University].


The bright, highest of the Moon's highlands as seen from Kaguya as the orbiter sailed under a late morning Sun. [JAXA/NHK/SELENE].


Also from Kaguya, the Moon's lowest place (70.43°S, 187.42°E) is briefly seen at the bottom of the bowl-shaped crater in wider Antoniadi. All the scenery in this late mission Terrain Camera image averages a few kilometers lower in lunar elevation than anything we can see of the Moon's near side from Earth. [JAXA/SELENE].

Friday, March 12, 2010

LROC: Crisium Constellation ROI

Updated March 12, 2009, 1530 UT
Rocky boulders on a wrinkle ridge contiguous to Dorsum Termier, within south-southwestern Mare Crisium, may help us understand the rich morphology of this Constellation region of interest. The scene depicted above is 184 meters from the 460 meter field Featured Image headlined by the Lunar Reconnaissance Orbiter Camera (LROC) News System, March 11, 2010 [NASA/GSFC/Arizona State University].

Brett Denevi
LROC News System

The Constellation program region of interest located in Mare Crisium is a compelling Exploration site for many reasons. First, this site was visited by several Soviet landers - Luna 23 and Luna 24 both touched down in Crisium. Luna 24 succeeded in returning a 170 gram sample in 1976. Though the amount was small, it provided a wealth of information and an interesting mystery. The Luna 24 basalt has a titanium dioxide content of about 1%, placing it among the lowest abundances of any lunar basalt sampled. The titanium content of basalts on the Moon varies widely, from almost none up to nearly 15%; a much wider range than typically seen on Earth. Because samples were only returned from a few limited locations on the Moon, we use remote sensing data to fill in the gaps of our knowledge (read this PSRD article for more details).

Basalts that are rich in titanium absorb more light in ultraviolet and visible wavelengths than those with less titanium, and many people have used this relationship to estimate titanium contents for mare basalts across the Moon. However, in the case of Mare Crisium, the remote sensing estimates put the titanium abundance at two to four times higher than what is seen in the Luna 24 samples. Plus, the way the light is reflected from the samples (the reflectance spectrum) looks different from what spacecraft observe for Mare Crisium. Other landing sites for which we have samples and that we have observed with spacecraft do not show this difference. So what is happening in Mare Crisium, and why should we care?


Lunar Pioneer was late posting the latest Featured Image released by Arizona State's LROC team on Thursday, March 11. We were stunned with an embarrassment of riches. The wide-angle camera context for a truly remarkable narrow-angle (49 cm pp resolution) image release happened to be of an area about which we have a strong interest. Coincidentally, the area happens also to be one among 50 Constellation Regions of Interest (ROI's), in the southwestern Crisium basin. So we took more time to boot up both images together in the lunar map available to users of Google Earth. Additionally, the ROI and LROC Featured Images are also within the eastern extreme of the highest resolution topography of the Apollo orbital corridor Digital Elevation Model. We have a lot more to say about this area shortly, including an expression of our heart-felt appreciation for the recent addition of a newer Moon-wide higher resolution DEM beyond the confines just of the corridor. For the present, a taste of these LROC images are presented here in three dimensions.

As you can see, within minutes after a LROC image availability, it is now possible to quickly present something not unlike what a future crew might see out the port-side view after landing at the SW Crisium Constellation ROI landing site, flawed though it may be in terms of overall illumination.

Scientists love a good mystery, but it's also important because titanium is both a valuable resource that could be utilized when people return to the Moon, and titanium abundances can tell us about the lunar interior. Basalts formed by partially melting the lunar mantle billions of years ago, and the wide range in titanium contents can tell us about the wide range of compositions and processes in the lunar mantle. Most of the high titanium basalts appear to be concentrated on the lunar nearside. But why? A straightforward interpretation of the lunar magma ocean theory, where the Moon was partially or completely molten just after its formation, suggests that titanium should be globally distributed, but that's clearly not the case. Human exploration of this region will produce valuable sampling and fieldwork to address this question.

The geology of this site is also compelling. The Constellation site is located near the rim of the Crisium impact basin (see image below), and samples and field work would give insight into the processes that occurred during the formation of the basin, as well as the age of the basin. Was this impact basin part of the so-called lunar cataclysm? This site also contains beautiful wrinkle ridges, sites of compressive stresses that resulted in faulting and wrinkling of the mare basalt surface. In the image below, you can even see a wrinkle-ridge ring, where a buried crater localized the stresses.


LROC Wide-Angle Camera (WAC) monochrome image centered on the Crisium Constellation region of interest (ROI). The highlands area in the south is the rim of the Crisium impact basin (nearly four kilometers in elevation above the "sea floor" below) and wrinkle ridges and the rim of one of at least three nearly submerged craters in the vicinity is apparent. The arrow points to the location of the center of the Narrow Angle Camera Featured Image and the WAC field is 62 km across [LROC WAC M117107778ME - NASA/GSFC/Arizona State University].

In the WAC monochrome image above, the arrow indicates the location of the NAC frame at the beginning of this post, which shows a very small portion of a wrinkle ridge. A fascinating feature of this ridge, when seen in high resolution, is a surface strewn with boulders. Perhaps these were generated by the breakup of the mare basalt, visible now because of the faulting and folding that created this ridge. (Judge for yourself exploring the full-resolution NAC frame here.)

Lunar scientists (not engineers) love boulders because they usually come from below the surficial regolith layer and can indicate buried rock units of different compositions. Some have suggested Luna 24 sampled a basalt unit that was buried by a subsequent lava flow of a different composition and only exposed where impact craters excavated material from a depth. This scenario would explain why spacecraft don't see the sampled material widespread on the surface. Visiting the Crisium region of interest could help scientists unravel this interesting puzzle.

Below: A very small part of the original LROC NAC image (M119468420LE) - 460 meter-square field reduced from the original here as context for the first image at the top of this post, and yet another demonstration of how scale can be a very difficult thing to grasp in lunar photography. In the Second Image from the TOP, the same area below is shown as the slightly darker gray square at bottom center, rendering the 460 meter field from a slightly different perspective and within the whole NAC frame strip from which it was taken - and subsequently within the larger WAC image release discussed her - all reproduced in Google Earth. (Click on image below for the 1000 pixel original).


Below: In Google Earth, looking west, the whole of the ROI can be seen, though admittedly very poorly constrained to this 400 pixel-wide column. The scene below is also an unfortunate confusion of solar illuminations, with the LROC WAC image of the Region Of Interest highlighted by long evening shadow and the Apollo 15 metric imagery below and beyond when the area was under a late morning sun in late July 1971. Additionally, the very dark band of the LROC NAC Featured Image (visible in lighter gray in the Second image from TOP) traces out LRO polar orbit (#2740) of January 30, 2010.

Thursday, March 4, 2010

Lunar elevation models come in many forms

Howard Fink has a gift for Charles Wood (LPOD). One of four cast models of the Hadley Rille Delta, landing site of Apollo 15 and, for many years, the topography of the lunar surface best surveyed from lunar orbit by laser altimetry (>10 million points). At top is a close-up of the cast on the lower right, tweaked for detail. At middle is a glance at the same area as seen in Google Moon from a slightly different angle for context. That scene is overlaid with Apollo, LROC and Chandrayaan Mini-SAR data. And below are each of the four casts by Howard. For a full-size view, he has uploaded that image to his website HERE. For more information and detailed views of the work, see Apollo 15 landing site in 3-D.