Saturday, October 23, 2010

Where are the wettest places on the Moon


High resolution (~15 km) polar maps of collimated epithermal neutrons created by the LRO Lunar Exploration Neutron Detector (LEND) team. The permanently shadowed region at Cabeus shows an indication of 4% hydrogen (by weight), while the Shoemaker crater neutron suppression signature, entirely within a widespread PSR, shows a signature consistent with 2%. Note that the crater Faustini, similarly situated and permanently shadowed, shows a very average polar neutron suppression. The reason for this disparity is not yet known.

The Lunar Exploration Neutron Detector (LEND) flying with LRO has enabled investigators to create high-resolution (15) km) maps of the collimated epithermal neutron counting rate over the lunar poles.

Overlapping these data upon new and improved maps of the Moon's confirmed permanently shadowed regions (PSRs) there has proven puzzling. Though the neutron suppression maps from Lunar Prospector had already strongly hinted that hydrogen, most likely in the form of water ice, might be more widespread - outside - permanent shadow - than cold trap placement models yet suggested, many attributed this to the low resolution of the 1999 neutron instrument.

Now LEND has identified several of what are being called "Neutron Suppression Regions," using only neutron measurement data, and the result has been what are now three types of NSRs. There are NSR's "well-correlated" with a PSR, NSRs well-correlated with a part of a PSR that nevertheless stretch well outside the shadows into areas illuminated by the Sun. Finally, there are NSRs not correlated with any large PSR. In fact, taken in all, there are as many areas typified by neutron suppression outside permanent shadow as inside.

The picture developing of the new lunar hydrology, a daily cycle and the volatiles (and now additionally a surprising variety of exotic elements and compounds) stuck within polar cold-traps is has led to yet another rediscovery of the Moon.

Below are links to the slide presentations (pdf) that accompanied the LEND team's reports about their findings made to the Annual Lunar Exploration Analysis Group (LEAG) Conference on September 16, 2010:

Main Results from LEND Instrument After One Year of Lunar Mapping Onboard NASA’s LRO
Mitrofanov, Litvak & Sanin, et.al.

Which Spot on the Moon has the Highest content of Hydrogen?
Sanin, Mitrofanov & Litvak, et.al.

Much of the Hydrogen Enrichment near the Lunar South Polar is Outside the Permanently Shadowed Regions
Boynton, Mitrofanov & Sanin, et.al.


LRO laser altimetry (LOLA) together with neutron suppression measurements (LEND) are combined to show the 72 sq. km permanently shadowed region targeted by LCROSS is not the only contiguous area there where a neutron suppression consistent with the hydrogen (in the form of water) has been detected. Areas outside the white boundary are regularly illuminated by the Sun. (Larger view, HERE) [NASA/LOLA/LEND].

Strange lunar brew


Bullseye on the Moon -- the LCROSS impact site at Cabeus, October 9, 2009. Along with 50 percent more water on the Moon than the best previous estimates, the Centaur stage impact kicked up as much Mercury as water [LCROSS/NIR].

Paul D. Spudis
The Once & Future Moon
Smithsonian Air & Space

A year ago, the LCROSS (Lunar CRater Observation and Sensing Satellite) mission team announced the detection of water in the impact plume produced after the Centaur separated from the Lunar Reconnaissance Orbiter (LRO) and crashed into the Moon. We now have more detailed information on the water and some other substances detected during that event. Some of these elements and compounds were expected, others are very strange indeed.

Because the spin axis of the Moon is perpendicular to the plane of its orbit with respect to the sun, the Moon’s poles get grazing solar illumination. This means that the floors of craters and low areas are in permanent shadow and extremely cold. The DIVINER instrument on LRO measured these temperatures for the first time and found some areas as cold as 25 Kelvin (25° above absolute zero, -273° C), making them colder than the estimated surface temperature of Pluto. Because these areas are so cold, any molecule or atom of a volatile substance that gets into them is trapped. These dark areas are referred to as “cold traps” where, over very long periods of time (billions of years) significant amounts of these elements and compounds might accumulate.

Since water is one of the most abundant compounds found in the Solar System, we expected some accumulation of it at the lunar poles. It was on this basis that scientists have been searching for water ice on the Moon for the past 20 years, using a wide variety of techniques, including spectral reflectance, radar, neutron and gamma-ray sensing and ultraviolet imaging – all techniques done remotely from space. Landing at the poles and surveying the lunar surface to actually see what was there, was next on the list.

Just after it has been relegated to a “been there, done that” status, the Moon again shows us we have a lot to learn about its history, physical state and the potential value of its resources. We must take the initiative to learn more as the Moon is crucial in developing and advancing a sustainable space faring infrastructure.

A plan to soft-land a long-lived rover near the poles and conduct an extended surface mission surveying polar resources was discarded when the Ares rocket became the focus of NASA’s lunar return effort. A smaller mission was improvised to hurl an impactor (the spent upper stage of the rocket that launched the Lunar Reconnaissance Orbiter) into the polar deposits so the spacecraft could analyze the material shot off into space from the collision. Although this is still “remote sensing” of the deposits, at least the material would be ejected out of the dark, cold regions into open space where we might get a look not only at the water but also some other volatile substances that might be there.

The LCROSS team’s published data from the mission reveals a cold witches’ brew deep inside Cabeus crater. The finding of significant lunar water has confirmed data from earlier missions, while the ejecta plume from the LCROSS impact reveals more modest amounts of a variety of other substances. The Near-IR spectrometers on the LCROSS shepherding satellite detected abundant water (H2O) but also hydrogen sulfide (H2S), ammonia (NH3), methanol (CH3OH), methane (CH4), ethylene (C2H4) and sulfur dioxide (SO2). The uv-vis spectrometer found carbon dioxide (CO2), sodium, silver, and cyanide (CN). Aboard the distant LRO spacecraft, the ultraviolet LAMP imager detected hydrogen (H2), nitrogen, carbon monoxide (CO), sodium, mercury, zinc, gold (!), and calcium. But water, present in quantities between 5 and 10 weight percent, is the most abundant volatile substance present.

In lunar terms, this is a very odd association of materials. Whereas we had found these elements and compounds in the returned lunar rock samples (some in vanishingly small quantities), the presence of significant amounts of ammonia and methane is significant; these gases are common components of cometary nuclei. One idea about the origin of water ice at the poles of the Moon is that it is derived largely from comets, which have continually hit the Moon over geological time. An alternative model suggests that most of the volatiles of this cometary debris are lost to space and the water and hydroxyl (OH) molecules found on the lunar surface come instead from the interaction of solar wind hydrogen with metal oxides in the lunar soil. In this model, heat provided by micrometeorite impact causes the solar wind hydrogen to reduce the metal oxides into native metal (like Fe0) and OH, which attaches itself to mineral faces. This hydroxyl is widespread over the lunar surface and was mapped by the Moon Mineralogy Mapper on the Chandrayaan-1 spacecraft over a year ago.

The newly published LCROSS data showing large amounts of volatiles normally associated with comets strongly suggest that at least some of the lunar water is of cometary origin. However, the detection of large amounts of free hydrogen (H2) in the ejecta plume supports significant preservation of solar wind hydrogen in the cold traps as well. It appears that both sources contribute to the water on the Moon and more analysis is necessary to determine which process is responsible for what fraction of the deposits. The clear message of the new work is that the processes and history of lunar volatiles are complex and poorly understood. Once again, the Moon shows us that its history, as well as its current state, is richer and more nuanced than we had thought.

The LCROSS results indicate that a variety of useful substances are present in the polar cold traps. Water is our principal object for future resource extraction, being one of the most valuable and readily available substances for spaceflight imaginable (i.e., a life-support consumable, a medium of energy storage and rocket propellant). However, both ammonia and methane have a variety of industrial uses, as well as being ready sources of nitrogen and carbon, two elements essential for the support of human life. Sulfur is also a useful element and appears to be present in fair quantity as both native sulfur and sulfide. Some reports suggest that the high concentration of mercury makes lunar water unusable; this impression is incorrect. Impurities can be removed from harvested polar water easily through the technique of fractional distillation, a common industrial process on the Earth for hundreds of years.

Some of the components of the polar suite are perplexing. For example, silver (Ag) shows a very strong peak in the uv-vis spectra. In lunar samples, silver is extremely sparse, occurring at the parts per billion level. Mercury (Hg) is also rare in lunar samples but it is a very volatile substance and the processes that preserve volatiles in the cold traps would work to increase and concentrate mercury at the poles relative to equatorial areas of the Moon. But silver is not volatile (its melting temperature is about 1000° C), so why would it concentrate at the poles? With such bizarre associations, scientists will be looking over this new data with keen interest. To determine the composition, physical nature and distribution of these deposits, a robotic surface rover needs to be sent into the polar cold traps to take detailed measurements.

Just after it has been relegated to a “been there, done that” status, the Moon again shows us we have a lot to learn about its history, physical state and the potential value of its resources. We must take the initiative to learn more as the Moon is crucial in developing and advancing a sustainable space faring infrastructure.

Thursday, October 21, 2010

LRO analysis of LCROSS data proves essential

Updated October 25, 2010, 1837 UT

Investigators and teams operating advanced instruments flying on-board Lunar Reconnaissance Orbiter mapped the impact of the LCROSS impactor and its aftermath, October 9, 2009. Their full reports were discussed October 21, 2010, coincident with being published in the journal Science. LRO approaches the impact, seen as a true false-color map of the measured dissipation of heat 21 seconds after the impact in the permanently shadowed region of the Cabeus crater group [NASA/GSFC/UCLA/SVS].

Bill Steigerwald
Goddard Space Flight Center

Last year on October 9, NASA's LCROSS (Lunar Crater Remote Observation and Sensing Satellite) intentionally crashed its companion Centaur upper stage into the Cabeus crater near the lunar south pole. The idea was to kick up debris from the bottom of the crater so its composition could be analyzed. The Centaur hit at over 5,600 miles per hour, sending up a plume of material over 12 miles high.

"Seeing mostly pure water ice grains in the plume means water ice was somehow delivered or chemical processes are causing ice to accumulate in large quantities," said Anthony Colaprete, LCROSS project scientist and principal investigator at NASA's Ames Research Center, Moffett Field, CA. "Furthermore, the diversity and abundance of certain materials called volatiles in the plume, suggest a variety of sources, like comets and asteroids, and an active water cycle within the lunar shadows."

LCROSS was a companion mission to NASA's Lunar Reconnaissance Orbiter (LRO) mission, launched in tandem with the advanced lunar orbiter, June 18, 2009.

The two missions were designed to work together, and support from LRO was critical to the success of LCROSS. During impact, LRO, which is normally looking at the lunar surface, was tilted toward the horizon so it could observe the plume. Shortly after the Centaur hit the Moon, LRO flew past debris and gas from the impact while its instruments collected data.

"LRO assisted LCROSS in two primary ways -- selecting the impact site and confirming the LCROSS observations," said Gordon Chin of Goddard Space Flight Center, LRO associate project scientist.


The LCROSS Shepherding and Sensing module immediately follows the empty Centaur impactor, returning data to Earth on the latter's impact and the formation of a 30 meter crater seconds before its own impact nearby. LRO approached and passed the relatively "water-rich" 72 square km permanently shadowed target and orbited nearly overhead the following orbit, measuring the signature of both impacts. Both vehicles had been launched together the previous June. (LRO, still in orbit, has now orbited the Moon more than 6000 times) Scene taken from new animation released by NASA, October 21, 2010 [NASA/GSFC/ARC].

"Since observatories on Earth were also planning to view the impact, there were a lot of constraints on the location -- the impact plume had to rise out of the crater and into sunlight, and it had to be visible from Earth," said Chin.

Prior to the impact, LRO's instruments worked together to map and provide details on the polar regions, according to Chin. For example, LRO's Lunar Orbiter Laser Altimeter (LOLA) instrument built up three-dimensional (topographic) maps of the surface. This data was plugged into computer simulations to see how shadows change as the Moon moves in its orbit, so that regions in permanent shadow could be identified. The Lunar Reconnaissance Orbiter Camera (LROC) helped by making images of the actual regions of light and shade, which were used to verify the simulation's accuracy. Finally, LOLA measured the depths of polar craters to find areas where the impact could still be seen from Earth.

Since hydrogen is a component of water, maps of lunar hydrogen deposits are useful for finding areas that might hold water. Preliminary hydrogen maps were provided by the spacecraft's Lunar Exploration Neutron Detector (LEND) instrument. Regions that had relatively high amounts of hydrogen were identified as the most promising for the impact.

"Over a year ago, we formally suggested Cabeus to the LCROSS principal investigator," said LEND principal investigator, Igor Mitrofanov of the Institute for Space Research, Moscow. "According to our current data, the regolith within the Cabeus impact crater may have the highest content of water anywhere on the Moon, perhaps up 4.0 percent weight."

"Originally, the LCROSS team was going with a site further north than the Cabeus crater, because it was better for Earth visibility," said Chin. "However, LEND revealed that the area did not have a high hydrogen concentration, but Cabeus did. Also, Diviner showed that Cabeus was one of the coldest sites, and LOLA indicated it was in permanent shadow. So, we were able to inform the decision to aim for Cabeus further south -- while it was a little less visible from Earth, Cabeus was ultimately better for what we were trying to find."

Temperature maps from LRO's Diviner instrument were also crucial to identify where the coldest places were.

David Paige, principal Investigator of the Diviner instrument from the University of California, Los Angeles, used temperature measurements of the lunar south pole obtained by Diviner to model the stability of water ice both at and near the surface.

"The temperatures inside these permanently shadowed craters are even colder than we had expected. Our model results indicate that in these extreme cold conditions, surface deposits of water ice would almost certainly be stable," said Paige, "but perhaps more significantly, these areas are surrounded by much larger permafrost regions where ice could be stable just beneath the surface."

"We conclude that large areas of the lunar south pole are cold enough to trap not only water ice, but other volatile compounds (substances with low boiling points) such as sulfur dioxide, carbon dioxide, formaldehyde, ammonia, methanol, mercury and sodium," Paige added.

UCLA graduate student and Diviner team member, Paul Hayne, was monitoring the data in real-time as it was sent back from Diviner.


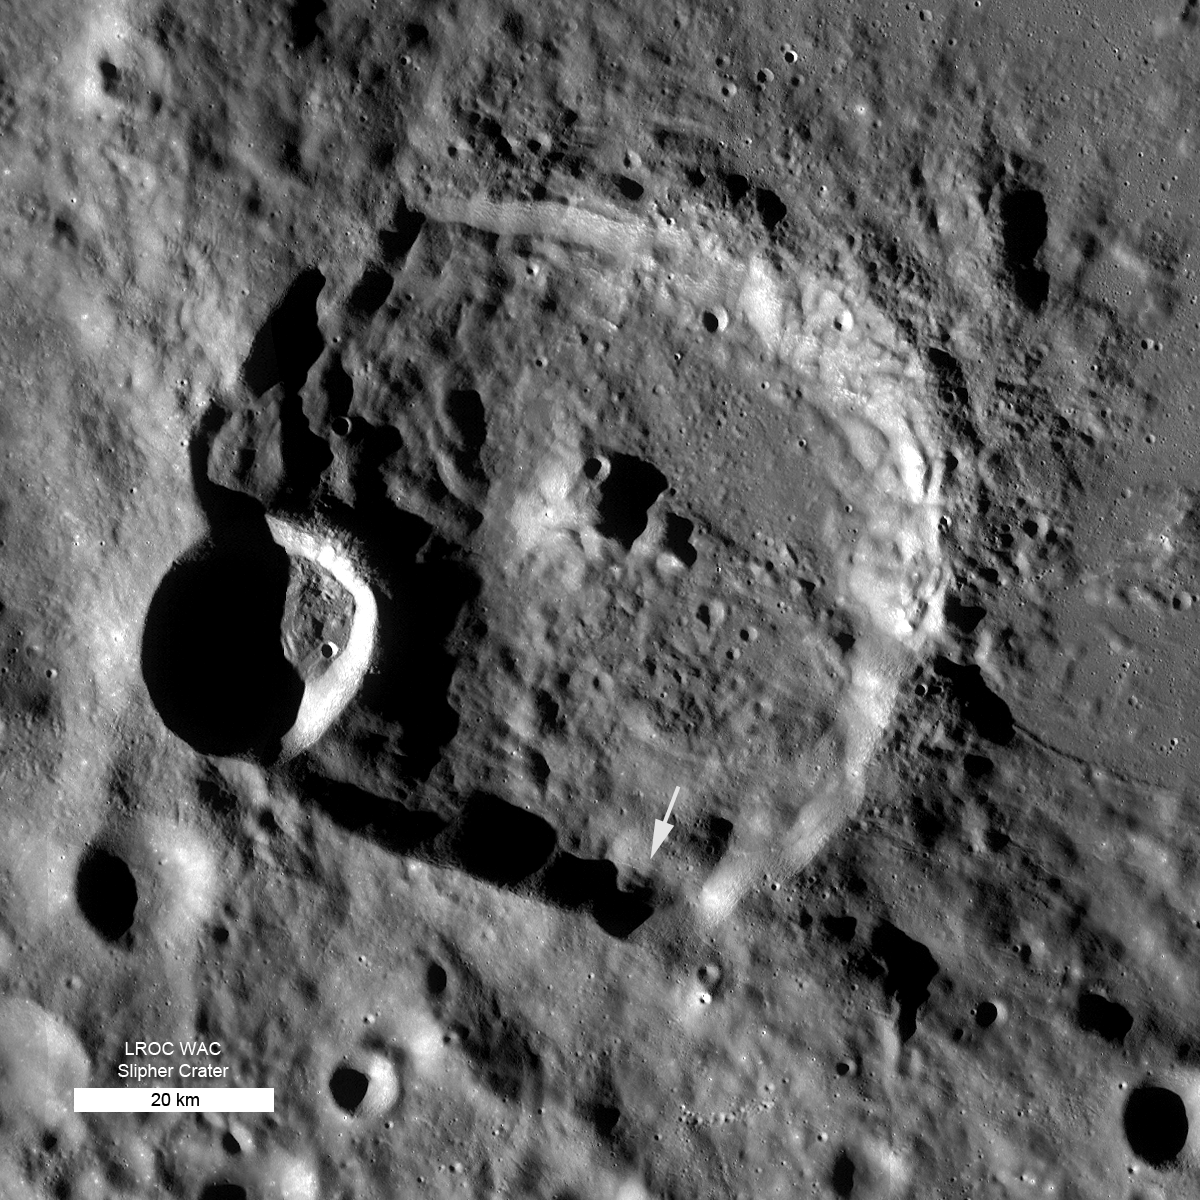
Diviner brightness temperature swath acquired about 90 seconds after the LCROSS impact, the location of which is indicated by the white arrow. Based on the Diviner measurements, the impact site was heated to more than 380°C (1,300°F) Click HERE for larger view [UCLA/NASA/JPL/GSFC].

"During the fly-by 90 seconds after impact, all seven of Diviner's infrared channels measured an enhanced thermal signal from the crater. The more sensitive of its two solar channels also measured the thermal signal, along with reflected sunlight from the impact plume. Two hours later, the three longest wavelength channels picked up the signal, and after four hours only one channel detected anything above the background temperature."

Scientists were able to learn two things from these measurements: first, they were able to constrain the mass of material that was ejected outwards into space from the impact crater; second, they were able to infer the initial temperature and make estimates about the effects of ice in the soil on the observed cooling behavior.

Another LRO instrument, the Lyman-Alpha Mapping Project (LAMP), used data on the gas cloud to confirm the presence of the molecular hydrogen, carbon monoxide and atomic mercury, along with smaller amounts of calcium and magnesium, all in gaseous form.

"We had hints from Apollo soils and models that the volatiles we see in the impact plume have been long collecting near the Moon’s polar regions," said Randy Gladstone, LAMP acting principal investigator, of Southwest Research Institute (SwRI) in San Antonio, Texas. "Now we have confirmation."


The Lyman Alpha Mapping Project (LAMP) ultraviolet spectrograph onboard LRO observed the LCROSS plume as far-ultraviolet emissions from the fluorescence of sunlight by molecular hydrogen and carbon monoxide, plus resonantly scattered sunlight from atomic mercury, with contributions from calcium and magnesium. The observed light curve is well simulated by the expansion of a vapor cloud at a temperature of ~1000 kelvin, containing ~570 kilograms (kg) of carbon monoxide, ~140 kg of molecular hydrogen, ~160 kg of calcium, ~120 kg of mercury, and ~40 kg of magnesium [NASA/LRO/SwRI].

"The detection of mercury in the soil was the biggest surprise, especially that it’s in about the same abundance as the water detected by LCROSS," said Kurt Retherford, LAMP team member, also of SwRI.

"The observations by the suite of LRO and LCROSS instruments demonstrate the moon has a complex environment that experiences intriguing chemical processes," said Richard Vondrak, LRO project scientist at NASA Goddard. "This knowledge can open doors to new areas of research and exploration."

Related Links> NASA press release | Media briefing materials


View the full-size video, HERE.

LRO-Diviner: Widespread water on the Moon

Scientists from NASA’s Diviner Lunar Radiometer Experiment team published research in this week’s issue of Science that points to the widespread presence of water ice in large areas of the lunar south pole.

The Diviner Lunar Radiometer aboard NASA’s Lunar Reconnaissance Orbiter (LRO) has made the first-ever infrared measurements of temperatures in the permanently shadowed craters at the lunar poles. In October 2009, Diviner also made the first infrared observations of a controlled planetary impact when LCROSS, the companion spacecraft to LRO, slammed into one of the coldest of these craters in an experiment to confirm the presence of absence of water ice.
David Paige, Principal Investigator of the instrument, and lead author of one of two Science papers based on its observations, used temperature measurements of the lunar south pole obtained by Diviner to model the stability of water ice both at and near the surface.

“The temperatures inside these permanently-shadowed craters are even colder than we had expected. Our model results indicate that in these extreme cold conditions, surface deposits of water ice would almost certainly be stable,” says Paige, “but perhaps more significantly, these areas are surrounded by much larger permafrost regions where ice could be stable just beneath the surface.”

This lunar ‘permafrost’ would be analogous to the high-latitude terrain found on the Earth and on Mars, where sub-freezing temperatures persist below the surface throughout the year.

“These permafrost regions may receive direct sunlight at certain times of the year, but they maintain annual maximum subsurface temperatures that are sufficiently cold to prevent significant amounts of ice from vaporizing,” says Paige.

Given that these lunar permafrost regions are not in permanent shadow, surface lighting and thermal conditions in these locations would be far more hospitable for humans, which makes them of prime interest for future manned missions to the moon. Subsurface water ice deposits are also likely to be more stable than surface deposits of water ice because they are protected from bombardment by ultraviolet radiation and energetic cosmic particles.

“We conclude that large areas of the lunar south pole are cold enough to trap not only water ice, but other volatile compounds (substances with low boiling points) such as sulphur dioxide, carbon dioxide, formaldehyde, ammonia, methanol, mercury and sodium.”


LRO Diviner Lunar Radiometer Experiment surface temperature map of the south polar region of the Moon. The data were acquired during September and October, 2009 when south polar temperatures were close to their annual maximum values. The map shows the locations of several intensely cold impact craters that are potential cold traps for water ice as well as a range of other icy compounds commonly observed in comets. The approximate maximum temperatures at which these compounds would be frozen in place for more than a billion years is shown next to the scale on the right. The LCROSS spacecraft was targeted to impact one of the coldest of these craters, and many of these compounds, including water, were observed in the LCROSS ejecta plume. Based on an illustration in the journal Science [UCLA/JPL/GSFC/NASA].

LRO Diviner Lunar Radiometer Experiment surface temperature map of the south polar region of the Moon. The data were acquired during September and October, 2009 when south polar temperatures were close to their annual maximum values. The map shows the locations of several intensely cold impact craters that are potential cold traps for water ice as well as a range of other icy compounds commonly observed in comets. The approximate maximum temperatures at which these compounds would be frozen in place for more than a billion years is shown next to the scale on the right. The LCROSS spacecraft was targeted to impact one of the coldest of these craters, and many of these compounds, including water, were observed in the LCROSS ejecta plume. Credit: Based on a figure in the journal Science (UCLA/JPL/GSFC/NASA).

A representative cross-section of these substances was detected by the LCROSS near-infrared spectrometers when its upper stage rocket impacted into Cabeus crater, ejecting a host of material that was previously buried beneath its surface.

The impact site was situated within a permanently-shadowed part of Cabeus with an average annual temperature of 37 K (-393 °F), making it one of the coldest locations near the lunar south pole. Temperature data from Diviner played a key role in the selection of Cabeus as the target for LCROSS, and when it came time for impact, Diviner scientists and engineers made sure that the instrument had a front row seat: Diviner targeted the impact site for 8 orbits spaced roughly 2 hours apart, the closest of which was timed to pass by 90 seconds after impact. It observed an enhanced thermal signal on this and two subsequent orbits.

Paul Hayne, UCLA graduate student and lead author of the second paper appearing in Science, was monitoring the data in real-time as it was sent back from Diviner.

“During the fly-by 90 seconds after impact, all seven of Diviner’s infrared channels measured an enhanced thermal signal from the crater. The more sensitive of its two solar channels also measured the thermal signal, along with reflected sunlight from the impact plume. Two hours later, the three longest wavelength channels picked up the signal, and after four hours only one channel detected anything above the background temperature.”


Diviner brightness temperature measurements of the lunar surface near the LCROSS impact site in Cabeus crater. (A) Before and after images of the LCROSS impact site in each of five different Diviner channels, with the thermal emission from the impact circled in the right-hand column, taken approximately 90 seconds after the Centaur impacted the lunar surface. (B) Pre-impact surface temperatures in Cabeus crater recorded by Diviner indicate the LCROSS impact site ('x') was only 40 degrees Celsius above absolute zero just before the impact . See full-sized illustration, HERE. [Science]

Scientists were able to learn two things from these measurements: firstly, they were able to constrain the mass of material that was ejected outwards into space from the impact crater; secondly, they were able to infer the initial temperature and make estimates about the effects of ice in the soil on the observed cooling behavior.

“Diviner’s solar channel measured scattered sunlight from the impact plume over an area of 140 km2 (54 sq mi). Using this measurement we were able to place constraints on the mass of the cloud at between 1,200 kg and 5,800 kg (2,700 - 12,800 lbs), which is consistent with measurements by the LCROSS Shepherding Spacecraft,” says Hayne. “This is important because the cloud mass is used to estimate the abundance of water observed by the LCROSS spectrometers.”

“In addition, we determined that in order to agree with the data from each of Diviner’s channels, the impact must have heated a region of 30 to 200 m2 (320 – 2150 ft2) to at least 950 K (1250 °F). This concentrated region was surrounded by a larger, lower temperature component that would have included the surrounding blanket of material excavated by the impact.”

Given that ice within soil pore spaces influences cooling because it uses up heat energy in the process of sublimating, and conducts heat more efficiently than lunar soil does, scientists were able to use Diviner’s measurements of cooling at the impact site to place constraints on the proportion of volatiles present.

“The fact that heated material was still visible to Diviner after four hours indicates LCROSS did not hit a skating rink; the ice must have been mixed within the soil,” says Hayne, “we estimate that for an area of 30 to 200 m2, the steaming crater could produce more than enough water vapor to account for what was observed by LCROSS over a four minute period.”

“Although Cabeus crater is typical of the coldest areas on the moon today, we have determined that billions of years ago, smaller craters with steeper walls would have made more favorable cold-traps,” says Paige, “it is therefore possible that the craters which have accumulated the most ice are not the coldest ones.”

The results presented in both papers represent strong evidence in support of the theory that volatiles have been delivered to the moon by impacts by icy bodies from the outer solar system and then ‘cold-trapped’ at the lunar poles.

The research covered here is from two of six papers published in Science by scientists from LCROSS and LRO. The research was funded by NASA.

Surprising gas from LAMP

From Lunar Pioneer Album 3 -
Southwest Research Institute's LRO/LAMP website, redirected from LRO's main site at Goddard Space Flight Center, remains virtually unchanged since before the launch of LRO, and it's public website (if you can find it) refers to operations in the future. The "Soon" in the "Coming Soon!" above is characteristic of a genuine "ghost site."

EDITOR'S NOTE & OPINION: Out of deep respect for the outstanding, cutting-edge work accomplished by the Southwest Research Institute (SwRI), and because of their contribution to the success of the on-going mission of the Lunar Reconnaissance Orbiter, we're pleased to post the following news release, related to the journal Science publishing research related to the impact of the LCROSS mission, one year ago.

However, of all the experiments and teams contributing to the LRO mission, launched at a huge cost to the American taxpayer, we would be remiss in not expressing our deep displeasure with an apparent complete lack of public outreach by those operating the Lyman-Alpha Mapping Project (LAMP). Of all the LRO instruments, only one other has been more disrespectful of the wider community of proponents of lunar exploration. Only the CRaTER project, whose long publicized website at Boston University has simply disappeared, has done a worse job of keeping the public informed as to their progress.

The Southwest Research Institute's outreach has, since long before LRO/LCROSS was launched on June 18, 2009, kept tantalizing messages posted online advertising features "coming soon," for example, that never arrive, and the team's public information stewardship receives a a failing grade equal at least to that deserved by Boston University and the CRaTER experiment team.

Of all the LRO experiment public outreach efforts, that of the Lunar Reconnaissance Orbiter Camera (LROC) has alone been outstanding, and they deserve to be highly commended.

The Lunar Orbiter Laser Altimeter (LOLA) public information guardians tried, for a time, to make a solid effort and unfortunately also dropped the ball. An LOLA "Image of the Week" feature has now not been undated since the middle of July, in a ridiculous state of affairs, a mocking feature posted on the NASA and GSFC primary LRO public websites.

Diviner and the Mini-RF teams have at least made the effort of keeping citizen-scientists updated, without promising more than they could deliver, and when delivering data products, delivering solid reports. The Russian Institute of Science LEND mission has made results available at least with publicly available monographs and reports.

We take great exception with the presumption expressed by the constant silence out of the Southwest Research Institute and to their apparent contempt for the those interested in the results of their part in the landmark mission of the LRO.
- Joel Raupe
Raleigh, North Carolina

-------
"LRO's LAMP ultraviolet spectrograph observes
LCROSS blast, detects surprising gases in impact plume
"

San Antonio — Oct. 21, 2010 — NASA's Lunar Reconnaissance Orbiter (LRO) and its sophisticated suite of instruments have determined that hydrogen, mercury and other volatile substances are present in permanently shaded soils on the Moon, according to a paper published today in Science.

The Lunar Crater Remote Observation and Sensing Satellite (LCROSS), which launched with LRO, was intentionally crashed onto the Moon's surface Oct. 9, 2009, while LRO instruments watched. About 90 seconds after LCROSS hit the Moon, LRO flew past the debris plume raised by the impact, while the Lyman Alpha Mapping Project (LAMP) and other instruments collected data. Using these data, LAMP team members eventually confirmed the presence of the gases molecular hydrogen, carbon monoxide and atomic mercury, along with smaller amounts of calcium and magnesium, also in gas form.

"We had hints from Apollo soils and models that the volatiles we see in the impact plume have been long collecting near the Moon's polar regions," says Dr. Randy Gladstone, LAMP acting principal investigator, of Southwest Research Institute in San Antonio. "Now we have confirmation."

The point of impact was the Cabeus crater near the lunar south pole. The tiny tilt of the Moon's rotation axis allows the floors of craters near the poles to be permanently shaded from direct sunshine. Without sunlight, temperatures in these areas can be as low as 35 to 100 Kelvin (degrees above absolute zero) – so cold that almost all volatiles that find their way there become trapped. Ongoing micrometeorite impacts cover them with dirt, further isolating them from exposure and possible escape.

LRO's findings are valuable to the future consideration of robotic and manned Moon base locations. Just as the poles have nearby crater floors with permanently shaded regions because of the Moon's orientation to the Sun, they also have nearby mountains and crater rims that are in nearly perpetual sunlight, which would enable the placement and operation of solar-powered systems and equipment. The discovery of water-ice and other resources in the region could also reduce the need to transport resources from Earth for use by astronauts.

"The detection of mercury in the soil was the biggest surprise, especially that it's in about the same abundance as the water detected by LCROSS," says Kurt Retherford, LAMP team member, also of SwRI. "Its toxicity could present a challenge for human exploration."

Developed by Southwest Research Institute, LAMP uses a novel method to peer into the darkness of the Moon's permanently shadowed regions. The ultraviolet spectrograph observes the nightside lunar surface using light from nearby space (and stars), which bathes all bodies in space in a soft glow. This Lyman-alpha glow is invisible to human eyes, but visible to LAMP as it reflects off the Moon. Analyses of the emissions, in collaboration with other LRO instruments, help determine lunar surface properties.

Following the LCROSS impact observations, LAMP continues its investigation of the ultraviolet reflectance properties and composition of the lunar surface and the composition of the lunar atmosphere. Since the conclusion of a one-year reconnaissance mission under NASA's Exploration Systems Mission Directorate, the Science Mission Directorate has assumed oversight of more in-depth investigations for the science instruments. During the science investigation, LAMP will shift into more detailed evaluations of the Moon's atmosphere and its variability.

The paper, "LRO-LAMP Observations of the LCROSS Impact Plume," by G.R. Gladstone, D.M. Hurley, K.D. Retherford, P.D. Feldman, W.R. Pryor, J.-Y. Chaufray, M. Versteeg, T.K. Greathouse, A.J. Steffl, H. Throop, J.W. Parker, D.E. Kaufmann, A.F. Egan, M.W. Davis, D.C. Slater, J. Mukherjee, P.F. Miles, A.R. Hendrix, A. Colaprete, and S.A. Stern, was published in the Oct. 22 issue of Science.

Wednesday, October 20, 2010

A first lunar transit for SDO


Close up on a solar prominence, with startling clarity, the New Moon's disk slides between the new Solar Dynamics Observatory in geosynchronous orbit and it's constant view of the Sun. The inconstant Moon is our humbling reminder how comparatively little things often obscure our view of a much bigger picture [NASA/GSFC/SDO].

Sun and Moon - A first for the Solar Dynamics Observatory (SDO), and it was visually engaging too. On October 7, 2010, SDO observed its first lunar transit when the new Moon passed directly between the spacecraft (in its geosynchronous orbit) and the Sun. With SDO watching the Sun in a wavelength of extreme ultraviolet light, the dark Moon created a partial eclipse of the Sun.

These images, while unusual and cool to see, have practical value to the SDO science team. Karel Schrijver of Lockheed-Martin's Solar and Astrophysics Lab explains: "The very sharp edge of the lunar limb allows us to measure the in-orbit characteristics of the telescope e.g., light diffraction on optics and filter support grids. Once these are characterized, we can use that information to correct our data for instrumental effects and sharpen up the images to even more detail."

The image below shows a full disk version, view the larger story here.

LROC: Rimae Sirsalis

The Moon's longest rille system are the Rimae Sirsalis, most likely a very old fault-related feature subsequently bombarded and also deeply grooved perpendicularly at its upper reaches by the energetic debris cast off by the Orientale-impact. The fault, more than 400 km-long, is a model of lunar stratigraphy. It cuts through the highlands of the Near side's southwestern limb near Byrgius and, in a relentless and nearly straight line - like a modern highway - to a terminus under Oceanus Procellarum. Click here for the full-sized mosaic [NASA/GSFC/Arizona State University].
Joel Raupe
Lunar Pioneer
 
Those whose interests include lunar magnetic anomalies, and rilles or faults, have long been intrigued by the Sirsalis crater group and the Moon's longest rille nearby, Rimae Sirsalis. From Earth our perspective of the highlands southwest of Oceanus Procellarum, where these features abide, is highly foreshortened, and a bright nearly Full Moon overwhelms the eye and our optics by the time the sun finally rises over the extensive area haunted by the Sirsalis features. Nevertheless, the thin clear line slicing its way from the limb northeast into the Procellarum depths draws the eye, especially during favorable libration.

A sub-satellite released by Apollo 16 traced out a crustal magnetic field associated with Rimae Sirsalis that was unusual even for the Moon. Over several high altitude passes the influence of the field was found to be tightly associated with the surface feature, more so in the highland west than where it disappears under Procellarum. The field was indicative of magnetized rock, either molten or ground up, having long ago pushed up from deep within the Moon along a very long and apparently very deep line.

Perhaps the Sirsalis fault is the remnant of a kind of plate tectonics that lasted only a very brief time in the Moon's early history. The kind of bright and fresh optical immaturity of surface regolith, the swirl albedo patterns seen under the influence of lunar magnetic anomalies elsewhere is more generalized here, either tightly associated with the surface features of the fault line, if these exist at all.

The magnetism associated with the Sirsalis fault has been discussed at length by Hood, Halekas and Head, to name just a few of the more prominent sources. The Sirsalis fault may be an intrusion, a dike at one time tapping into the lunar mantle and running upwards from at least 300 km below.

Perhaps more recent activity, after having been less than gently "jostled" awake by huge impacts more recently in its history, can explain some of the history seen at the surface. We can see the surface manifestation of this deep running but very thin (4 km) feature has to be older than Mare Orientale. In the perspective view below, grooving etched out radially from the center of the Orientale basin, more than 900 km away. That event, more than 3 billion years ago, superimposed its influence on the older rille.

In the image above (better seen here), 42 km-wide Sirsalis (12.5°S, 299.6°E) and it's older , less deep companion crater (a model of superposition all by themselves) stand by to the north as the fault passes under the ejecta blanket of a smaller, younger pair of super-positioned craters. Further along, the fault clearly passes over the rims and through the interior of another much older crater.

Creating as detailed a mosaic of the upper extremes of the Rimae Sirsalis, putting the whole system into the context of a single image, is a challenge even for LRO's Wide Angle Camera (LROC WAC). For the moment, we'll satisfy our curiosity with outstanding telescopic views and an artificial perspective view conjured up below.
For context, a foreshortened perspective view looking northeast from the southwestern Near side highlands, grooved by the impact event that created Orientale basin (lower left center) following the direction of Rimae Sirsalis to where it disappears under the inundation of Oceanus Procellarum. Japan and USGS laser altimetry and color-coded shaded relief mosaic in Google Earth v.5

The broad plain where the Rimae Sirsalis "crack" apparently originates, showing the perpendicular "grooves" that radiate from the basin-forming impact that excavated Mare Orientale, centered more than 900 km to the northwest. This closer look, courtesy of LROC Wide Angle Camera observations last May, shows much more was happening here when the Orientale impactor ejected its debris fan 3.1 billion years ago. More than a shockwave, the ejecta that returned to the surface here was molten, rebounding into pools and eventually channeling down the trace of the rille and northeastward toward Procellarum. Additionally, the weight of liquid that reformed the surface here appears to have pulled the surface, mirroring the very deep rille's shape, on either side of the broad Rimae Sirsalis valley. LROC WAC M129709429C-M129716196C-M129722993C (604nm), LRO orbits 4248-4250, May 28, 2010 [NASA/GSFC/Arizona State University].

Last updated July 14, 2012

Tuesday, October 19, 2010

The largest volcano on the Moon

From LRO WAC Album 1 -
The Heart of the Marius Domes (27.2 km field of view), from LROC WAC M116683214ME (December 29, 2009), much as they would appear as the morning terminator begins its sweep across the central Oceanus Procellarum, today, October 19, 2010 [NASA/GSFC/Arizona State University].

Sunrise at Marius Hills is a significant time for Moon watchers, even for those equipped with modest telescopes. The myriad domes there, only a bit higher in profile than the rolling elevation of the surrounding, vast basaltic plains of Oceanus Procellarum are briefly very starkly highlighted by long shadows. Very soon after, the terminator continues it endless westward, march and the domes (near 12.0°N, 306°E) quickly become difficult to see, overwhelmed by brighter albedo contrasts as a chief marker of topography under a high sun.

But the Sun was less than two degrees over the east when LRO swept up the dark scene above, much as it should be for the next few hours today, Tuesday, October 19, 2010.

In the long shadows above is the "Heart" of the Marius Domes, where a sinuous rille winds between the two largest domes of an enormous volcano China's Chang'E-1 investigators have labeled "Yutu." LRO Laser altimetry (LOLA) shows the many hundreds of domes west of Marius crater are clustered atop a larger bulge near the center of the Procellarum expanse.

No one has yet definitively identified Procellarum as a typical, fully formed round basin, though there are many theories, including the Gargantuan impact theory, where Procellarum originates as part of an impact, centered in northeastern Mare Tranquillitatis, whose outer circumference is larger than the entire Near side as the original source of the Moon's Near and Far side discontinuity.

Whatever the source of Procellarum, we know it's huge expanse was covered by molten flows in many places at many times. Thankfully, the occasional asteroid, comet or large meteor has pre-excavated the Procellarum floor, uncovering the history for future definitive dating.


Perspective view of the Constellation Region of Interest landing zone at the Sinuous Rille A "cobra head" formation in the Marius Hills, derived from LROC Narrow Angle Camera Digital Terrain Models [NASA/GSFC/Arizona State University].

LRO and the others building the huge new legacy of an international fleet of 21st century orbiters, are allowing investigators a closer look at the Marius Hills, and in a wider context - tied into neighbors like the Reiner Gamma swirl, the surrounding plains typified by minerals found nowhere else on the Moon, and perhaps even the Aristarchus Plateau and Mons Rümker. A casual glance at Oceanus Procellarum appears to show a huge semi-circle lunar "sea" devoid of anything as dynamic as "storms," but there is much more to be seen here for the patient observer.

The full LRO Wide Angle Camera (WAC) monochrome (689nm) observation M116696805ME was swept up from an altitude of 45.4 kilometers over the course of 2 minutes, 51 seconds during LRO orbit 2331, December 29, 2009.

Additional Reading:
Reiner Gamma in color
October 15, 2010

NASA@Science: "Down the rabbit-hole"
July 13, 2010

LROC: Marius Hills ROI
June 2, 1010

Hearts of Marius, Shadows of Yutu
May 29, 1010

Local Topography and Reiner Gamma
May 22, 2010

Lunar Swirl phenomena from LRO
May 17, 2010

LRO/LROC/LOLA: Marius Hills
March 20, 2010

LROC: Haruyama Cavern in the Marius Hills
March 2, 2010

From Lunar & Planetary Science Conference Album -
Marius Hills is the largest volcanic dome field on the Moon. The region is an area of high interest because it contains approximately half of the Moon's known volcanic domes. These domes range from 200-500 meters in height. In comparison, the Hawaiian volcano Mauna Loa, which is the largest shield volcano on Earth, is 17,170 meters high. This LOLA image covers the area of the Moon from 9.5 - 17N°, and 303.5 - 311°E [NASA/GSFC].

Amateurs decipher lunar color as seen by LROC


Quick sketch of the contact, separating an earlier inundation that had more completely filled the Serenitatis basin with a newer melt that did not reach the basin's outer edge. This was a test of aesthetics, not spectrometry. No attempt at answering the source of Serenitatis or its fills is implied. [Virtual Moon Atlas v.4].

Cleopas Blount
Lunar Pioneer


Is it possible for rank amateurs to capture the true color of the lunar surface coded into LRO's Wide Angle Camera seven-wavelength color observations?

We've been engaging in some non-destructive testing of this notion, using tools at hand (i.e., free software) to produce monochrome, single-wavelength scenes as something very close to the actual "color" the respective wavelength represents. The result has been encouraging, wetting the appetite for the work more competent investigators will accomplish in coming years.

Our first tests of the heart of Reiner Gamma and the Sulpicius Gallus vent look right, though so much subjectivity, plain old guess work, has been a part of working this way.

For our first large area, we chose a well-known contact, where an obviously darker color of darker basalt that seems (from a great distance) mostly continuous from Tranquillitatis into Serenitatis basin, where it forms an annulus around a much lighter, younger interior plain covering the entire central area of Serenitatis basin. Through filters, photographers on Earth have photographed this clear color difference, visible through good eyes and a modest telescope (at the right illumination).

Coincidentally, LROC principal investigator Mark Robinson used a larger field of view which also included this much smaller area in his discussion of The Color of the Moon, September 10, 2010. There are photographs of excellent, professional quality posted at that link, showing the contact area very clearly. Dr. Robinson also offers information about the causes of these distinct lunar colors.

LROC Wide Angle Camera observations of this contact, just inside the southeastern edge of Serenitatis basin, at proper times in four successive orbital passes of LRO. as the Moon rotated underneath. These were then stitched into a three respective mosaics, each representing one of three visible wavebands among the seven imaged during each session. Then we tinted the individual monochromes with something close to the color of the respective wavelengths as seen by the human eye.

Using the logic of the color wheel, we then lightly transparentified and tested various overlays in differing combinations in the hope of seeing something like we would had we been riding on LRO at those times.

Fortunately, we discovered an orbital HDTV color still of precisely the same area imaged by Japan's Kaguya in our year-old archives. We've posted a thumbnail link to the full image for comparison.


Our second color test began with a monochrome photograph of one of three of seven wavebands collected nearly simultaneously in four successive Lunar Reconnaissance Orbiter Camera (LROC) Wide Angle Camera (WAC) observations. Above, a monochrome image of light at a wavelength of 566nm was tented with a close approximation of what the human eye would see if also tuned to that narrow band [NASA/GSFC/Arizona State University].


And another of very nearly the same geography (differences were mostly squeezed out during their recomposition), of the 604nm waveband was similarly tented with the visible "color" equivalent (LROC WAC observations took place during LRO orbits 4164-4167, May 22, 2010 [NASA/GSFC/Arizona State University].


And yet again, from very near to the longest wavelengths visible to the human eye, the same area as "seen" in a third (643nm) waveband. The most obvious feature seen in all these example images of the "confluence" of Tranquillitatis and Serenitatis is Promontorium Archerusia (16.70°N, 22.00°E) at lower left [NASA/GSFC/Arizona State University].


The result... is... interesting, not surprisingly confirming what's well-known. This false color combination of the three visible wavelengths are, however, not very far from true.


For example, here is a "true-color" HDTV still from Japan's Kaguya in 2008, showing the well-known contact inside the southeastern edge of Serenitatis basin. Because of the proclivities of color monitors, we recommend the reader click HERE (or on the image thumbnail above) to truly compare the test result with the full-sized digital image of the very same area taken from orbit. (The thumbnail does not do the full picture justice [JAXA/NHK/SELENE].


Closer to the Moon, late in its mission, Japan's SELENE-1 (Kaguya) captured some spectacular shots of far side highlands and lowlands under relatively high-illumination. The result cast a yellow tint on the reproductions, most notably those of the interior of South Pole-Aitken basin imaged from less than 45 kilometers, during Kaguya's long, low terminal spiral into the Gill crater region [JAXA/NHK/SELENE].

The sandy greens, and especially the "reds," derived in our own amateurish compositions from LROC WAC monochromes from three visible wavebands should rightly be disputed.

They don't meet our expectations either, even when compared to true-color HDTV images from Japan's lunar orbiter SELENE-1 (Kaguya) in 2008 and 2009. Those who have been in lunar orbit described those spectacular videos and stills as being similar to their own experiences.

Nevertheless, careful consideration has to be given to illumination, surface composition, the angle of incidence, altitude. etc., because the color of the Moon appears quite different here on Earth than from orbit, or on the surface, and different still from "up-sun, down-sun" or under high-noon Sun. The bright anorthosites of the highlands looks very different than the plains, as everyone knows, so the "red" in Reiner Gamma's stain, posted earlier, may represent a higher ferrous oxide presense in all its manifestations, but it's more likely representative of poor tuning on our part.

What is the color of the Moon? There's no precise answer, only a wide range of possibilities. One things is certain, however. The Moon is not Black and White.

Monday, October 18, 2010

New findings from LCROSS/LRO, October 21


The choice of the permanently shadowed region (PSR) at Cabeus (largest white line-encircled district above) for the LCROSS impact was probably a wise one. The on-going LRO instrument survey of the Moon continues to show the area as, by more than double, the location of the largest estimated water signature of any large location (4% by weight), though it may not be the wettest point source. Intriguingly, much of the water signified by neutron suppression is found outside PSRs. Further, some craters within PSRs elsewhere show little to no such signs of water by neutron suppression while neighboring similar areas that do. Along with the discovery of a daily hydrological cycle on the Moon, at low latitudes, and previously undetected water in Apollo and Luna samples, newly learned details about the nature of lunar hydrogen pose at least as many, or more, questions than they have yet been answered [NASA/ARC/Anton Sanin/LEND].

NASA will host a media teleconference at 2 p.m. EDT (1800 UT), Thursday, October 21 to discuss additional findings from NASA's Lunar CRater Observation and Sensing Satellite (LCROSS) and the Lunar Reconnaissance Orbiter (LRO) missions. The results will be featured in six papers published in the October 22 issue of the journal Science. (The journal's embargo on these results will be lifted at the start of the press conference.

The briefing will focus on the data from LRO's Diviner Lunar Radiometer Experiment which measures surface and subsurface temperatures from orbit, the Lyman Alpha Mapping Project (LAMP) presently mapping the entire lunar surface in the far ultraviolet and the Lunar Exploration Neutron Detector (LEND) creating high-resolution maps of hydrogen distribution and gathering information about the neutron component of the lunar radiation environment.

Scheduled panelists include Michael Wargo, chief lunar scientist, Exploration Systems Mission Directorate (ESMD), NASA HQ in Washington, DC; Anthony Colaprete, LCROSS project scientist and principal investigator, NASA's Ames Research Center in, Moffett Field, CA; David Paige, Diviner instrument principal investigator, UCLA; Igor Mitrofanov, Lunar Exploration Neutron Detector (LEND) principal investigator, Institute for Space Research, Moscow; Peter Schultz, professor of geological sciences, Brown University, Providence, RI, and LCROSS science team member; Paul Hayne, graduate student at UCLA and Diviner team member, Randy Gladstone, Lyman--Alpha Mapping Project deputy principal investigator, Southwest Research Institute (SWRI), San Antonio, TX and Richard Vondrak, LRO project scientist, NASA's Goddard Space Flight Center in Greenbelt, Maryland.

To participate in the teleconference reporters should contact Michael Braukus at michael.j.braukus@nasa.gov or at (202) 358-1979. Requests must include media affiliation and telephone number. Supporting information, available at the start of the teleconference, will be posted HERE.

Audio of the teleconference will be streamed live at: http://www.nasa.gov/newsaudio

A different look at 'Target Rainbow'


HDTV still from Japan's lunar orbiter Kaguya (SELENE-1) shows the full semi-circle of Sinus Iridum, the "Bay of Rainbows," and the contact between basalt melt that flooded the ancient crater and Imbrium basin. Yet another look at one of the high-priority areas of interest targeted by China's Lunar Exploration Program (CLEP) as a possible landing site in 2013. China's second lunar orbiter Chang'E-2 arrived in lunar orbit October 6, 2010. Click HERE for full 1920x1080 view [JAXA/NHK/SELENE].

Recent Related Posts:
Sinus Iridum - Next Destination?
Mark Robinson, Saturday, October 16, 2010

Chang'E-2 arrives in lunar orbit
Joel Raupe, Saturday, October 9, 2010

Sunday, October 17, 2010

Apollo Ops, as 'fashion statement'


The Apollo Progam module tie comes from Etsy user toybreaker. "We've come upon an incredible repository of vintage declassified documents including NASA's Command Module Main Control Panel, from the Apollo Operations Handbook Block II, 1969. One of our most detailed prints yet..."

Saturday, October 16, 2010

Sinus Iridum - Next Destination?


LROC Wide Angle Camera (WAC) topography of Sinus Iridum. Blue shows the lowest areas and red the highest. From Promontorium Heraclides to Promontorium Laplace is 235 kilometers across [NASA/GSFC/Arizona State University].

Mark Robinson
Principal Investigator
Lunar Reconnaissance Orbiter Camera
Arizona State University


Wow - five spacecraft launched to the Moon in three years! The latest is China's second lunar orbiter, Chang'e 2, which was launched 1 October 2010 and arrived at the Moon on 6 October. Chang'e 2 carries a higher resolution camera than Chang'e 1 that may help Chinese scientists scout out the proposed landing site for their upcoming lander/rover, Chang'e 3. Currently the Chinese lander is slated to land in Sinus Iridum (Bay of Rainbows) sometime before 2013. Why Sinus Iridum? The WAC topographic map shows the area to be very flat and nearly featureless. However as the LROC Narrow Angle Camera (NAC) keeps showing us, there are no featureless spots on the Moon - everywhere on the Moon is fascinating!


Boulders resting on the top of a wrinkle ridge in the middle of Sinus Iridum. Where did they come from? (LROC Narrow Angle Camera observation M124749832R) [NASA/GSFC/Arizona State University].

Sinus Iridum is a mare-filled impact crater that superposes the Imbrium basin. It is far from any Apollo landing sites, with the closest (Apollo 15) being more than 1000 km distant. Scientists would love to have a look at the chemistry of these basalts - how much do they differ from the Apollo 15 basalts which are from the other side of Imbrium? Wrinkle ridges cross the mare, and in places families of boulders are perched on the ridges. Are the boulders weathering out of the ridge? Many small irregular shaped craters dots Sinus Iridum, how were they formed? The LROC team will post selected NACs over the coming weeks, you can join the effort to explore this future landing site now!

Explore the whole of Sinus Iridum with a WAC BW mosaic!

The topographic color was produced as a by-product of stereo analysis of the WAC global dataset. Producing the global Digital Elevation Model (DEM) is a big job being led by LROC team members at the German Aerospace Center (DLR; English version) in Berlin. This winter a global 100 meter DEM will be released.

Friday, October 15, 2010

Reiner Gamma in color

From LRO Wide Angle Camera
Actually a combination of three wavebands (566, 604, 643nm) of seven swept up by the LROC Wide Angle Camera (WAC) observation M122597745CE during LRO orbit 3201, March 7, 2010. The natural color here is less luminous, though the red cast when compared to similar mare basalts appears to be an actual aspect outside the anomalous low optical maturity of the enormous swirl albedo here, stretching over 500 km across the floor of Oceanus Procellarum [NASA/GSFC/Arizona State University].


Reiner Gamma and it's traces into the heart of the Marius Hills volcanic feature, southeastward to the western edges of Oceanus Procellarum [NASA/GSFC/Arizona State University].

Wednesday, October 13, 2010

LROC: Slipher Crater: Fractured Moon in 3-D


Over time, the surface of the Moon fractures and buckles as it cools and shrinks, resulting in spectacular landforms. Stereo images provided by the LROC Narrow Angle Camera (NAC) allow a detailed look at these amazing features; view is to the east, foreground to background distance is ~3 km [NASA/GSFC/Arizona State University].

Mark Robinson
Principal Investigator
Lunar Reconnaissance Orbiter Camera
Arizona State University


The wall of Slipher crater is deformed by one of many scarps found in the lunar highlands, which are thought to form as the Moon shrinks due to magma deep inside the Moon cooling and "freezing" to solid rock. Unlike water-ice (ice floats), most rocks are denser than their magma (you can think of water as magma and ice as rock), meaning rocks occupy less volume than their parent melt.

As the interior of the Moon shrinks due to this volume change, the outer crust of the Moon wrinkles and folds, and the linear, rounded shape of the lobate scarp occurs as the crust breaks and one segment is thrust on top of another.


LROC Wide Angle Camera (WAC) context mosaic of ~70 km Slipher crater (49.5°N, 160.1°E) - north is up, arrow indicates location of scarp seen in Narrow Angle Camera Featured Image [NASA/GSFC/Arizona State University].


A broader view of the Slipher lobate scarp created by rotating the stereo-based topography with the image draped on top. The scarp is about 20 meters high, foreground to background distance is ~3.5km. View towards the east [NASA/GSFC/Arizona State University].

LROC NAC stereo observations allow scientists to create high resolution topographic maps, sometimes known as digital elevation models (DEMs); details on LROC stereo processing can be found HERE. A (DEM) is a simple raster (two dimensional array) file where each pixel represents the local elevation relative to a reference point. For these lunar data the reference is a sphere with a diameter of 1737.4 km - the average radius of the Moon. To visualize the DEM, software can be used to create views from any perspective, as in the images above where you appear to be hovering above the surface, looking at the terrain from the side.


For a 3-D effect, put on your anaglyph glasses (red on the left)! In this view, south is to the top of the image, width is 1.7 km [NASA/GSFC/Arizona State University].

Color shaded relief is another common product used to convey topography from a DEM. In the image below, a shaded relief map was generated from the DEM and then a color overlay was added that depicts the elevation. In this small area green values are the lowest and red areas the highest. DEMs are one of the most important datasets scientists use to analyze terrain and obtain quantitative measurements of height and slope.


Shaded relief map of a small portion of Slipher crater, image width is 2.0 km [NASA/GSFC/Arizona State University].

Additionally, high-resolution topography gives engineers the means to decide the safest place to land a spacecraft, robotic or piloted. The new LROC topographic maps will enable future mission planners to select safe and feasible routes for rovers and explorers. What questions are left regarding these fascinating scarps? How would astronauts investigate their origin? Right now LROC is collecting high resolution images from all over the Moon. As the data accumulates, scientists can explore spatial relations between the scarps themselves and the their surroundings. For example, you can see Slipher crater has a somewhat square form (similar to Meteor Crater, AZ) indicating pre-existing fractures in the crust. We do know that the Slipher scarp formed as the crust was compressed - what role did the older fractures have in the location and size of the scarp? What triggered the compression event? Did the scarp form in one instant or over a series of events? Detailed examination of the fault surfaces, combined with a long term seismic characterization, would reveal the complex history of the Slipher scarp and the highland scarps in general. So there is much to do in terms of unraveling the thermal and seismic history of the Moon!

What a fantastic destination for explorers - imagine seeing the Slipher scarp appear while descending to the Moon's surface! In the meantime, 3-D anaglyphs help you see the landscape as it would appear as your spacecraft comes close to the surface.

Explore the full resolution NAC orthimage at 0.50 meter/pixel and the color shaded relief image at 2.0 meter/pixel!

For more information about the use of LROC NAC images in DEM generation and topography studies, be sure to check out the: Topography of ancient lunar basins and Orientale basin.