Showing posts with label lunar impactor. Show all posts

Tuesday, February 4, 2014

Ranger: America's first successful lunar program

RANGER Lunar Probe (replica).
Replica of Ranger Block III (Rangers 6-9) spacecraft on display at the National Air and Space Museum. The replica spacecraft made of parts from Ranger test vehicles and is about 3 meters tall and 4.5 meters across [Smithsonian Institute].
Andrew J. LaPage
The Space Review

With the successful landing of the Chinese Chang’e-3 lunar spacecraft on December 14, 2013, and the subsequent deployment of its Yutu rover, the Western press has been filled with claims of how the Chinese are catching up with the American space program. Usually overlooked by these writers is the fact that these Chinese successes would have been almost impossible without the pioneering efforts (and many painful failures) of the American and Soviet lunar programs a half a century earlier.

NASA’s earliest Pioneer lunar probes, a program started by the military and inherited by the agency after it was founded in October 1958, were plagued by a series of launch vehicle failures (see “The Pioneer lunar orbiters: a forgotten failure”, The Space Review, December 13, 2010). Out of all of NASA’s initial attempts to launch probes towards the Moon, only the tiny six-kilogram (13-pound) Pioneer 4 built by the Jet Propulsion Laboratory (JPL) and launched on March 3, 1959, by a team at the Army Ballistic Missile Agency (ABMA) headed by Wernher von Braun (which would become the basis of NASA’s Marshall Space Flight Center) managed to escape Earth’s gravitational grasp to make a very distant flyby of the Moon.

The initial flights of NASA’s first in-house lunar program, Ranger, which was built and managed by JPL, fared little better than the Pioneers. The two flights of the Block I Ranger, which were designed to test the innovative Ranger design in extended Earth orbit, were stranded in short-lived low Earth orbits due to failures of the upper stage of the Atlas-Agena B launch vehicle (see “Ranger: Voyage to the Moon and beyond”, The Space Review, August 22, 2011). The three Block II Ranger flights, which were designed to hard-land a small probe on the lunar surface, fared little better. While most of the launch vehicle issues were resolved, fatal malfunctions of key spacecraft components resulted in complete failure of all of these missions (see “The Difficult Road to the Moon”, The Space Review, January 23, 2012).

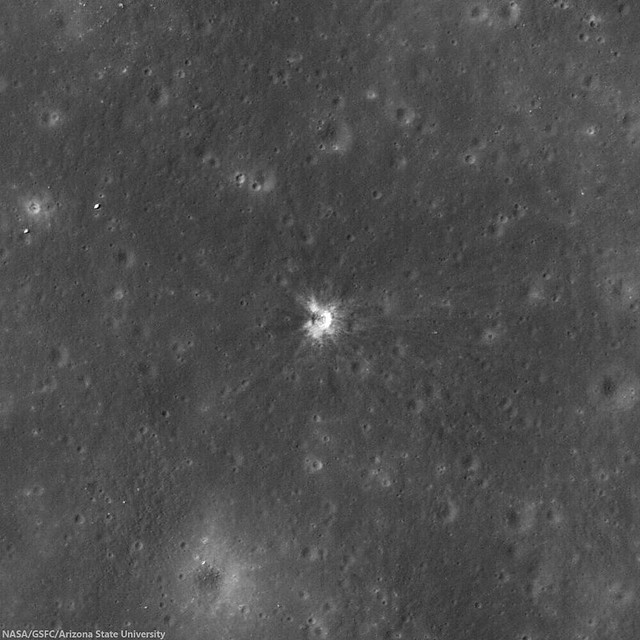
Impact site of Ranger 7, a 14 meter-wide crater near the center of Mare Cognitum (10.634°S, 20.677°W). 487 meter-wide field of view from LROC Narrow Angle Camera (NAC) observation M153014430L, LRO orbit 7693, February 22, 2011; 33.97° angle of incidence, resolution 49 centimeters per pixel from 42.69 km [NASA/GSFC/Arizona State University].
As 1962 was drawing to a close, the situation with the American Moon program looked bleak. The failure of the last Block II Ranger, Ranger 5 launched on October 16, 1962, was NASA’s sixth consecutive lunar mission failure in three years. Only 17 months after President John F. Kennedy committed the United States to landing a man on the Moon with Project Apollo, it was beginning to look as though the Americans would never make it. If NASA could not get a simple unmanned probe to the Moon in working order, how could they hope to pull off the much more complicated mission of a manned lunar landing?

Wednesday, August 22, 2012

LROC: Looking over a four-leaf clover..

Several shallow depressions, secondary craters, dot the surface of Mare Imbrium, in this case near a rocky ext Mons la Hire (near Euler and Lambert), and giving the impression of a four leaf clover. LROC Narrow Angle Camera (NAC) M190780929RE, spacecraft orbit 13158, May 4, 2012; resolution 1.5 meters and field of view 1500 meter across. View a larger cropped image HERE.  [NASA/GSFC/Arizona State University].
Drew Enns
LROC News System

These large, ~500 m diameter, depressions are characteristic of secondary impacts on the Moon. When a bolide (asteroid or comet) hits the surface of the Moon a crater forms at the impact site. To create a secondary crater material is ejected from the impact site at about a 45° angle. If the ejecta travels less than the escape velocity, it falls back down to the Moon. Since the escape velocity on the Moon (~2.4 km/s) is much lower than that at which bolides typically impact the Moon (10-20 km/s) secondary craters often have a distinctive appearance. These lower velocity impacts result in irregularly shaped craters. Sometimes secondaries land in clumps and create distinctive patterns, such as the "four leaf clover" whimsically identified in today's Featured Image.


Smaller scale context image shows the relationship of the out-cropping above with the larger Mons La Hires 30 km to the southeast.  Image width is 650 km, LROC WAC mosaic [NASA/GSFC/Arizona State University].
If the secondaries featured today were formed in another impact, which impact created them? The number of craters in our secondary group is fairly large, so the parent crater cannot be small. In the context image covering a slightly broader field of view below, other secondary chains (red arrows) appear to point to the southeast. Maybe zooming out further will reveal the mystery parent crater!

A quick look over the 605 kilometers from the southwestern tip of  the northwest Mons La Hire outcrop and the center of Copernicus, courtesy of the ILIADS application released by NASA/LMMP. The immediate and long-range legacy of the Copernicus event was lasting.
It looks like Copernicus is the parent crater! That makes sense. Copernicus fits our criteria. These secondary chains have been previously identified, but the fact that they were sourced from Copernicus crater hundreds of kilometers away is remarkable. The impact cratering process really is amazing.

Can you identify other secondary craters in the full LROC NAC frame, HERE?

Related Posts:

Monday, April 30, 2012

The discarded extension of the Ranger program

Site of the guided impact of Ranger 9, March 24, 1965 (12.82°S, 357.61°E). LROC Narrow Angle Camera (NAC) observation M170579736R, LRO orbit 10272, September 13, 2012; resolution 49.6 cm, angle of incidence 16.1° from 44.64 kilometers. There are images of the impact showing more relief but this most recently released view, under a high sun, balances detail with contrast exposing more detail of the wispy ejecta albedo [NASA/GSFC/Arizona State University].
David S. F. Portree
WIRED/Beyond Apollo

In the summer and fall of 1962, NASA Headquarters planned at least 18 missions in the Ranger series. Some would have imaged the moon’s surface to certify potential Apollo landing sites, while others would have had a more purely scientific intent. On December 13, 1963, however, the total shrank to nine, with science missions taking the brunt of the cuts. Ranger itself was partly to blame; all five Rangers flown up to that time had failed, undermining confidence in the program and building support for an early switch to Lunar Orbiter and Surveyor, Ranger’s intended successor programs.

The Jet Propulsion Laboratory (JPL) in Pasadena, California, built the Rangers on contract to NASA Headquarters. The probes left Earth atop Atlas rockets with Agena B upper stages (image at top of post). Rangers 1 and 2, Block I spacecraft designed to test spacecraft systems and return data on conditions in space up to 1.1 million kilometers from Earth, weighed a little over 300 kilograms each. Both reached low-Earth orbit, where they became stranded by Agena B failures. Ranger 1 lifted off on August 23, 1961, and burned up in the atmosphere a week later. NASA launched Ranger 2 on November 18, 1961; it burned up just two days later.

Ranger - Block III - spacecraft diagram [NASA].
Rangers 3 through 5 were Block II spacecraft designed to image the moon during approach and then rough-land a balsa wood-cushioned instrument capsule bearing a battery-powered seismometer. Rangers 3 and 4 weighed about 330 kilograms; Ranger 5 was somewhat heavier (342 kilograms). Ranger 3, launched on January 26, 1962, missed the moon by 36,800 kilometers on January 28 and entered orbit around the Sun. Ranger 4, launched April 23, 1962, lost power 10 hours after launch after its twin tapering solar arrays failed to open. It became the first Ranger to touch the moon, crashing inert on the lunar Farside (the hemisphere turned always away from Earth) on April 26. Ranger 5 also suffered a power failure shortly after launch on October 18, 1962; it passed about 725 kilometers over the moon on October 21 and entered solar orbit. After the Ranger 5 failure, NASA tasked the RCA Astro Division with reworking the spacecraft’s electronics.

Block III Rangers, the next in the series, were meant to radio to Earth images of the lunar surface as they plummeted toward destructive impact. All weighed about 365 kilograms. Ranger 6, the first of the Block III Rangers, left Earth on January 30, 1964. It transmitted signals until it struck the moon’s Mare Tranquillitatis – the Sea of Tranquility – within a few kilometers of its target on February 2, 1964, but its six cameras never switched on. The failure led to an independent review board, new program management, a Congressional investigation, and calls for the program’s cancellation.

Read the full article HERE.

Friday, July 22, 2011

LROC: Crash or coincidence?

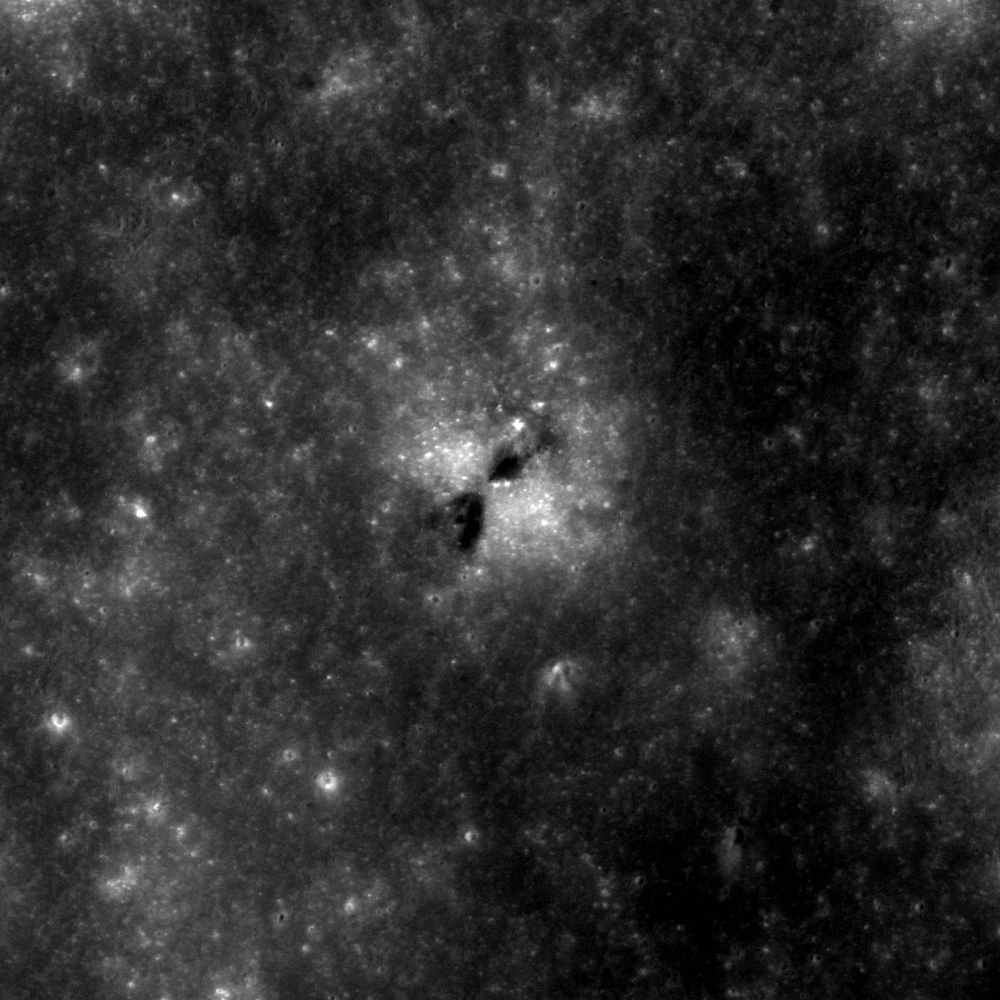
An odd-looking impact feature raises an intriguing, Apollo-era trivia question (3.02°S, 119.15°E). LROC Narrow Angle Camera (NAC) observation M141485413, LRO orbit 5984, October 12, 2010; solar illumination incidence 12° and from the east (north is up); image field of view is roughly 240 meters wide [NASA/GSFC/Arizona State University].

James Ashley
LROC News System

What caused this peculiar-looking impact? The "butterfly"-shaped ejecta pattern is diagnostic of a low-angle collision (see another example here). The dark/light contrasting tones are indicative of compositional or maturity differences among the target materials (see another example here). This much we understand. But was it created by a chunk of space debris or from the crash landing of a space probe? The LROC NAC resolution is so high that small features from Apollo-era landed or crashed spacecraft are often visible. Today's Featured Image is a fitting topic for the 42nd anniversary of the Apollo 11 landing, which landed safely in Mare Tranquilitatis on July 20, 1969.

Lunar Orbiter 2 was an unmanned imaging spacecraft used in November and early December 1966 to aid with Apollo and Surveyor landing site selection. The spacecraft became famous in 1967 with the public release of an oblique image of Copernicus crater (one of only four obliques collected), which was hailed as the "Picture of the Century" by the news media of the day. According to the 2007 International Atlas of Lunar Exploration, the Lunar Orbiter 2 spacecraft was commanded to crash into the lunar farside surface on October 11, 1967. The coordinates of the Lunar Orbiter 2 impact are given as 119.1° east longitude and 3.0° north latitude, which match those of the feature in the NAC image (measured at 119.149° east longitude, and 3.020° north latitude). However, the published Lunar Orbiter 2 numbers are given as a rough estimate because the impact occurred on the farside of the Moon, out of direct radio contact. So the match with the NAC coordinates could be a coincidence. The impact appears much too large (~85 m in diameter) to be the result of an impact from a spacecraft only a few meters tall, but with a solar incidence angle of only 12 degrees, it is difficult to see the crater rim and find out the true diameter. Perhaps the ejecta pattern extends far beyond the immediate impact. The truth is that we are not sure what caused this impact feature. We are currently re-targeting the area under a higher incidence angle to help with crater rim measurements. Stay tuned!

What additional clues would you look for to satisfy this mystery? The feature is very asymmetrical. Would it help to know the orientation of Lunar Orbiter 2's final orbit? Why? Here is a good discussion for the classroom!

See if you can find the tiny feature in the full NAC image here, and look to the following Featured Image posts for additional spacecraft recovered through NAC targeting.

Apollo 11 landing site
Apollo 16 landing site

LROC: The lavish lobes of Necho R


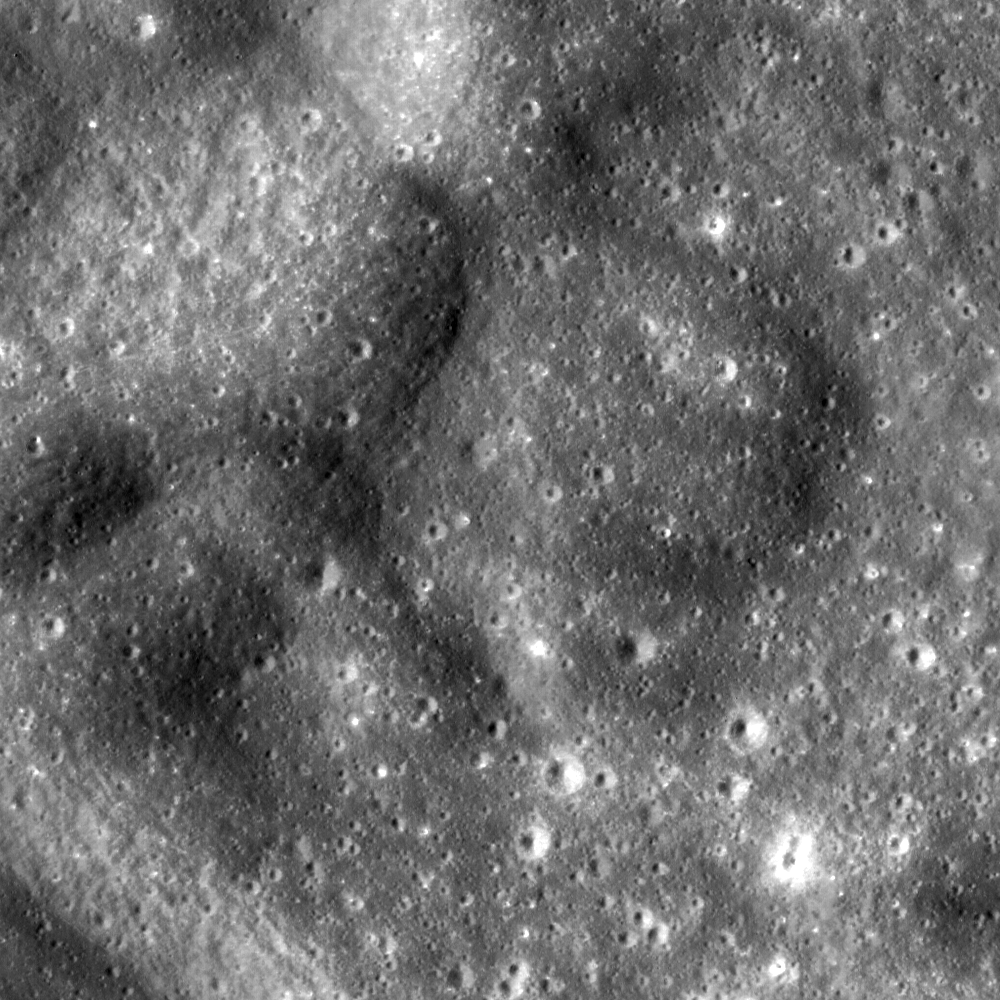
What geologic process created these mounds (5.72°S, 122.09°E)? LROC Narrow Angle Camera (NAC) observation M106074338R, LRO orbit 779, August 28, 2009; Solar illumination incidence angle 35°, from the west (north is up), field of view roughly 600 meters. View the full-sized LROC Featured Image HERE [NASA/GSFC/Arizona State University].

James Ashley
LROC News System

As space enthusiasts and students of the Solar System, we all know that the tremendous energies unleashed by a hypervelocity impact vaporize much of the impactor, fracture the target subsurface, and send cubic kilometers of pulverized and melted ejecta sailing over the horizon. When conditions are right, however, some impacts also produce strange and counter-intuitive phenomena. Dry ejecta can sometimes behave like a fluid and travel as a ground-hugging debris flow great distances from the impact site. The exact physics of this ground-hugging flow behavior is not well understood, but several theories exist. The most popular of these employs the idea of acoustic energy waves keeping particles in motion -- bouncing off each other at just the right frequencies to keep everything suspended much longer than one might anticipate. With friction reduced by this resonant internal energy, the flow can move great distances before finally losing momentum to become part of a distal ejecta deposit.

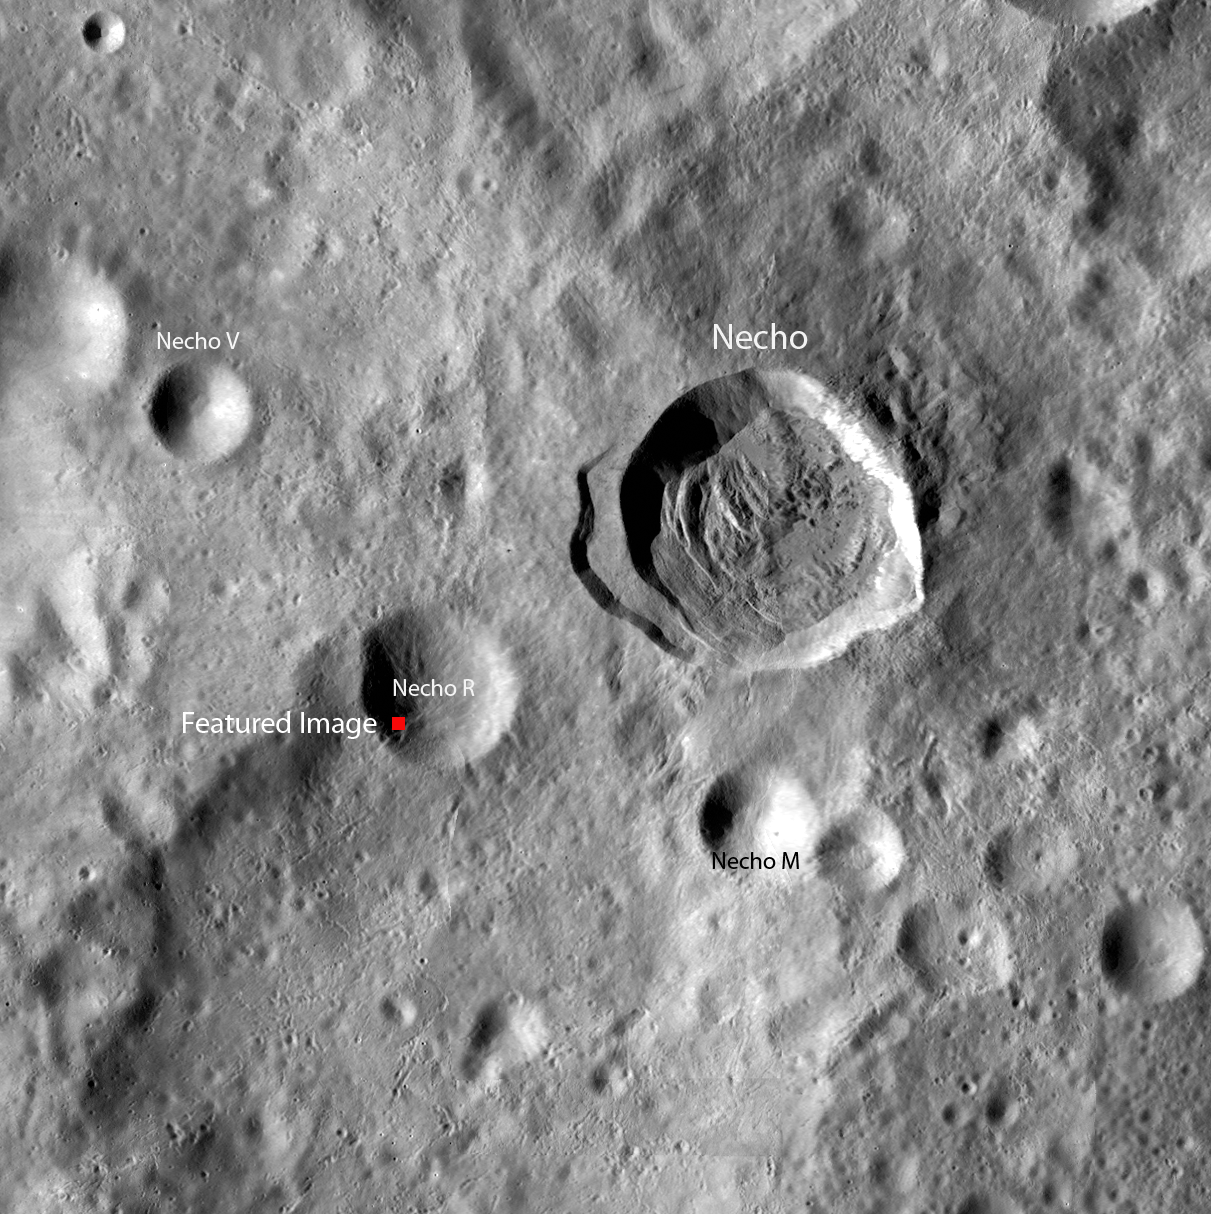
On Earth, this type of debris flow is known as a sturzstrom, most often associated with avalanches. Evidence for similar behavior is observed on the Moon in the vicinity of relatively recent craters. The odd mounds shown here were caused by the Necho impact (see context image below), and are the result of such flows bunching up and overriding each other as they slowed and came to their final resting place in nearby Necho R crater upon reaching its floor and steep southwestern wall; hence the technical term "deceleration lobes" for these landforms.


A portion of a LROC Wide Angle Camera (WAC) monochrome (643 nm) mosaic swept during three consecutive opportunities (LRO orbits 2676-2678, January 25, 2010) showing the Necho crater region of the farside lunar highlands. See the original LROC WAC context image HERE [NASA/GSFC/Arizona State University].


A virtual view of the same LROC WAC mosaic as an overlay upon the lunar digital elevation model available in later versions of Google Earth. Both Necho and Necho R are situated on the north wall of the much older and larger Necho P, a fact which may somewhat explain the unusual slumping seen in Necho. The scene within the LROC Featured Image released July 21, 2011 is indicated by the small arrow [NASA/GSFC/Arizona State University/JAXA/Google].

Another example of deceleration lobes can be found in the King crater region to the north of Necho crater. Examine the full NAC image for an even more dramatic display of these features.

Tuesday, October 26, 2010

LRO-Diviner Lunar Radiometer observations of cold traps in the Moon’s south polar region

David A. Paige,1* Matthew A. Siegler,1 Jo Ann Zhang,1 Paul O. Hayne,1 Emily J. Foote,1 Kristen A. Bennett,1 Ashwin R. Vasavada,2 Benjamin T. Greenhagen,2 John T. Schofield,2 Daniel J. McCleese,2 Marc C. Foote,2 Eric DeJong,2 Bruce G. Bills,2 Wayne Hartford,2 Bruce C. Murray,3 Carlton C. Allen,4 Kelly Snook,5 Laurence A. Soderblom,6 Simon Calcutt,7 Fredric W. Taylor,7 Neil E. Bowles,7 Joshua L. Bandfield,8 Richard Elphic,9 Rebecca Ghent,10 Timothy D. Glotch,11 Michael B. Wyatt,12 Paul G. Lucey13
22 OCTOBER 2010 VOL 330 SCIENCE

Diviner Lunar Radiometer Experiment surface-temperature maps reveal the existence of widespread surface and near-surface cryogenic regions that extend beyond the boundaries of persistent shadow. The Lunar Crater Observation and Sensing Satellite (LCROSS) struck one of the coldest of these regions, where subsurface temperatures are estimated to be 38 kelvin. Large areas of the lunar polar regions are currently cold enough to cold-trap water ice as well as a range of both more volatile and less volatile species. The diverse mixture of water and high-volatility compounds detected in the LCROSS ejecta plume is strong evidence for the impact delivery and cold-trapping of volatiles derived from primitive outer solar system bodies.

The Moon’s polar regions are notable because of their potential to cryogenically trap water ice and other volatile species (1). The Lunar Reconnaissance Orbiter (2) (LRO) Diviner Lunar Radiometer Experiment has been mapping the infrared emission from the Moon since July 2009 using seven spectral channels that span a wavelength range from7.55 to 400 mmat a spatial resolution of ~200 m (3).

Thermal maps of the south polar region (Fig. 1, A and B) were obtained during the LRO monthly mapping cycle just before the Lunar Crater Observation and Sensing Satellite (LCROSS) impact (4), as the Moon approached southern summer solstice (5). The mapped quantity is the bolometric brightness temperature, which is the wavelength-integrated radiance in all seven Diviner channels expressed as the temperature of an equivalent blackbody (6). For quantifying the overall heat balance of the surface and comparing with available models, the bolometric brightness temperature is the most fundamental and interpretable measurable quantity.

For the simplest case in which Diviner’s surface footprint is filled with a blackbody of uniform surface temperature, the bolometric brightness temperature will be equal to the temperature of the surface.


Figure 1. Maps of measured and model-calculated surface and subsurface temperatures in the lunar south polar region. The outer circle on all maps is 80° south latitude. Observations were acquired between 6 September and 3 October 2009 as the Moon approached southern summer solstice. (A) Diviner-measured daytime bolometric brightness temperatures acquired between 11.4 and 13.6 hours local time (5). (B) Diviner-measured nighttime bolometric brightness temperatures acquired between 21.41 and 1.66 hours local time (5). (C) Model-calculated annual average near-surface temperatures and the location of the LCROSS impact in Cabeus Crater. (D) Model-calculated depths at which water ice would be lost to sublimation at a rate of less than 1 kg/m−2 per billion years. - The white regions define the locations where water ice can currently be cold trapped on the surface, the colored regions define the upper surface of the lunar ice permafrost boundary and the gray regions define locations where subsurface temperatures are too warm to permit the cold-trapping of water ice within 1 m of the surface.

In the more general case, where Diviner’s surface footprint contains small-scale slopes, shadows, or rocks, the brightness temperatures in Diviner’s individual infrared channels may vary with wavelength depending on the distribution of sub–footprint-scale temperatures, spectral emissivities, and photometric properties. In this case, the bolometric brightness temperature cannot be interpreted in terms of a unique surface temperature. However, within cold regions that are not in direct sunlight, simultaneously acquired brightness temperatures in Diviner channels 7 (25 to 41 mm), 8 (50 to 100 mm), and 9 (100 to 400 mm) are in good agreement (6), which is consistent with uniformly high spectral emissivity across this wavelength range and relatively uniform temperatures within each Diviner footprint (fig. S1, A and B). This interpretation is supported by the results of an analysis of data acquired in each of the Diviner infrared channels at the LCROSS impact site in Cabeus Crater (7). For unilluminated regions, we use Diviner bolometric brightness temperatures as reasonably accurate proxies for the temperature of the surface.

The thermal maps show that the coldest regions are located on the floors of larger impact craters that receive no direct sunlight (Fig. 1,A and B). For these regions, previous modeling studies have shown that the main heat source is emitted infrared radiation from distant interior sunlit crater walls (8–11). Topographic relief within cold crater floor regions can provide additional radiation shielding, resulting in intensely cold localized regions with measured mid-day bolometric brightness temperatures as low as 29 K. Heat flow fromthe lunar interior may contribute to the overall heat balance of these coldest surfaces, but is not dominant compared to heating from scattered solar and infrared radiation during this season (6). Diviner’s summer solstice observations represent a valuable snapshot of the south polar region surface temperatures that can be extended in depth and in time with models. We have developed a thermal model that realistically accounts for the effects of large-scale topographic relief on direct and indirect solar and infrared radiation on the heat balance of the lunar surface (6). The model uses a ~500-m-scale triangular mesh based on south polar topography derived from the Kaguya LALT laser altimeter (12) and a spatially uniform set of thermal and reflectance parameters that are generally consistent with those derived from previous studies (6). The excellent overall agreement between maps (fig. S3, A and B) and histograms (Fig. 2A) of the observed and calculated bolometric temperatures demonstrate the general validity of our modeling approach. The only notable discrepancy occurs for daytime temperatures in the shadowed portions of craters that have measured bolometric temperatures in the range of 60 to 120 K, where the model underestimates temperatures by roughly 15 K (fig. S4, A and B). This may be largely due to directionally anisotropic infrared emission from rough sunlit crater walls, which is not accounted for in the present model (6). Given the better agreement between the model and the Diviner nighttime data, we estimate that the net effect on model-calculated annual average temperatures at 2-cm depth (Figs. 1C and 2B) is less than 7 K in the warmest craters and close to zero in the coldest craters. For the limiting case of zero heat flow from the lunar interior, the temperatures at greater depths would be close to this near-surface average temperature (11). However, with nonzero heat flow, average temperatures will increase with depth at a rate proportional to the heat flow rate and inversely proportional to the thermal conductivity. Using parameters derived from the heat flow experiments at the Apollo 15 and 17 landing sites (13), we estimate that LCROSS impact site temperatures at 2-m depth should be <6 K higher than annual average surface temperatures (fig. S5). Although the Diviner bolometric temperatures presented here and cooling curves at the LCROSS impact site are generally consistent with the presence of unconsolidated regolith near the surface (7, 14), the thermophysical properties of the Moon’s cryogenic regolith are not currently well constrained and could differ substantially from those in warmer regions (15), particularly at depth.


Figure 2. (A) Normalized histograms of measured daytime and nighttime bolometric brightness temperatures for the maps shown in Fig. 1, A and B, with comparisons to model-calculated surface temperatures at the same locations and times as those of the Diviner observations (fig. S3, A and B). (B) Histograms of model-calculated annual average temperatures at 2-cm depth for the maps shown in Fig. 1C and fig. S7, A to D, and at the LCROSS impact site for selected values of qmax, the mean maximum angle between the Moon’s spin axis and the normal to the ecliptic plane. qmax =1.54° for present-day conditions. (C) The recent evolution of qmax as a function of the Earth-Moon distance (29). (D) The volatility temperatures of a range of potential cold-trapped volatile compounds (21, 22) View higher-resolution Fig. 2 HERE.

We expect that the Moon’s cryogenic regions extend to depths of at least tens of meters below the surface, but estimating the volumetric extent of the Moon’s cryogenic regions purely from surface-temperature observations is highly uncertain.

Thermal model results can be used to estimate the stability of water ice deposits to loss by sublimation and diffusive migration through the lunar regolith (11, 16). Figure 1D shows a map of the depths at which water ice would be lost at a rate of less than 1 kg m−2 per billion years, which corresponds to a loss rate of 1 mm per billion years for a pure ice deposit (6). The results show that surface cold traps for water ice are surrounded by much more extensive “lunar permafrost” regions where water ice is stable in close proximity to the surface (17). These regions may receive direct solar radiation during periods when solar lighting conditions are most favorable, but maintain annual maximum temperatures at depth that are sufficiently cold to effectively prevent appreciable water loss due to sublimation. Because of their more hospitable surface thermal and illumination environments, lunar permafrost regions may be accessible locations for future in situ exploration of the Moon’s cold traps.

The overall picture painted by the present thermal state of the lunar south polar region is one of extreme cold. Temperatures in the Moon’s larger cold traps are closer to those expected for the poles of Pluto (18) than for Earth’s closest neighbor. At the cold temperatures that exist within most south polar craters, cold-trapped water molecules have negligible mobility (16), such that any water molecules deposited on the surface will not effectively diffuse below the surface where they can be protected from loss processes such as photolysis and sputtering (19). In cryogenic regions, burial of frozen volatiles by impact gardening is likely to be a much more effective process (20). However, warmer permafrost regions that currently exist at the margins of cold traps may represent somewhat more favorable environments for the downward diffusion of water molecules into the regolith, which should be aided by the daytime temperature gradient between warmer surface layers and colder subsurface layers below.

The distribution of temperatures in the lunar south polar region also places constraints on the thermal stability of non-water volatile species. Figure 2D shows the volatility temperatures (the temperatures at which pure solids exposed to vacuum at the surface would sublimate at a rate of 1 mm per billion years) for several volatile species (21, 22). Non-water subsurface volatiles will also be stable to sublimation at higher temperatures owing to the effects of diffusive migration through the regolith (6). Large areas of the lunar south polar region have the capability to cold-trap water and less volatile species such as mercury and sodium. All three of these volatile species were in the LCROSS ejecta plume (4, 14, 23).

Colder surface and subsurface areas in the south polar region also have the capability to cold-trap so-called super volatile species that have higher volatility than water, which include compounds such as sulfur dioxide, carbon dioxide, formaldehyde, ammonia, and methanol. The detection of a representative cross-section of these same supervolatile species in the LCROSS ejecta plume (4) represents strong evidence for the impact delivery of volatiles to the Moon by primitive outer solar system bodies, and the subsequent cold-trapping of these volatiles at the lunar poles (21, 22).

A question of interest regarding the lunar cold traps is whether they contain abundant deposits of nearly pure water ice such as those discovered by radar observations of impact craters at the poles of Mercury (24). Diviner-measured summer solstice daytime and nighttime surface bolometric brightness temperatures of 46.7 and 38.7 K in the region surrounding the LCROSS impact site, and model-calculated annual average temperatures at this site at a depth of 2 cm, are close to 38 K (6). As shown in Figs. 1, C and D, and 2B, the LCROSS impact site is a surface cold trap for water and is among the coldest locations in the south polar region. The Lunar Prospector Neutron Spectrometer (LPNS) results show that the average hydrogen abundance in the near-surface regolith at the south pole is ~70 parts per million (ppm) by weight, which translates to a water-equivalent average abundance of ~600 ppm by weight (25). Our results show that the surface and near-surface water ice cold traps comprise >66% of the surface area poleward of 85° south latitude (Fig. 1D). If we assume that all the hydrogen detected by LPNS was uniformly distributed within these cold traps, then the average water-equivalent abundance would be only ~1000 ppm by weight, which is substantially less than the 1 to 10% water content inferred at the LCROSS impact site (4). This suggests that the LCROSS site must be enriched in water compared to the average south polar near-surface cold trap, which is consistent with enhanced hydrogen abundances observed in the Cabeus region by orbital neutron spectrometers (26–28).

The spin pole of the Moon is currently in a tidally damped Cassini State 2 configuration in which the time-averaged maximum angle between theMoon’s spin axis and the normal to the ecliptic plane (qmax) has decreased to its present value of qmax = 1.54° as the Earth-Moon distance increased over time (Fig. 2C) (29). The absolute time scale for the tidal evolution of the Earth-Moon system is highly uncertain, but it is likely that the transition depicted in Fig. 2C has occurred over a period of more than 1 billion years (30). Model-calculated annual average near-surface temperatures qmax = 4°, 8°, 12°, and 16° (Fig. 2B and fig. S7, A to D) show that portions of the Moon’s south polar region cooled considerably as the Moon’s orbital radius increased, first creating cold traps capable of cold-trapping water, and then trapping compounds with higher volatility. The LCROSS impact site,which is located on the floor of the large Cabeus impact crater, is typical of the coldest areas on the Moon today. However, earlier in the Moon’s orbital history, when qmax was greater than ~10°, the floors of large-impact craters were not the coldest areas on the Moon because the walls of these relatively shallow craters did not shield their floors from direct solar radiation. Based on the results in Fig. 2B and fig. S7, A to D, the Moon’s earliest surviving near-surface cold traps are not located on the floors of large-impact craters, but rather on the floors of intermediate-sized craters, which thus may have had longer opportunities to accumulate water ice.

1Department of Earth and Space Sciences, University of California, Los Angeles, 595 Charles E. Young Drive East, Los Angeles, CA 90095, USA. 2Jet Propulsion Laboratory, California Institute of Technology, Pasadena, CA 91109, USA. 3California Institute of Technology, Pasadena, CA 90025, USA. 4NASA Johnson Space Center, Houston, TX 77058, USA. 5NASA Goddard Space Flight Center, Greenbelt, MD 20771, USA. 6U.S. Geological Survey, Flagstaff, AZ 86001, USA. 7Oxford University, Oxford OX1 3PU, UK. 8University of Washington, Seattle, WA 98195, USA. 9NASA Ames Research Center, Moffett Field, CA 94035, USA. 10University of Toronto, Toronto, ON M5S 3B1, Canada. 11State University of New York, Stony Brook, NY 11794, USA. 12Brown University, Providence, RI 02912, USA. 13University of Hawaii, Honolulu, HI 96822, USA.

*To whom correspondence should be addressed. E-mail: dap@moon.ucla.edu

References and Notes:

1. K. Watson, B. C. Murray, H. Brown, J. Geophys. Res. 66, 3033 (1961).
2. G. Chin et al., Space Sci. Rev. 129, 391 (2007).
3. D. A. Paige et al., Space Sci. Rev. 150, 125 (2010).
4. A. Colaprete et al., Science 330, 463 (2010).
5. The LRO orbit plane is inclined 90° to the lunar equator and is fixed in inertial space. LRO’s ground track rotates through 360° of longitude every sidereal month, allowing Diviner to make one daytime and one nighttime map every 27.3-day mapping cycle in pushbroom nadir mapping mode. Local time on the Moon can be expressed in hours by normalizing the angular distance between geographic longitude and the longitude of the solar point to a 24-hour day. We define daytime to be between 6 a.m. and 6 p.m. local time, and nighttime to be between 6 p.m. and 6 a.m. local time. Because the plane of the LRO orbit rotates relative to the lunar terminator by 360° every Earth year, the local times of Diviner’s observations drift by ~2 hours during each mapping cycle. The subsolar latitude on the Moon currently varies by approximately T1.54° over the course of the Moon’s 346-day draconic year, resulting in distinct seasonal temperature variations at the highest latitudes. The LRO launch date was chosen so that the LRO orbit plane was within 10° of the noon-midnight plane during LRO’s first southern summer solstice.
6. Supporting material is available on Science Online.
7. P. O. Hayne et al., Science 330, 477 (2010).
8. R. R. Hodges, Lunar Planet Sci. Conf. 11, 2463 (1980).
9. D. A. Paige, S. E. Wood, A. R. Vasavada, Science 258, 643 (1992).
10. A. P. Ingersoll et al., Icarus 100, 40 (1992).
11. A. R. Vasavada et al., Icarus 141, 179 (1999).
12. H. Araki et al., Science 323, 897 (2009).
13. M. G. Langseth et al., Proc. Lunar Sci. Conf. 7, 3143 (1976).
14. P. H. Schultz et al., Science 330, 468 (2010).
15. G. J. Taylor et al., Proceedings of Space Resources Roundtable VI. LPI Contribution No. 1224., Golden, CO, Abstract 6040 (Lunar and Planetary Institute, Houston, TX, 2004).
16. N. Schorghofer, G. J. Taylor, J. Geophys. Res. 112, E02010 (2007).
17. We estimate that the total area of surface water ice cold traps in the lunar south polar region shown in Fig. 1D is 13,087 km2, and the total area of near-surface water ice cold traps to a depth of 1 m is 119,507 km2.
18. C. J. Hansen, D. A. Paige, Icarus 120, 247 (1996).
19. T. H. Morgan, D. E. Shemansky, J. Geophys. Res. 96 (A2), 1351 (1991).
20. D. H. Crider, R. R. Vonrak, Adv. Space Res. 31, 2293 (2003).
21. J. A. Zhang, D. A. Paige, Geophys. Res. Lett. 36, L16203 (2009).
22. J. A. Zhang, D. A. Paige, Geophys. Res. Lett. 37, L03203 (2010).
23. G. R. Gladstone, Science 330, 472 (2010).
24. J. K. Harmon, Space Sci. Rev. 132, 307 (2007).
25. W. C. Feldman et al., J. Geophys. Res. 106 (E10), 23,231 (2001).
26. D. J. Lawrence et al., J. Geophys. Res. 111, E08001 (2006).
27. R. C. Elphic et al., Geophys. Res. Lett. 34, L13204 (2007).
28. I. Mitrofanov et al., Lunar Planet. Sci. Conf. 41, 2250 (2010).
29. W. R. Ward, Science 189, 377 (1975).
30. B. G. Bills, R. D. Ray, Geophys. Res. Lett. 26, 3045 (1999).
31. We thank the many people at the Jet Propulsion Laboratory and the Goddard Space Flight Center who contributed to the success of the Diviner instrument and the LRO project. We also thank the National Aeronautics and Space Administration for funding this investigation.

Supporting Online Material
www.sciencemag.org/cgi/content/full/330/6003/479/DC1
Methods Figs. S1 to S7
References 1 February 2010; accepted 12 August 2010 10.1126/science.1187726

Tuesday, August 17, 2010

LCROSS flight operations report


Impact Science Observations. The above diagram is a timeline of instrument data collection covering the five minutes prior to the impact of the LCROSS Shepherding Spacecraft. Label `A” shows downlink fully subscribed; `B” shows irregular ticks that reflect images dropped onboard because of downlink "over-subscription;" `C” shows the effect of a ground command sent to reduce camera sampling rates; `D” shows how a command sent to change an image exposure setting enabled imaging the Centaur crater in near-infrared (NIR).

The left image is the near-infrared spectrometers field-of-view just after the Centaur impact.

Paul D. Tompkins, et.al.
Stinger Ghaffarian Technologies
LCROSS Lead Flight Director, ARC


LCROSS (Lunar CRater Observation and Sensing Satellite) was conceived as a low-cost means of determining the nature of hydrogen detected at the polar regions of the moon. The mission presented several inherent challenges – planning for and achieving a precise impact at a lunar pole, guiding a Centaur upper stage far beyond its operational lifetime, co-launching as a secondary payload with the LRO spacecraft, and preparing for and operating such a mission under a highly constrained budget and short development cycle. Beyond these, the flight itself presented other hurdles in the path to success, including several anomalies, one of which was nearly mission-catastrophic.

Section I (of the AIAA report) provides the reader with background on the LCROSS project and components. Section II provides an overview of the flight mission. The remaining sections describe specific challenges encountered in planning and executing the mission and how they were overcome. The paper concludes by highlighting the key factors for the mission’s success.

Managed, partially developed, and operated from NASA Ames Research Center (ARC), LCROSS was selected under the Exploration Systems Mission Directorate’s (ESMD’s) Lunar Precursor Robotic Program (LPRP) as a secondary payload manifested with the Lunar Reconnaissance Orbiter (LRO), under a $79 million cost cap.

LCROSS was designated as a Class D mission, indicating NASA’s willingness to accept greater levels of programmatic and operational risk. Rather than incur the high cost and mission complexity associated with landing at a lunar pole, LCROSS precisely guided its Centaur Earth Departure Upper Stage (EDUS) to a lunar target as a kinetic impactor to raise a plume of polar regolith from the surface. After releasing the Centaur, the guiding Shepherding Spacecraft (S-S/C) employed a suite of nine science instruments to analyze the impact flash and plume materials at close range. Earthbased and orbiting assets, including LRO and the Hubble Space Telescope, acted in a supporting role for impact observations.

The LCROSS project remained on-budget and on-schedule, despite many programmatic and technical challenges. LCROSS launched with LRO on June 18, 2009, and on October 9, 2009, after 112 days in flight, the LCROSS team successfully delivered both the Centaur and S-S/C on-target within Cabeus crater and collected extensive data from all instruments during and after the Centaur impact.

After one month of post-impact analysis, the LCROSS science team announced the positive identification of water on the floor of Cabeus.

The LCROSS mission was faced with many challenges. Late-breaking predictions of possible Centaur gas leaks forced the operations team to revise or newly develop and test broad-reaching procedures and command sequences in the weeks prior to launch. Strict impact targeting precision requirements were made more challenging under the many perturbations to the LCROSS orbit, including from the spacecraft’s own (attitude control) thruster firings and volatiles escaping from the ice-laden Centaur exterior. LCROSS experienced two challenges to propellant reserves - a persistent Centaur gas leak and a propellant-intensive response to a very brief IRU fault. The LCROSS mission operations team, only barely large enough to staff the busy first week of flight, was taxed further by a series of anomalies that, while recoverable, stretched working hours well beyond original expectations.

Read the report (pdf), HERE.
SpaceOps 2010
Huntsville, 25-30 April 2010

Monday, April 12, 2010

The part of Apollo 13 that made it to the Moon


At least part of the Apollo 13 Saturn stack made it to the Moon, around the time Jim Lovell (on his second trip to the lunar vicinity) Rusty Swigert and Fred Haise were swinging around the Moon, preparing to use the Lunar Module descent stage to accelerate into an Earthbound re-entry window, the 3rd Stage that had propelled them out of Earth orbit slammed into the Moon. The guided impact successfully tested the seismometer left by Conrad & Bean the previous November. The SIVB came in at a steep angle (73 degrees), spreading a field of debris kilometers away, as seen in the smaller scale inset from LROC Narrow-Angle Camera image M109420042LE [NASA/GSFC/Arizona State University].

Sunday, April 4, 2010

Ranger 9

Another 'Hole in One?' Candidate impact site of Ranger 9, March 24, 1965. LROC NAC M109250398RE [NASA/GSFC/Arizona State University.]

Joel Raupe
Lunar Pioneer

As follow up on the LROC Featured Image of the Constellation program Region of Interest in northeast Alphonsus on April 2, we decided to add still more about the nearby impact of Ranger 9, March 24, 1965.

It's all but certain the LROC team deliberately aimed the Narrow Angle Camera at the forty-five year-old impact as part of it's mission goals of detailing the fifty Constellation sites and locating artifacts of the first era of lunar exploration.

Using the LROC image search browser and judging by the designation of one high-sun image of the area as a "target of opportunity" (and a deliberate roll maneuver of the LRO by 2 degrees for the session on October 3, 2009, we decided to it was worth the search through the upper middle of M109250398RE. And we think it paid off.

Judging by the relative size of Ranger when compared to later Saturn V SIVB stages, for example, already highlighted in earlier LROC releases, we were not absolutely certain what this much smaller impact would look like, though we had those clues. And we had an idea that we would probably recognize Ranger 9's footprint when we saw it.

A look at M109250398RE shows a lot of bright signatures but nothing quite so fresh as the tight scene above. If this is Ranger 9's last stop, it's a wee bit more spectacular than we had hoped. Then again, our "back of the envelope" math indicated Ranger 9 hit the Moon at a relative velocity of 2600 meters per second, based simply on it's having closed the last 700 kilometers of it's journey in 270 seconds.

A quick study of the candidate site above shows, at the very least, a very fresh impact, perhaps a direct hit within a larger and much older 8 meter crater of a type very common to the area within Alphonsus. The object excavated a lot of material in gossamer spirals hundreds of meters over the older crater rim, and it may also have punched through to some much darker material below the surface.

Some of the best digging needed to find the history of the Moon and our star system (near where the Earth has also been during this long stretch of time) has already been accomplished by impacts, and in a few far rarer cases impacts set into motion by humans. Astronauts might have broken more than a few drill bits getting down to this level.

(Adding a more personal note, Ranger 9 (as I hinted earlier) was closely followed during its long plunge to the Moon's blaster surface. It was all very inspiring to at least one young American boy who saw the whole thing on his eighth birthday.)


From 700 kilometers down to less than 7, in 270 seconds, Ranger 9, the last of NASA's hard-impact trailblazers confirmed, once again, what it's immediate predecessors had been showing. The Moon looked much the same at very different altitudes, indicating the surface had experienced crater saturation. The images, concentrated on it's eventual target, indicated by the yellow spot, are progressively closer to the Moon, moving from left to right across the top, then bottom rows. (Click HERE for Mastin's full size version of the above montage.) [NASA/GSFC/NSSDC.]

Thursday, February 25, 2010

Water and More: An Overview of LCROSS Impact


-
The LCROSS spacecraft entering thermal vacuum testing at Northrup Grumman in 2008. Months after the LCROSS impact in October, Anthony Colaprete and other LCROSS investigators will present additional details of science results at next week's 41st annual Lunar and Planetary Science Conference in Texas.

Colaprete, et.al., and the LCROSS Team, NASA Ames Research Center, The Citadel, University of California Santa Cruz, Brown University, University of Idaho and University of Texas at Austin

Introduction: Interest in the possible presence of water ice on the Moon has both scientific and operational foundations. It is thought that a variety of processes could be contributing to the accumulation of water within polar cold traps, including impacts of comets and meteorites, the reaction of solar protons with lunar soil to form water, and outgassing from the moon’s interior. One possible process involves the migration of water in the Moon’s exosphere though ballistic trajectories with eventual capture of these molecules in persistently shadowed polar cold traps. Recent discoveries of a veneer of hydroxyl and adsorbed water in sunlit regions of the moon may support this process [1,2,3]. The form and amount of water presumably associated with the hydrogen concentrations at the poles, as observed by Lunar Prospector (LP) and Lunar Reconnaissance Orbiter (LRO) may represent one end-state in the chain of processes that involve water on the moon. The LCROSS mission’s goal was to identify the source of the elevated hydrogen at the poles and provide a ground truth with regards to the total concentration. Verification of the form and amount of hydrogen can constrain models of the impact history of the lunar surface and the effects of meteorite gardening, photo-dissociation, and solar wind sputtering. With the combined observations of LCROSS, LRO and others it is possible to evaluate the global water distribution and provide a quantitative basis for studies of the Moon’s history and a test of current theories on the form and distribution of lunar hydrogen [4].


Figure 1
. The LCROSS Payload Observation Deck and its eight nadir viewing instruments (an additional solar occultation spectrometer is to the side).


Figure 2. Image of the LCROSS impact ejecta cloud as seen in the visible context camera. Inset shows the ejecta cloud expanding to fill the shadowed region targeted at the bottom of the crater Cabeus [NASA/ARC].

The LCROSS Mission: The primary objective of the Lunar Crater Observation and Sensing Satellite (LCROSS) was to confirm the presence or absence of water ice at the Moon’s South Pole. This mission used a 2300 kg kinetic impactor with more than 200 times the energy of the Lunar Prospector (LP) impact. The impact was achieved by steering the launch vehicle’s spent Centaur upper stage into a permanently shadowed polar region. The Centaur is guided to its target by a Shepherding Spacecraft (S-SC), which after release of the Centaur, flew toward the impact plume, sending real-time data and characterizing the morphology, evolution and composition of the plume with a suite of cameras and spectrometers (Figure 1). The last S-SC image and spectrum was timestamped at ~1.9 seconds prior to its impact, at a altitude of approximately 5 km from the lunar surface.

Impact Target: The specific impact site for LCROSS depended on the exact launch date for LRO. The launch date of June 18, 2009 resulted in a 112 day cruise and an impact at the South Pole on October 9. The impact site was selected based on a number of requirements including solar illumination of ejecta, association with observed hydrogen, visibility to earth, and target properties (e.g., slopes and roughness). The targeting capability of the LCROSS S-S/C, ~1 km (3s), allowed for a precise selection of impact point. In the original plan the final target selection was to be made 30 days prior to impact. It was at this point Cabeus A was selected. However, a that time, because the LCROSS trajectory did not require an anticipated trajectory correction, the final targeting maneuver was pushed off to two weeks prior to impact. This extra time was important as it allowed further consideration of LRO observations, coordination with LRO to observe the impact, and verification of LCROSS instrument health closer to the actual impact time. These considerations resulted in a move of the target from Cabeus A to Cabeus. The principle rational for this move was significant level of confidence, both in LP and LRO data, that the Cabeus target held significant amounts of hydrogen.

The Impact: On October 9, 2009 at approximately 11:31:19 UTC the Centaur impacted within about 150 meters of the planned target. The impact resulted in an ejecta cloud that was observed to expand to over 10 km across and to a height of more than 1 km above the surface (Figure 2). All instruments on the LCROSS SSC performed well and a wealth of data was collected.

All portions of the impact, including the flash, ejecta curtain and resulting crater, were observed. From the data set the presence of water was confirmed as was the presence of several other volatile species. In this presentation an overview of the results will be presented.

References: [1] Pieters et al., (2009) Science 326, pp. 568, [1] Pieters et al., (2009) Science 326, pp. 568. [2] Clark (2009), [3] Sunshine et al (2009), [4] Lucey (2000), Proc. SPIE Vol. 4137, 84-88.

From the 41st Lunar and Planetary Science Conference (2010), SPECIAL SESSION: A NEW MOON: LCROSS, CHANDRAYAAN, AND CHANG’E-1 RESULTS, Tuesday, March 2, 2010

Thursday, December 17, 2009

What Happened on Impact Night?

Paul D. Tompkins
LCROSS Flight Directors Blog
"The LCROSS mission was ultimately focused on the final four minutes of flight, starting at the time of the Centaur impact, and ending with the impact of the Shepherding Spacecraft. During that time, the Payload Engineer and the Science Team took operational center stage. Once the science payload was powered on, the team’s job was to confirm the full functionality of the instruments, and then to adjust instrument settings to make sure the data we received was the best it could possibly be. For Impact, there were no second chances – the Shepherding Spacecraft was to be destroyed as a forgone outcome of its observation of the Centaur lunar collision."
Read the latest Post HERE.

Saturday, October 31, 2009

Video of LCROSS panel at SETI Institute


Tony Colaprete, Jennifer Heldmann and Diane Wooden, with results from the LCROSS Lunar Impactor Mission; a Special Panel at the SETI Colloquium Seminar Series.

Wednesday, October 21, 2009

Once upon a time, bombing the Moon was a good idea!

Looking toward the south in 2007, Japan's Kaguya HDTV camera captured the target for the NASA JPL 1965 impact of Ranger 9. Even after high reduction of 70 kilometer-wide Ptolemaeus and its familiar contextual near side landscape in this 400 pixel column this still image is glorious [JAXA/NHK/SELENE].

("It seemed the whole world was watching these slow-scan images render on our black and white televisions. Of course, it's possible I remember it so well because the impact happened on my eighth birthday, though more likely it was my father being awestruck, that we were still watching the last very close-up pictures of the interior of Alphonsus after the impact had happened." - Joel Raupe)


Keith Cowing
OnOrbit-Alpha

"Last week LCROSS slammed into the Moon. Subsequent analyses showed that a large plume of debris was thrown up and that NASA captured a significant amount of data. Yet the public saw something very different: a mission that was designed to "bomb the Moon" and produce a pretty explosion - live for all to see. Well, no one watching could see anything close to what NASA had predicted. Clearly, NASA failed to explain the value of LCROSS to the public and over-hyped the anticipated visuals. That said, there was once a time when people understood what NASA did. Maybe the NASA of today should stop to look back at how it was once relevant. Oh yes: you may have heard of something hot and sexy called "participatory exploration" as it relates to new ways for NASA to engage the public. Well, guess what: NASA totally understood the concept back in 1967.

Read on, HERE.

Wednesday, October 14, 2009

Sodium in LCROSS ejecta confirmed

Not surprisingly, Sodium was reportedly detected in the tenuous plume produced by the impact of LCROSS, Oct. 9, by instruments on-board LRO. I say 'not surprisingly' because Sodium ion were readily identified from Earth in the late 1970's as a constituent part of the lunar exosphere.

(PhysOrg.com) -- "Boston University astronomers announced today observations of a cloud of sodium gas ejected from the Moon’s surface as a result of the..." (LCROSS impact).

"Jeffrey Baumgardner and Jody Wilson, senior research associates in the Center for Space Physics (CSP), conducted the observations from BU’s observing facility housed on the grounds of the McDonald Observatory in Ft. Davis, Texas
."

Saturday, October 10, 2009

Video: LCROSS Impact and News Conference


Live Broadcast from LCROSS Shepherding and Sensing Satellite during Terminal Descent to the floor of a permanently darkened region (PDR) within lunar crater Cabeus, Oct. 9, 2009. Having separated from the Centaur impactor, the Sensing Satellite, with its array of cameras and sensors covering various bandwidths, monitored the impact of the Centaur and its immediate aftermath, following roughly 400 km behind. [NASA/ARC]

LCROSS Post-Impact News Conference
NASA Ames Research Center, California


Friday, October 9, 2009

LCROSS not meant as entertainment

Behind that brightly lit mountain the Centaur-stage impactor of the LCROSS experiment slammed into the permanently-darkened interior of Cabeus as Caltech captured the scene using modern adaptive optics now part the legendary 200" Hale Telescope at Palomar Observatory, San Diego County, California. (Hat Tip to Emily Lakdawalla of the Planetary Society) [Antonin Bouchez/Caltech].

Palomar Observatory Images of Cabeus

If you were counting on a mushroom cloud, this morning, you were setting yourself up for disappointment. No one was trying to 'bomb the Moon,' either.

Impacts like the one that blew out a crater perhaps a meter deep and thirty meters across when LCROSS struck the coldest, darkest interior of crater Cabeus, this morning, happen on the Moon frequently. What's the matter? Haven't you ever seen something hit the Moon before?

It's important to remember the LCROSS experiment wasn't meant as fireworks or entertainment. The event's results were detected, as planned, and a visible or nearly invisible plume both will help answer the questions this experiment was designed to resolve, but patience is needed as analysts tease the real information out from the chatter.

For perspective (and because I really have wondered what this looked like for a long, long time) take a closer look below, at the very bright, very fresh crater created by another upper stage, impact, this one from Apollo 14's Saturn V, spotted in September by Lunar Reconnaissance Orbiter and released by the LROC News System, yesterday.

The event that created this blister took place almost 39 years ago.

It was detected by seismometers left on the Moon by Conrad & Bean (Apollo 12, 1969) when it happened, and it rang the Moon like a bell for three full hours after it happened.

(A Comparison between the size of this impact and that of LCROSS is discussed, HERE.)

We've known, within meters, exactly where this crater was all that time, in southeast Oceanus Procellarum where the Sun shines two weeks out of each lunar day but this is the first time anyone has actually seen it. (These things take time!)

The big picture shows a lot of bright boulders in the area. Would we actually see twisted wreckage transformed into graffiti if we were to stroll through this man-made crater?


Approximately 70 square meters of Oceanus Procellarum, centered near 8.09°S, 338.98°E, swept up in an uncalibrated image by the Narrow Angle Camera (NAC) on-board Lunar Reconnaissance Orbiter (LRO), Sept. 8, 2009. The fresh crater was formed by the directed impact of Apollo 14's Third Stage, Feb. 4, 1971. [LROC NAC-M107049825RE: LROC/NASA/GSFC/ASU]

Making an Impact (40 years ago)


Smack! - A very fresh lunar crater, from the impact of Apollo 14's 3rd Stage Saturn IVB booster, intentionally impacted into the Moon, February 4, 1971 to probe the interior structure of the Moon using seismometers left by Apollo 12. [NASA/GSFC/Arizona State University].

Mark Robinson
LROC News System

A distinctive crater about 35 m in diameter was formed when the Apollo 14 S-IVB (upper stage) was intentionally impacted into the Moon. The energy of the impact created small tremors that were measured by the seismometer placed on the Moon by Apollo 12 astronauts.

The interior of the crater has bright mounds and a bright ejecta blanket surrounds the exterior of the crater. Bright rays are observed to extend across the surface for more than 1.5 km from the impact. This image was taken when the Sun was relatively high in the sky (illumination angle of 25.1°) bringing out subtle differences in albedo (reflectivity or brightness). The Apollo 16 spacecraft first photographed this crater (Pan Camera frame 5451) and scientists noted the unusual occurrence of dark rays mixed with bright rays. Can you find the dark rays?


Apollo 14 S-IVB (S-IVB-509) was 17.8 m tall, 6.6 m in diameter, weighing ~14,000 kg. Launched carrying Apollo 14, January 31, 1971, after extraction of Lunar Module, remaining fuel was dumped and it was directed to impact the Moon February 4. [NASA Image ]

The upcoming LCROSS impact into Cabeus will also be used to probe the lunar subsurface. The Apollo 14 impact was used to send vibrations through the surface to help scientists study the internal structure of the lunar crust, the LCROSS impact will throw materials up into space so compositional measurements can be made of the subsurface from a trailing spacecraft and Earth-based telescopes.

The Apollo impact velocity was 2.54 km/sec and an angle of 69° from the horizontal along a heading of 103° (west to east). The S-IVB had a mass of 14,016 kg (30835 lbs) at the time of impact and impact energy was 5.54 x 10¹⁰ J (equivalent to just over 10 tons of TNT). The signal from the impact was recorded on the Apollo 12 seismometer; it lasted for about 3 hours. The LCROSS impactor (Centaur upper stage) is much smaller than the S-IVB and thus will make a smaller crater. The Centaur weighs about 2000 kg and will impact with a velocity of about 2.5 km/sec.

Roam around in the full NAC image comparing the S-IVB impact crater with others nearby.

Friday, August 21, 2009

LCROSS looks back from 520,000 Km

Winding up for the Swing, LCROSS turned it's cameras back for this look at Earth, and it's relatively large natural satellite, the Moon, August 17. Better views at different wavelengths are available HERE. The Centaur upper stage is still schedules to impact one of six finalist, permanently shadowed craters near the lunar south pole on October 9.