Showing posts with label UCLA. Show all posts

Monday, February 13, 2012

Howard Fink takes a closer look at Hermite A

Howard Fink at New York University continues to make full sense of the hundreds of millions of laser altimetry data points measured by the LOLA instrument on board the Lunar Reconnaissance Orbiter since June 2009 [Howard Fink/NYU/NASA/GSFC/LOLA].
Joel Raupe

A lingering concern from those early, heady days of the Vision for Space Exploration, the initiative that set in motion the five spacecraft now orbiting the Moon, has been how to take full advantage of the unprecedented amount of data the precursor robotic spacecraft would return to Earth. This was true especially of LRO, a mission that broke the record for the sheer volume of information returned from deep space (from all previous missions combined). One answer emerging has proven to be crowd-sourcing.

The regular release of data in three month intervals has inspired many not professionally attached to the mission to assemble new global maps and montages. Even so, if the science still being pulled from the data record returned by the relatively modest Lunar Pioneer mission is used as a guide it's likely new discoveries about the Moon will still be being announced a least a decade after the LRO mission comes to an inevitable end.

One of those assembling lunar terrain models from LRO data is Howard Fink of New York University, in his case the LRO laser altimetry collected by the LOLA instrument - the most comprehensive of its kind.

Fink has just released a new and better model of Hermite A, a 22 kilometer-wide highland crater with an interior in permanent shadow not far from the Moon's north pole. That model can be viewed in detail at his Wordpress AstroPhoto blog, HERE.

In addition, "in tribute to all those who don't still have to look up how to spell its name," Fink released in February a remarkable look at Rozhdestvenskiy, HERE, in the context of the whole lunar pole region. Both can readily be compared with the data gleaned from the LROC Wide Angle Camera (WAC) derived elevation model, visible using the tools accompanying the LROC QuickMap, HERE.


Related Posts:
The replicators have arrived (November 7, 2011)
LOLA: Cold Hermite (April 10, 2011)
Lunar elevation models come in many forms (March 4, 2011)
LRO's unprecedented topography of the Moon (December 17, 2010)
LROC: The Lunar North Pole (October 5, 2010)
LRO Mini-RF spends month mapping lunar poles (August 8, 2010)
'Potentially ice-rich' crater in Rozhdestvenskiy (July 2, 2010)
Coldest Spot on the Moon (December 16, 2009)

Thursday, October 28, 2010

"Dead spacecraft walking"


Artist's concept of ARTEMIS A and B (formally THEMIS-P1 and P2), after a circuitous, low-energy orbital transfer resembling a year-long round of pin-ball - back and forth many times between Lagrange points, finally in lunar orbit on a new and important mission. (A full-sized view is available HERE.) Flight Dynamics data from ARTEMIS P2 recently indicated one electric field instrument end-effector may have been struck by a meteoroid [NASA/UCLA].

Tony Phillips
Science@NASA

In 2007 NASA launched a fleet of five spacecraft into Earth's magnetosphere to study the physics of geomagnetic storms. Collectively, they were called THEMIS, short for "Time History of Events and Macroscale Interactions during Substorms." P1 and P2 were the outermost members of the quintet.

Working together, the probes quickly discovered a cornucopia of previously unknown phenomena such as colliding auroras, magnetic spacequakes, and plasma bullets shooting up and down Earth’s magnetic tail. This has allowed researchers to solve several longstanding mysteries of the Northern Lights.

The mission was going splendidly, except for one thing: Occasionally, P1 and P2 would pass through the shadow of Earth. The solar powered spacecraft were designed to go without sunlight for as much as three hours at a time, so a small amount of shadowing was no problem. But as the mission wore on, their orbits evolved and by 2009 the pair was spending as much as 8 hours a day in the dark.

"The two spacecraft were running out of power and freezing to death," says Angelopoulos. "We had to do something to save them."

The team brainstormed a solution. Because the mission had gone so well, the spacecraft still had an ample supply of fuel--enough to go to the Moon. "We could do some great science from lunar orbit," he says. NASA approved the trip and in late 2009, P1 and P2 headed away from the shadows of Earth.

With a new destination, the mission needed a new name. The team selected ARTEMIS, the Greek goddess of the Moon. It also stands for "Acceleration, Reconnection, Turbulence and Electrodynamics of the Moon’s Interaction with the Sun."

The first big events of the ARTEMIS mission are underway now. On August 25, 2010, ARTEMIS-P1 reached the L2 Lagrange point on the far side of the Moon. Following close behind, ARTEMIS-P2 entered the opposite L1 Lagrange point on Oct. 22nd. Lagrange points are places where the gravity of Earth and Moon balance, creating a sort of gravitational parking spot for spacecraft.


The ARTEMIS spacecraft are currently located at the L1 and L2 Earth-Moon Lagrange points. ARTEMIS-P1 is the first spacecraft to navigate to and perform stationkeeping operations around the Earth-Moon L1 and L2 Lagrangian points. A full-size view is available HERE, and a YouTube demonstration of the route taken to the new mission can be seen HERE [NASA/GSFC/UCLA].

"We're exploring the Earth-Moon Lagrange points for the first time," says Manfred Bester, Mission Operations Manager from the University of California at Berkeley, where the mission is operated. "No other spacecraft have orbited there."

Because they lie just outside Earth's magnetosphere, Lagrange points are excellent places to study the solar wind. Sensors onboard the ARTEMIS probes will have in situ access to solar wind streams and storm clouds as they approach our planet—a possible boon to space weather forecasters. Moreover, working from opposite Lagrange points, the two spacecraft will be able to measure solar wind turbulence on scales never sampled by previous missions.

"ARTEMIS is going to give us a fundamental new understanding of the solar wind," predicts David Sibeck, ARTEMIS project scientist at the Goddard Space Flight Center. "And that's just for starters."

ARTEMIS will also explore the Moon's plasma wake—a turbulent cavity carved out of the solar wind by the Moon itself, akin to the wake just behind a speedboat. Sibeck says "this is a giant natural laboratory filled with a whole zoo of plasma waves waiting to be discovered and studied."

Another target of the ARTEMIS mission is Earth's magnetotail. Like a wind sock at a breezy airport, Earth's magnetic field is elongated by the action of the solar wind, forming a tail that stretches to the orbit of the Moon and beyond. Once a month around the time of the full Moon, the ARTEMIS probes will follow the Moon through the magnetotail for in situ observations.
"Orbiting the Moon is notoriously tricky, however, because of irregularities in the lunar gravitational field."
"We are particularly hoping to catch some magnetic reconnection events," says Sibeck. "These are explosions in Earth's magnetotail that mimic solar flares--albeit on a much smaller scale." ARTEMIS might even see giant 'plasmoids' accelerated by the explosions hitting the Moon during magnetic storms.

These far-out explorations may have down-to-Earth applications. Plasma waves and reconnection events pop up on Earth, e.g., in experimental fusion chambers. Fundamental discoveries by ARTEMIS could help advance research in the area of clean renewable energy.

After six months at the Lagrange points, ARTEMIS will move in closer to the Moon—at first only 100 km from the surface and eventually even less than that. From point-blank range, the spacecraft will look to see what the solar wind does to a rocky world when there's no magnetic field to protect it.

"Earth is protected from solar wind by the planetary magnetic field," explains Angelopolous. "The Moon, on the other hand, is utterly exposed. It has no global magnetism."

Studying how the solar wind electrifies, alters and erodes the Moon's surface could reveal valuable information for future explorers and give planetary scientists a hint of what's happening on other unmagnetized worlds around the solar system.

Orbiting the Moon is notoriously tricky, however, because of irregularities in the lunar gravitational field. Enormous concentrations of mass (mascons) hiding just below the surface tug on spacecraft in unexpected ways, causing them over time to veer out of orbit. ARTEMIS will mitigate this problem using highly elongated orbits ranging from tens of km to 18,000 km.

"We'll only be near the lunar surface for a brief time each orbit (accumulating a sizable dataset over the years)," explains Angelopoulos. "Most of the time we'll linger 18,000 km away where we can continue our studies of the solar wind at a safe distance."

The Dead Spacecraft Walking may have a long life ahead, after all.

Related Posts:
NASA update: ILN Anchor Nodes
and Robotic Lunar Lander Project

August 17, 2010

THEMIS becomes ARTEMIS
Aviation Week
July 30, 2010


Robotic Lunar Landers
for Science and Exploration

41st Lunar and Planetary Science Conference, #2616
March 4, 2010


ARTEMIS, A Two Spacecraft, Planetary
and Heliospheric Lunar Mission
41st Lunar and Planetary Science Conference, #1425
March 4, 2010


Update on the new lunar phase
of THEMIS mission

UC Berkeley Daily Tech
October 30, 2009


ARTEMIS to Lagrange points
to lunar orbit

April 26, 2009

Tuesday, October 26, 2010

LRO-Diviner Lunar Radiometer observations of cold traps in the Moon’s south polar region

David A. Paige,1* Matthew A. Siegler,1 Jo Ann Zhang,1 Paul O. Hayne,1 Emily J. Foote,1 Kristen A. Bennett,1 Ashwin R. Vasavada,2 Benjamin T. Greenhagen,2 John T. Schofield,2 Daniel J. McCleese,2 Marc C. Foote,2 Eric DeJong,2 Bruce G. Bills,2 Wayne Hartford,2 Bruce C. Murray,3 Carlton C. Allen,4 Kelly Snook,5 Laurence A. Soderblom,6 Simon Calcutt,7 Fredric W. Taylor,7 Neil E. Bowles,7 Joshua L. Bandfield,8 Richard Elphic,9 Rebecca Ghent,10 Timothy D. Glotch,11 Michael B. Wyatt,12 Paul G. Lucey13
22 OCTOBER 2010 VOL 330 SCIENCE

Diviner Lunar Radiometer Experiment surface-temperature maps reveal the existence of widespread surface and near-surface cryogenic regions that extend beyond the boundaries of persistent shadow. The Lunar Crater Observation and Sensing Satellite (LCROSS) struck one of the coldest of these regions, where subsurface temperatures are estimated to be 38 kelvin. Large areas of the lunar polar regions are currently cold enough to cold-trap water ice as well as a range of both more volatile and less volatile species. The diverse mixture of water and high-volatility compounds detected in the LCROSS ejecta plume is strong evidence for the impact delivery and cold-trapping of volatiles derived from primitive outer solar system bodies.

The Moon’s polar regions are notable because of their potential to cryogenically trap water ice and other volatile species (1). The Lunar Reconnaissance Orbiter (2) (LRO) Diviner Lunar Radiometer Experiment has been mapping the infrared emission from the Moon since July 2009 using seven spectral channels that span a wavelength range from7.55 to 400 mmat a spatial resolution of ~200 m (3).

Thermal maps of the south polar region (Fig. 1, A and B) were obtained during the LRO monthly mapping cycle just before the Lunar Crater Observation and Sensing Satellite (LCROSS) impact (4), as the Moon approached southern summer solstice (5). The mapped quantity is the bolometric brightness temperature, which is the wavelength-integrated radiance in all seven Diviner channels expressed as the temperature of an equivalent blackbody (6). For quantifying the overall heat balance of the surface and comparing with available models, the bolometric brightness temperature is the most fundamental and interpretable measurable quantity.

For the simplest case in which Diviner’s surface footprint is filled with a blackbody of uniform surface temperature, the bolometric brightness temperature will be equal to the temperature of the surface.


Figure 1. Maps of measured and model-calculated surface and subsurface temperatures in the lunar south polar region. The outer circle on all maps is 80° south latitude. Observations were acquired between 6 September and 3 October 2009 as the Moon approached southern summer solstice. (A) Diviner-measured daytime bolometric brightness temperatures acquired between 11.4 and 13.6 hours local time (5). (B) Diviner-measured nighttime bolometric brightness temperatures acquired between 21.41 and 1.66 hours local time (5). (C) Model-calculated annual average near-surface temperatures and the location of the LCROSS impact in Cabeus Crater. (D) Model-calculated depths at which water ice would be lost to sublimation at a rate of less than 1 kg/m−2 per billion years. - The white regions define the locations where water ice can currently be cold trapped on the surface, the colored regions define the upper surface of the lunar ice permafrost boundary and the gray regions define locations where subsurface temperatures are too warm to permit the cold-trapping of water ice within 1 m of the surface.

In the more general case, where Diviner’s surface footprint contains small-scale slopes, shadows, or rocks, the brightness temperatures in Diviner’s individual infrared channels may vary with wavelength depending on the distribution of sub–footprint-scale temperatures, spectral emissivities, and photometric properties. In this case, the bolometric brightness temperature cannot be interpreted in terms of a unique surface temperature. However, within cold regions that are not in direct sunlight, simultaneously acquired brightness temperatures in Diviner channels 7 (25 to 41 mm), 8 (50 to 100 mm), and 9 (100 to 400 mm) are in good agreement (6), which is consistent with uniformly high spectral emissivity across this wavelength range and relatively uniform temperatures within each Diviner footprint (fig. S1, A and B). This interpretation is supported by the results of an analysis of data acquired in each of the Diviner infrared channels at the LCROSS impact site in Cabeus Crater (7). For unilluminated regions, we use Diviner bolometric brightness temperatures as reasonably accurate proxies for the temperature of the surface.

The thermal maps show that the coldest regions are located on the floors of larger impact craters that receive no direct sunlight (Fig. 1,A and B). For these regions, previous modeling studies have shown that the main heat source is emitted infrared radiation from distant interior sunlit crater walls (8–11). Topographic relief within cold crater floor regions can provide additional radiation shielding, resulting in intensely cold localized regions with measured mid-day bolometric brightness temperatures as low as 29 K. Heat flow fromthe lunar interior may contribute to the overall heat balance of these coldest surfaces, but is not dominant compared to heating from scattered solar and infrared radiation during this season (6). Diviner’s summer solstice observations represent a valuable snapshot of the south polar region surface temperatures that can be extended in depth and in time with models. We have developed a thermal model that realistically accounts for the effects of large-scale topographic relief on direct and indirect solar and infrared radiation on the heat balance of the lunar surface (6). The model uses a ~500-m-scale triangular mesh based on south polar topography derived from the Kaguya LALT laser altimeter (12) and a spatially uniform set of thermal and reflectance parameters that are generally consistent with those derived from previous studies (6). The excellent overall agreement between maps (fig. S3, A and B) and histograms (Fig. 2A) of the observed and calculated bolometric temperatures demonstrate the general validity of our modeling approach. The only notable discrepancy occurs for daytime temperatures in the shadowed portions of craters that have measured bolometric temperatures in the range of 60 to 120 K, where the model underestimates temperatures by roughly 15 K (fig. S4, A and B). This may be largely due to directionally anisotropic infrared emission from rough sunlit crater walls, which is not accounted for in the present model (6). Given the better agreement between the model and the Diviner nighttime data, we estimate that the net effect on model-calculated annual average temperatures at 2-cm depth (Figs. 1C and 2B) is less than 7 K in the warmest craters and close to zero in the coldest craters. For the limiting case of zero heat flow from the lunar interior, the temperatures at greater depths would be close to this near-surface average temperature (11). However, with nonzero heat flow, average temperatures will increase with depth at a rate proportional to the heat flow rate and inversely proportional to the thermal conductivity. Using parameters derived from the heat flow experiments at the Apollo 15 and 17 landing sites (13), we estimate that LCROSS impact site temperatures at 2-m depth should be <6 K higher than annual average surface temperatures (fig. S5). Although the Diviner bolometric temperatures presented here and cooling curves at the LCROSS impact site are generally consistent with the presence of unconsolidated regolith near the surface (7, 14), the thermophysical properties of the Moon’s cryogenic regolith are not currently well constrained and could differ substantially from those in warmer regions (15), particularly at depth.


Figure 2. (A) Normalized histograms of measured daytime and nighttime bolometric brightness temperatures for the maps shown in Fig. 1, A and B, with comparisons to model-calculated surface temperatures at the same locations and times as those of the Diviner observations (fig. S3, A and B). (B) Histograms of model-calculated annual average temperatures at 2-cm depth for the maps shown in Fig. 1C and fig. S7, A to D, and at the LCROSS impact site for selected values of qmax, the mean maximum angle between the Moon’s spin axis and the normal to the ecliptic plane. qmax =1.54° for present-day conditions. (C) The recent evolution of qmax as a function of the Earth-Moon distance (29). (D) The volatility temperatures of a range of potential cold-trapped volatile compounds (21, 22) View higher-resolution Fig. 2 HERE.

We expect that the Moon’s cryogenic regions extend to depths of at least tens of meters below the surface, but estimating the volumetric extent of the Moon’s cryogenic regions purely from surface-temperature observations is highly uncertain.

Thermal model results can be used to estimate the stability of water ice deposits to loss by sublimation and diffusive migration through the lunar regolith (11, 16). Figure 1D shows a map of the depths at which water ice would be lost at a rate of less than 1 kg m−2 per billion years, which corresponds to a loss rate of 1 mm per billion years for a pure ice deposit (6). The results show that surface cold traps for water ice are surrounded by much more extensive “lunar permafrost” regions where water ice is stable in close proximity to the surface (17). These regions may receive direct solar radiation during periods when solar lighting conditions are most favorable, but maintain annual maximum temperatures at depth that are sufficiently cold to effectively prevent appreciable water loss due to sublimation. Because of their more hospitable surface thermal and illumination environments, lunar permafrost regions may be accessible locations for future in situ exploration of the Moon’s cold traps.

The overall picture painted by the present thermal state of the lunar south polar region is one of extreme cold. Temperatures in the Moon’s larger cold traps are closer to those expected for the poles of Pluto (18) than for Earth’s closest neighbor. At the cold temperatures that exist within most south polar craters, cold-trapped water molecules have negligible mobility (16), such that any water molecules deposited on the surface will not effectively diffuse below the surface where they can be protected from loss processes such as photolysis and sputtering (19). In cryogenic regions, burial of frozen volatiles by impact gardening is likely to be a much more effective process (20). However, warmer permafrost regions that currently exist at the margins of cold traps may represent somewhat more favorable environments for the downward diffusion of water molecules into the regolith, which should be aided by the daytime temperature gradient between warmer surface layers and colder subsurface layers below.

The distribution of temperatures in the lunar south polar region also places constraints on the thermal stability of non-water volatile species. Figure 2D shows the volatility temperatures (the temperatures at which pure solids exposed to vacuum at the surface would sublimate at a rate of 1 mm per billion years) for several volatile species (21, 22). Non-water subsurface volatiles will also be stable to sublimation at higher temperatures owing to the effects of diffusive migration through the regolith (6). Large areas of the lunar south polar region have the capability to cold-trap water and less volatile species such as mercury and sodium. All three of these volatile species were in the LCROSS ejecta plume (4, 14, 23).

Colder surface and subsurface areas in the south polar region also have the capability to cold-trap so-called super volatile species that have higher volatility than water, which include compounds such as sulfur dioxide, carbon dioxide, formaldehyde, ammonia, and methanol. The detection of a representative cross-section of these same supervolatile species in the LCROSS ejecta plume (4) represents strong evidence for the impact delivery of volatiles to the Moon by primitive outer solar system bodies, and the subsequent cold-trapping of these volatiles at the lunar poles (21, 22).

A question of interest regarding the lunar cold traps is whether they contain abundant deposits of nearly pure water ice such as those discovered by radar observations of impact craters at the poles of Mercury (24). Diviner-measured summer solstice daytime and nighttime surface bolometric brightness temperatures of 46.7 and 38.7 K in the region surrounding the LCROSS impact site, and model-calculated annual average temperatures at this site at a depth of 2 cm, are close to 38 K (6). As shown in Figs. 1, C and D, and 2B, the LCROSS impact site is a surface cold trap for water and is among the coldest locations in the south polar region. The Lunar Prospector Neutron Spectrometer (LPNS) results show that the average hydrogen abundance in the near-surface regolith at the south pole is ~70 parts per million (ppm) by weight, which translates to a water-equivalent average abundance of ~600 ppm by weight (25). Our results show that the surface and near-surface water ice cold traps comprise >66% of the surface area poleward of 85° south latitude (Fig. 1D). If we assume that all the hydrogen detected by LPNS was uniformly distributed within these cold traps, then the average water-equivalent abundance would be only ~1000 ppm by weight, which is substantially less than the 1 to 10% water content inferred at the LCROSS impact site (4). This suggests that the LCROSS site must be enriched in water compared to the average south polar near-surface cold trap, which is consistent with enhanced hydrogen abundances observed in the Cabeus region by orbital neutron spectrometers (26–28).

The spin pole of the Moon is currently in a tidally damped Cassini State 2 configuration in which the time-averaged maximum angle between theMoon’s spin axis and the normal to the ecliptic plane (qmax) has decreased to its present value of qmax = 1.54° as the Earth-Moon distance increased over time (Fig. 2C) (29). The absolute time scale for the tidal evolution of the Earth-Moon system is highly uncertain, but it is likely that the transition depicted in Fig. 2C has occurred over a period of more than 1 billion years (30). Model-calculated annual average near-surface temperatures qmax = 4°, 8°, 12°, and 16° (Fig. 2B and fig. S7, A to D) show that portions of the Moon’s south polar region cooled considerably as the Moon’s orbital radius increased, first creating cold traps capable of cold-trapping water, and then trapping compounds with higher volatility. The LCROSS impact site,which is located on the floor of the large Cabeus impact crater, is typical of the coldest areas on the Moon today. However, earlier in the Moon’s orbital history, when qmax was greater than ~10°, the floors of large-impact craters were not the coldest areas on the Moon because the walls of these relatively shallow craters did not shield their floors from direct solar radiation. Based on the results in Fig. 2B and fig. S7, A to D, the Moon’s earliest surviving near-surface cold traps are not located on the floors of large-impact craters, but rather on the floors of intermediate-sized craters, which thus may have had longer opportunities to accumulate water ice.

1Department of Earth and Space Sciences, University of California, Los Angeles, 595 Charles E. Young Drive East, Los Angeles, CA 90095, USA. 2Jet Propulsion Laboratory, California Institute of Technology, Pasadena, CA 91109, USA. 3California Institute of Technology, Pasadena, CA 90025, USA. 4NASA Johnson Space Center, Houston, TX 77058, USA. 5NASA Goddard Space Flight Center, Greenbelt, MD 20771, USA. 6U.S. Geological Survey, Flagstaff, AZ 86001, USA. 7Oxford University, Oxford OX1 3PU, UK. 8University of Washington, Seattle, WA 98195, USA. 9NASA Ames Research Center, Moffett Field, CA 94035, USA. 10University of Toronto, Toronto, ON M5S 3B1, Canada. 11State University of New York, Stony Brook, NY 11794, USA. 12Brown University, Providence, RI 02912, USA. 13University of Hawaii, Honolulu, HI 96822, USA.

*To whom correspondence should be addressed. E-mail: dap@moon.ucla.edu

References and Notes:

1. K. Watson, B. C. Murray, H. Brown, J. Geophys. Res. 66, 3033 (1961).
2. G. Chin et al., Space Sci. Rev. 129, 391 (2007).
3. D. A. Paige et al., Space Sci. Rev. 150, 125 (2010).
4. A. Colaprete et al., Science 330, 463 (2010).
5. The LRO orbit plane is inclined 90° to the lunar equator and is fixed in inertial space. LRO’s ground track rotates through 360° of longitude every sidereal month, allowing Diviner to make one daytime and one nighttime map every 27.3-day mapping cycle in pushbroom nadir mapping mode. Local time on the Moon can be expressed in hours by normalizing the angular distance between geographic longitude and the longitude of the solar point to a 24-hour day. We define daytime to be between 6 a.m. and 6 p.m. local time, and nighttime to be between 6 p.m. and 6 a.m. local time. Because the plane of the LRO orbit rotates relative to the lunar terminator by 360° every Earth year, the local times of Diviner’s observations drift by ~2 hours during each mapping cycle. The subsolar latitude on the Moon currently varies by approximately T1.54° over the course of the Moon’s 346-day draconic year, resulting in distinct seasonal temperature variations at the highest latitudes. The LRO launch date was chosen so that the LRO orbit plane was within 10° of the noon-midnight plane during LRO’s first southern summer solstice.
6. Supporting material is available on Science Online.
7. P. O. Hayne et al., Science 330, 477 (2010).
8. R. R. Hodges, Lunar Planet Sci. Conf. 11, 2463 (1980).
9. D. A. Paige, S. E. Wood, A. R. Vasavada, Science 258, 643 (1992).
10. A. P. Ingersoll et al., Icarus 100, 40 (1992).
11. A. R. Vasavada et al., Icarus 141, 179 (1999).
12. H. Araki et al., Science 323, 897 (2009).
13. M. G. Langseth et al., Proc. Lunar Sci. Conf. 7, 3143 (1976).
14. P. H. Schultz et al., Science 330, 468 (2010).
15. G. J. Taylor et al., Proceedings of Space Resources Roundtable VI. LPI Contribution No. 1224., Golden, CO, Abstract 6040 (Lunar and Planetary Institute, Houston, TX, 2004).
16. N. Schorghofer, G. J. Taylor, J. Geophys. Res. 112, E02010 (2007).
17. We estimate that the total area of surface water ice cold traps in the lunar south polar region shown in Fig. 1D is 13,087 km2, and the total area of near-surface water ice cold traps to a depth of 1 m is 119,507 km2.
18. C. J. Hansen, D. A. Paige, Icarus 120, 247 (1996).
19. T. H. Morgan, D. E. Shemansky, J. Geophys. Res. 96 (A2), 1351 (1991).
20. D. H. Crider, R. R. Vonrak, Adv. Space Res. 31, 2293 (2003).
21. J. A. Zhang, D. A. Paige, Geophys. Res. Lett. 36, L16203 (2009).
22. J. A. Zhang, D. A. Paige, Geophys. Res. Lett. 37, L03203 (2010).
23. G. R. Gladstone, Science 330, 472 (2010).
24. J. K. Harmon, Space Sci. Rev. 132, 307 (2007).
25. W. C. Feldman et al., J. Geophys. Res. 106 (E10), 23,231 (2001).
26. D. J. Lawrence et al., J. Geophys. Res. 111, E08001 (2006).
27. R. C. Elphic et al., Geophys. Res. Lett. 34, L13204 (2007).
28. I. Mitrofanov et al., Lunar Planet. Sci. Conf. 41, 2250 (2010).
29. W. R. Ward, Science 189, 377 (1975).
30. B. G. Bills, R. D. Ray, Geophys. Res. Lett. 26, 3045 (1999).
31. We thank the many people at the Jet Propulsion Laboratory and the Goddard Space Flight Center who contributed to the success of the Diviner instrument and the LRO project. We also thank the National Aeronautics and Space Administration for funding this investigation.

Supporting Online Material
www.sciencemag.org/cgi/content/full/330/6003/479/DC1
Methods Figs. S1 to S7
References 1 February 2010; accepted 12 August 2010 10.1126/science.1187726

Thursday, October 21, 2010

LRO analysis of LCROSS data proves essential

Updated October 25, 2010, 1837 UT

Investigators and teams operating advanced instruments flying on-board Lunar Reconnaissance Orbiter mapped the impact of the LCROSS impactor and its aftermath, October 9, 2009. Their full reports were discussed October 21, 2010, coincident with being published in the journal Science. LRO approaches the impact, seen as a true false-color map of the measured dissipation of heat 21 seconds after the impact in the permanently shadowed region of the Cabeus crater group [NASA/GSFC/UCLA/SVS].

Bill Steigerwald
Goddard Space Flight Center

Last year on October 9, NASA's LCROSS (Lunar Crater Remote Observation and Sensing Satellite) intentionally crashed its companion Centaur upper stage into the Cabeus crater near the lunar south pole. The idea was to kick up debris from the bottom of the crater so its composition could be analyzed. The Centaur hit at over 5,600 miles per hour, sending up a plume of material over 12 miles high.

"Seeing mostly pure water ice grains in the plume means water ice was somehow delivered or chemical processes are causing ice to accumulate in large quantities," said Anthony Colaprete, LCROSS project scientist and principal investigator at NASA's Ames Research Center, Moffett Field, CA. "Furthermore, the diversity and abundance of certain materials called volatiles in the plume, suggest a variety of sources, like comets and asteroids, and an active water cycle within the lunar shadows."

LCROSS was a companion mission to NASA's Lunar Reconnaissance Orbiter (LRO) mission, launched in tandem with the advanced lunar orbiter, June 18, 2009.

The two missions were designed to work together, and support from LRO was critical to the success of LCROSS. During impact, LRO, which is normally looking at the lunar surface, was tilted toward the horizon so it could observe the plume. Shortly after the Centaur hit the Moon, LRO flew past debris and gas from the impact while its instruments collected data.

"LRO assisted LCROSS in two primary ways -- selecting the impact site and confirming the LCROSS observations," said Gordon Chin of Goddard Space Flight Center, LRO associate project scientist.


The LCROSS Shepherding and Sensing module immediately follows the empty Centaur impactor, returning data to Earth on the latter's impact and the formation of a 30 meter crater seconds before its own impact nearby. LRO approached and passed the relatively "water-rich" 72 square km permanently shadowed target and orbited nearly overhead the following orbit, measuring the signature of both impacts. Both vehicles had been launched together the previous June. (LRO, still in orbit, has now orbited the Moon more than 6000 times) Scene taken from new animation released by NASA, October 21, 2010 [NASA/GSFC/ARC].

"Since observatories on Earth were also planning to view the impact, there were a lot of constraints on the location -- the impact plume had to rise out of the crater and into sunlight, and it had to be visible from Earth," said Chin.

Prior to the impact, LRO's instruments worked together to map and provide details on the polar regions, according to Chin. For example, LRO's Lunar Orbiter Laser Altimeter (LOLA) instrument built up three-dimensional (topographic) maps of the surface. This data was plugged into computer simulations to see how shadows change as the Moon moves in its orbit, so that regions in permanent shadow could be identified. The Lunar Reconnaissance Orbiter Camera (LROC) helped by making images of the actual regions of light and shade, which were used to verify the simulation's accuracy. Finally, LOLA measured the depths of polar craters to find areas where the impact could still be seen from Earth.

Since hydrogen is a component of water, maps of lunar hydrogen deposits are useful for finding areas that might hold water. Preliminary hydrogen maps were provided by the spacecraft's Lunar Exploration Neutron Detector (LEND) instrument. Regions that had relatively high amounts of hydrogen were identified as the most promising for the impact.

"Over a year ago, we formally suggested Cabeus to the LCROSS principal investigator," said LEND principal investigator, Igor Mitrofanov of the Institute for Space Research, Moscow. "According to our current data, the regolith within the Cabeus impact crater may have the highest content of water anywhere on the Moon, perhaps up 4.0 percent weight."

"Originally, the LCROSS team was going with a site further north than the Cabeus crater, because it was better for Earth visibility," said Chin. "However, LEND revealed that the area did not have a high hydrogen concentration, but Cabeus did. Also, Diviner showed that Cabeus was one of the coldest sites, and LOLA indicated it was in permanent shadow. So, we were able to inform the decision to aim for Cabeus further south -- while it was a little less visible from Earth, Cabeus was ultimately better for what we were trying to find."

Temperature maps from LRO's Diviner instrument were also crucial to identify where the coldest places were.

David Paige, principal Investigator of the Diviner instrument from the University of California, Los Angeles, used temperature measurements of the lunar south pole obtained by Diviner to model the stability of water ice both at and near the surface.

"The temperatures inside these permanently shadowed craters are even colder than we had expected. Our model results indicate that in these extreme cold conditions, surface deposits of water ice would almost certainly be stable," said Paige, "but perhaps more significantly, these areas are surrounded by much larger permafrost regions where ice could be stable just beneath the surface."

"We conclude that large areas of the lunar south pole are cold enough to trap not only water ice, but other volatile compounds (substances with low boiling points) such as sulfur dioxide, carbon dioxide, formaldehyde, ammonia, methanol, mercury and sodium," Paige added.

UCLA graduate student and Diviner team member, Paul Hayne, was monitoring the data in real-time as it was sent back from Diviner.


Diviner brightness temperature swath acquired about 90 seconds after the LCROSS impact, the location of which is indicated by the white arrow. Based on the Diviner measurements, the impact site was heated to more than 380°C (1,300°F) Click HERE for larger view [UCLA/NASA/JPL/GSFC].

"During the fly-by 90 seconds after impact, all seven of Diviner's infrared channels measured an enhanced thermal signal from the crater. The more sensitive of its two solar channels also measured the thermal signal, along with reflected sunlight from the impact plume. Two hours later, the three longest wavelength channels picked up the signal, and after four hours only one channel detected anything above the background temperature."

Scientists were able to learn two things from these measurements: first, they were able to constrain the mass of material that was ejected outwards into space from the impact crater; second, they were able to infer the initial temperature and make estimates about the effects of ice in the soil on the observed cooling behavior.

Another LRO instrument, the Lyman-Alpha Mapping Project (LAMP), used data on the gas cloud to confirm the presence of the molecular hydrogen, carbon monoxide and atomic mercury, along with smaller amounts of calcium and magnesium, all in gaseous form.

"We had hints from Apollo soils and models that the volatiles we see in the impact plume have been long collecting near the Moon’s polar regions," said Randy Gladstone, LAMP acting principal investigator, of Southwest Research Institute (SwRI) in San Antonio, Texas. "Now we have confirmation."


The Lyman Alpha Mapping Project (LAMP) ultraviolet spectrograph onboard LRO observed the LCROSS plume as far-ultraviolet emissions from the fluorescence of sunlight by molecular hydrogen and carbon monoxide, plus resonantly scattered sunlight from atomic mercury, with contributions from calcium and magnesium. The observed light curve is well simulated by the expansion of a vapor cloud at a temperature of ~1000 kelvin, containing ~570 kilograms (kg) of carbon monoxide, ~140 kg of molecular hydrogen, ~160 kg of calcium, ~120 kg of mercury, and ~40 kg of magnesium [NASA/LRO/SwRI].

"The detection of mercury in the soil was the biggest surprise, especially that it’s in about the same abundance as the water detected by LCROSS," said Kurt Retherford, LAMP team member, also of SwRI.

"The observations by the suite of LRO and LCROSS instruments demonstrate the moon has a complex environment that experiences intriguing chemical processes," said Richard Vondrak, LRO project scientist at NASA Goddard. "This knowledge can open doors to new areas of research and exploration."

Related Links> NASA press release | Media briefing materials


View the full-size video, HERE.

LRO-Diviner: Widespread water on the Moon

Scientists from NASA’s Diviner Lunar Radiometer Experiment team published research in this week’s issue of Science that points to the widespread presence of water ice in large areas of the lunar south pole.

The Diviner Lunar Radiometer aboard NASA’s Lunar Reconnaissance Orbiter (LRO) has made the first-ever infrared measurements of temperatures in the permanently shadowed craters at the lunar poles. In October 2009, Diviner also made the first infrared observations of a controlled planetary impact when LCROSS, the companion spacecraft to LRO, slammed into one of the coldest of these craters in an experiment to confirm the presence of absence of water ice.
David Paige, Principal Investigator of the instrument, and lead author of one of two Science papers based on its observations, used temperature measurements of the lunar south pole obtained by Diviner to model the stability of water ice both at and near the surface.

“The temperatures inside these permanently-shadowed craters are even colder than we had expected. Our model results indicate that in these extreme cold conditions, surface deposits of water ice would almost certainly be stable,” says Paige, “but perhaps more significantly, these areas are surrounded by much larger permafrost regions where ice could be stable just beneath the surface.”

This lunar ‘permafrost’ would be analogous to the high-latitude terrain found on the Earth and on Mars, where sub-freezing temperatures persist below the surface throughout the year.

“These permafrost regions may receive direct sunlight at certain times of the year, but they maintain annual maximum subsurface temperatures that are sufficiently cold to prevent significant amounts of ice from vaporizing,” says Paige.

Given that these lunar permafrost regions are not in permanent shadow, surface lighting and thermal conditions in these locations would be far more hospitable for humans, which makes them of prime interest for future manned missions to the moon. Subsurface water ice deposits are also likely to be more stable than surface deposits of water ice because they are protected from bombardment by ultraviolet radiation and energetic cosmic particles.

“We conclude that large areas of the lunar south pole are cold enough to trap not only water ice, but other volatile compounds (substances with low boiling points) such as sulphur dioxide, carbon dioxide, formaldehyde, ammonia, methanol, mercury and sodium.”


LRO Diviner Lunar Radiometer Experiment surface temperature map of the south polar region of the Moon. The data were acquired during September and October, 2009 when south polar temperatures were close to their annual maximum values. The map shows the locations of several intensely cold impact craters that are potential cold traps for water ice as well as a range of other icy compounds commonly observed in comets. The approximate maximum temperatures at which these compounds would be frozen in place for more than a billion years is shown next to the scale on the right. The LCROSS spacecraft was targeted to impact one of the coldest of these craters, and many of these compounds, including water, were observed in the LCROSS ejecta plume. Based on an illustration in the journal Science [UCLA/JPL/GSFC/NASA].

LRO Diviner Lunar Radiometer Experiment surface temperature map of the south polar region of the Moon. The data were acquired during September and October, 2009 when south polar temperatures were close to their annual maximum values. The map shows the locations of several intensely cold impact craters that are potential cold traps for water ice as well as a range of other icy compounds commonly observed in comets. The approximate maximum temperatures at which these compounds would be frozen in place for more than a billion years is shown next to the scale on the right. The LCROSS spacecraft was targeted to impact one of the coldest of these craters, and many of these compounds, including water, were observed in the LCROSS ejecta plume. Credit: Based on a figure in the journal Science (UCLA/JPL/GSFC/NASA).

A representative cross-section of these substances was detected by the LCROSS near-infrared spectrometers when its upper stage rocket impacted into Cabeus crater, ejecting a host of material that was previously buried beneath its surface.

The impact site was situated within a permanently-shadowed part of Cabeus with an average annual temperature of 37 K (-393 °F), making it one of the coldest locations near the lunar south pole. Temperature data from Diviner played a key role in the selection of Cabeus as the target for LCROSS, and when it came time for impact, Diviner scientists and engineers made sure that the instrument had a front row seat: Diviner targeted the impact site for 8 orbits spaced roughly 2 hours apart, the closest of which was timed to pass by 90 seconds after impact. It observed an enhanced thermal signal on this and two subsequent orbits.

Paul Hayne, UCLA graduate student and lead author of the second paper appearing in Science, was monitoring the data in real-time as it was sent back from Diviner.

“During the fly-by 90 seconds after impact, all seven of Diviner’s infrared channels measured an enhanced thermal signal from the crater. The more sensitive of its two solar channels also measured the thermal signal, along with reflected sunlight from the impact plume. Two hours later, the three longest wavelength channels picked up the signal, and after four hours only one channel detected anything above the background temperature.”


Diviner brightness temperature measurements of the lunar surface near the LCROSS impact site in Cabeus crater. (A) Before and after images of the LCROSS impact site in each of five different Diviner channels, with the thermal emission from the impact circled in the right-hand column, taken approximately 90 seconds after the Centaur impacted the lunar surface. (B) Pre-impact surface temperatures in Cabeus crater recorded by Diviner indicate the LCROSS impact site ('x') was only 40 degrees Celsius above absolute zero just before the impact . See full-sized illustration, HERE. [Science]

Scientists were able to learn two things from these measurements: firstly, they were able to constrain the mass of material that was ejected outwards into space from the impact crater; secondly, they were able to infer the initial temperature and make estimates about the effects of ice in the soil on the observed cooling behavior.

“Diviner’s solar channel measured scattered sunlight from the impact plume over an area of 140 km2 (54 sq mi). Using this measurement we were able to place constraints on the mass of the cloud at between 1,200 kg and 5,800 kg (2,700 - 12,800 lbs), which is consistent with measurements by the LCROSS Shepherding Spacecraft,” says Hayne. “This is important because the cloud mass is used to estimate the abundance of water observed by the LCROSS spectrometers.”

“In addition, we determined that in order to agree with the data from each of Diviner’s channels, the impact must have heated a region of 30 to 200 m2 (320 – 2150 ft2) to at least 950 K (1250 °F). This concentrated region was surrounded by a larger, lower temperature component that would have included the surrounding blanket of material excavated by the impact.”

Given that ice within soil pore spaces influences cooling because it uses up heat energy in the process of sublimating, and conducts heat more efficiently than lunar soil does, scientists were able to use Diviner’s measurements of cooling at the impact site to place constraints on the proportion of volatiles present.

“The fact that heated material was still visible to Diviner after four hours indicates LCROSS did not hit a skating rink; the ice must have been mixed within the soil,” says Hayne, “we estimate that for an area of 30 to 200 m2, the steaming crater could produce more than enough water vapor to account for what was observed by LCROSS over a four minute period.”

“Although Cabeus crater is typical of the coldest areas on the moon today, we have determined that billions of years ago, smaller craters with steeper walls would have made more favorable cold-traps,” says Paige, “it is therefore possible that the craters which have accumulated the most ice are not the coldest ones.”

The results presented in both papers represent strong evidence in support of the theory that volatiles have been delivered to the moon by impacts by icy bodies from the outer solar system and then ‘cold-trapped’ at the lunar poles.

The research covered here is from two of six papers published in Science by scientists from LCROSS and LRO. The research was funded by NASA.

Monday, September 20, 2010

Hansteen Alpha yields some of its secrets


Mons Hansteen (12.3°S, 309°8E), unusually bright for a remnant volcanic feature, is a 30 km-wide, 300 meter high mountain that, together with the inundated 48 km-wide Billy crater below, are telescopic landmarks of the southwest extremes of Oceanus Procellarum. Data from the Diviner instrument on board LRO, analyzed at Stony Brook University & UCLA, identified the southeast and southwest points of this feature among the surprisingly few silicate signatures found on the Moon. The LROC Wide Angle Camera swept up this 50 km-wide scene over the course of LRO orbits 2496 & 2497 on January 11, 2010. The mosaic was processed using Ron Evans' WAC Previewer [NASA/GSFC/Arizona State University].

Rachel Kaufman
National Geographic

If the moon were actually made of cheese, there'd be a new flavor of dairy for humans to sample.

Data from NASA's Lunar Reconnaissance Orbiter (LRO) have revealed a new type of rock on the lunar surface—which scientists say was spat up by a style of volcano never before seen on the moon.

Until now, scientists had believed the moon was made of two basic types of rock: dark basalt and light, calcium-rich feldspar. Both would have come from volcanoes spewing relatively runny basaltic lava.

But the new volcano type oozed thicker lava rich in silica over a light, arrowhead-shaped patch of the moon roughly 18 miles (30 kilometers) across, called Hansteen Alpha, the scientists say.

Read the full article, HERE.


The mosaic of LROC WAC observations M117819862 & M117826631 overlaid on the Google Earth lunar digital elevation model allows for a simulated view of the bright, low-profile landmark, from high over Billy crater.

Thursday, September 16, 2010

LRO's LOLA reveals distinct populations in bombardment record and Diviner finds "no pristine lunar mantle," even within SPA


Reduced laser altimetry data from the LOLA instrument on-board the Lunar Reconnaissance Orbiter is presented in this topographic map of Mare Orientale, straddling the western limb and marking the border between the Moon's near and far side hemispheres. New studies using these data show the relatively late, dramatic Orientale "basin-forming impact" may have marked a more definitive change in the history of Earth-Moon bombardment than previously understood [NASA/GSFC/LOLA/Brown University].

LRO project management announced Thursday an investigation using data from the Lunar Reconnaissance Orbiter (LRO) laser altimeter (LOLA) have created the first-ever comprehensive catalog of large craters on the moon. One immediate result is the discovery of distinct periods and populations in the Moon's bombardment record.

Data from the LRO Diviner instrument used in two studies has uncovered a richer complexity to in the anorthosite-rich lunar highlands and, more surprisingly, no evidence of materials composed of the pristine lunar mantle Diviner was partly designed to detect.

The history of the Moon is also the history of Earth.

In a new study, Dr. James Head of Brown University describes results obtained from a detailed global topographic map of the moon created LOLA data.

"Our new LRO LOLA dataset shows the older highland impactor population can be clearly distinguished from a younger population in giant impact basins, inundated with solidified lava flows," Head writes. "The highlands have a greater density of large craters compared to smaller ones, implying that the earlier population of impactors had a proportionally greater number of large fragments than the population that characterizes the more recent lunar history."

The Moon, Mars, and Mercury all bear scars of ancient bombardment, impact craters hundreds or even thousands of kilometers across. Earth must have been subjected to this same assault as well.

Large impacts that occurred long after the advent of life on Earth appear to have resulted in Great Extinctions. The partially buried crater at Chicxulub, in the Yucatan, is from a 65 million years old impact widely believed to have led or contributed to the end of Age of Dinosaurs (and many other lifeforms, as well).

Scientists trying to reconstruct the bombardment history on Earth face difficulties because impact craters are relatively swiftly eroded by wind and water, or destroyed by plate tectonics. A rich record, however, is well-preserved on the Moon. The only source of significant erosion comes from other impacts, small and steady or large and less frequent.

"The moon is a Rosetta Stone for understanding the bombardment history of Earth," said Head. "Like Egypt's Rosetta Stone, the lunar record can be used to translate the hieroglyphics of a poorly preserved impact record on Earth."

Head and his team used the LOLA instrument on-board LRO to build a map highlighting lunar craters with unprecedented clarity.

LOLA sends laser pulses to the lunar surface, measures the interval needed for these pulses to reflect back to the spacecraft and then, with a very precise knowledge of the LRO's orbit, convert these data into increasingly more detailed topographic maps of the Moon, said Head.

Objects hitting the moon can be categorized into distinct populations. Each population has its own characteristics. Head also used LOLA maps to determine the times when these populations changed.

"Using the crater counts from within the basalt-inundated impact basins, the familiar "seas" of the Moon's near side, for example, and examining populations superposed upon older craters, we can date these transitions. The LRO LOLA impact crater database shows a transition occurred about the time of the Orientale impact basin forming event, about 3.8 billion years ago.

"The implication is this change in populations occurred around the same time as the large impact basins stopped forming, and this raises questions of whether or not these factors are related. The answers has implications for the earliest history of the inner solar system, including Earth," said Head.


Map showing locations (in purple) of anorthositic crust exhibiting compositional anomalies. The iron and magnesium-rich maria appear red while calcium-rich highlands appear blue green. The five anomalous silicic features are labeled. Full size figure 11, HERE. (Read the Diviner news release HERE) [Science].


In two other studies, researchers describe how data from the Diviner Lunar Radiometer Experiment instrument (Diviner) on LRO are showing that the geologic processes that forged the lunar surface were complex, also. Data revealed previously unseen compositional differences in the crustal highlands, and these have confirmed a presence of an anomalously silica-rich material in five distinct regions.

Every mineral, and therefore every rock, absorbs and emits energy with a unique spectral signature that can be measured to reveal its identity and formation mechanisms. For the first time LRO's Diviner instrument is providing scientists with global, high-resolution infrared maps of the moon, enabling the definitive identification of silicate minerals in the Moon's crust.

"Diviner is literally viewing the moon in a whole new light," said Benjamin Greenhagen of NASA’s Jet Propulsion Laboratory, and lead author of one of the Diviner papers.

Lunar geology can be roughly broken down into two categories – the anorthositic highlands, rich in calcium and aluminum, and basaltic maria, abundant in iron and magnesium. Both of these crustal rock types are deemed by geologists as 'primitive,' i.e., the direct result of crystallization from lunar mantle material, a partially molten layer beneath the crust.

Diviner observations have confirmed most lunar terrains have spectral signatures consistent with compositions that fall into these two broad categories, but also reveal the lunar highlands are far less homogeneous than previously believed.

In a wide range of terrains, Diviner reveals a presence of fine lunar surface material with compositions more sodium rich than typical anorthosite crust. The widespread nature of these "fines" hint there may have been variations in the chemistry and cooling rate of the "magma ocean" which is now thought to have formed the earliest lunar crust, or these could be the result of a secondary processing of the earliest lunar crust.

Most impressively, in several locations around the moon Diviner detects a presence of highly silicic minerals, like quartz, potassium-rich and sodium-rich feldspar - minerals only associated with highly evolved lithologies, rocks that have undergone extensive molten processing.

Detection of silicic minerals at certain locations is significant because these occur in areas previously shown to exhibit unusually high abundances of the element thorium, yet another proxy for highly evolved lithologies.

"The silicic features we've found on the moon are fundamentally different from the more typical basaltic mare and anorthositic highlands," said Timothy Glotch, assistant professor of geosciences at Stony Brook University in New York, and lead author of a second Diviner Science paper. "The fact that we see this composition in multiple geologic settings suggests that there may have been multiple processes producing these rocks."

Read "New types of rock found on Moon by researchers at Stony Brook," HERE.

No evidence for pristine lunar mantle material


Using data from the Diviner Lunar Radiometer, an instrument uniquely capable of identifying common lunar silicate minerals, scientists at Stony Brook University in New York and NASA’s Jet Propulsion Laboratory have found previously unseen compositional differences in the crustal highlands of the Moon, and have confirmed the presence of anomalously silica-rich material in five distinct regions. Diviner data superimposed on a Lunar Orbiter IV mosaic of Aristarchus crater. Red and orange colors indicate silicic compositions [NASA/GSFC/UCLA/Stony Brook].

One thing not apparent in the data is evidence for pristine lunar mantle material, which previous studies have suggested may be exposed at some places on the lunar surface. Such material, rich in iron and magnesium, would be readily detected by Diviner.

Even in the South Pole Aitken basin (SPA), the largest, oldest, and deepest impact crater yet to be identified on the moon, deep enough to have penetrated through the crust and into the mantle, presented no evidence of pristine mantle material.

It's reported likely if the impact that formed SPA or Apollo basins did excavate any mantle material, it has since mixed with crustal material from later impacts, inside and outside the 2100 km-wide SPA impact.

"The new Diviner data will help in selecting the appropriate landing sites for potential future robotic missions to return samples from SPA. We want to use these samples to date the SPA-forming impact and potentially study the lunar mantle, so it's important to use Diviner data to identify areas with minimal mixing," says Greenhagen.

Monday, July 26, 2010

LRO's Diviner continues to map lunar terrain


Thermal data gathered during repeated orbital passes using LRO's Diviner shows the range of materials of similar composition in and around 109 million year-old Tycho, putting the familiar crater in a new light, including the distinctive twin ray trails [NASA/GSFC/UCLA/UW].

Eric Hand
Nature: The Great Beyond

Scientists are using temperature measurements to map the rockiest parts of the Moon – and the results could help NASA choose better landing sites for missions.

Infrared radiation readings taken by the Diviner Lunar Radiometer Experiment, an instrument on NASA’s Lunar Reconnaissance Orbiter (LRO) mission, have enabled researchers to see the moon’s temperature variations in detail. Not surprisingly, the surface heats up during the day and cools down at night. But rocks tend to retain their heat longer than the regolith, or lunar soil, and so they stay warm throughout the night.

Mapping these hot spots has provided a quick and quantitative way to assess rock abundance over vast areas of the Moon, says planetary scientist Josh Bandfield of the University of Washington in Seattle, who presented his results on Thursday at the Third Annual NASA Lunar Science Forum, held at NASA Ames Research Center at Moffett Field, California.

Because rocks get worn away over time, older craters tend to be less rocky. But a young crater like Tycho “just lights up” on the rock abundance map, says Bandfield (see image).

The Diviner team has also mapped spots that are cold enough to retain water ice. Around the Moon’s south pole, the surfaces of crater floors fulfill this criteria – but there are even larger surrounding areas where water ice would be stable below the surface, said planetary scientist David Paige of the University of California, Los Angeles at the forum. These regions might warm up during the hottest part of the year, but the subsurface would stay cool enough to preserve water ice for billions of years, he said.

Monday, March 8, 2010

How "cold" is "cold?"


Twenty kilometer Hermite crater straddles the border separating the Moon's near and far side. The permanently shadowed southern interior lobes of the crater (blue arrows) host the Moon's coldest known temperatures, and at 25° K, it is "cold" as cold as any place known to exist in the solar system. From high-resolution temperature maps of the Moon's polar regions produced from data collected during the commissioning phase of the Diviner experiment on-board NASA's Lunar Reconnaissance Orbiter [NASA/JPL].

Dr. Wendell W. Mendell
NASA JSC

Almost five decades ago Watson, et al, (1961) speculated that molecules of volatile species might accumulate within the cryogenic environments of permanently shadowed polar craters. The subject was largely a scientific curiosity until recently. In the mid-1980's, people began to seriously discuss the feasibility of long-term or permanent human settlement of the Moon. Given that the Moon was known be missing the compounds need to support life and that importing volatiles from Earth is prohibitively expensive, lunar colonists were pictured as processing the putative polar volatiles. A bistatic radar experiment performed with the Clementine spacecraft was interpreted to suggest the presence of large quantities of ice at some polar locations.

The neutron spectrometer aboard the Lunar Prospector (1998) spacecraft reported high concentrations of hydrogen in the polar regolith, and some interpretations of the data set pointed to very high concentrations in permanently shadowed craters. The reformulation of civilian space policy in 2004, known as the Vision for Space Exploration, emphasized lunar exploration with eye toward development of economic returns from cislunar space and long-tern human presence on the Moon. The theme of finding lunar resources was an impetus for the inclusion of the Diviner Lunar Radiometer Experiment on the Lunar Reconnaissance Orbiter.

Preliminary results from Diviner report an unexpectedly low temperature down to 35K in the depths of some craters.

Read the Paper, HERE.

Wednesday, December 16, 2009

Coldest Spot on the Moon


Hermite is foreground for an Earthrise in 2007, witnessed by Japan's Kaguya. Hugging the west side of the Moon's north polar region Hermite is within the Zone of Librations. Though two-thirds of its 114 km-wide interior is technically on the Moon's Far Side it can still be seen from Earth. Not along its southwestern interior, however, in perpetual shadow and where LRO's Diviner has measured the Moon's coldest surface temperatures, temperatures as cold as any now known this side of the Kuiper Belt [JAXA/NHK/SELENE].

Diviner News - The Diviner lunar radiometer has been mapping the temperature of the Moon since July, 2009. During this period, temperatures in the lunar polar regions have changed gradually as the lunar seasons have evolved. The tilt of the moon’s spin axis is only 1.54 degrees and as a consequence, lunar seasons are barely noticeable in most locations on the Moon. However, at the north and south poles, the height of the sun above the horizon varies by more than 3 degrees over the course of the year. This affects the percentage of sunlit regions and surface temperatures at the poles.

During October, 2009, Diviner observed the passage of summer solstice in the southern hemisphere and winter solstice in the northern hemisphere. The LRO launch date was chosen so that its orbital plane passed through the noon to midnight plane in October, allowing Diviner to measure the extremes of polar temperatures. Figure 1 illustrates the configuration of the LRO orbit and the lunar seasons.


Figure 1.
The configuration of the LRO orbit during October 2009 allowed Diviner to measure maximum temperatures near summer solstice in the south polar region, and minimum temperatures near winter solstice in the north polar region. (NASA/GSFC/UCLA)


Figure 2. (BELOW) shows a Diviner Channel 8 thermal image of the south polar region acquired between October 3-30, 2009. The mapping period overlaps with the LCROSS impact on October 9, 2009. Figure 3 shows an annotated version of the image, including the location of the LCROSS impact. The rugged south polar topography makes it one of the most picturesque regions on the planet. Diviner’s thermal measurements allow us to “see” both the warm sunlit and cold shadowed regions in striking clarity and detail. Even at their warmest, the permanently shadowed areas in the south polar region are extremely cold. The coldest areas are located in doubly shadowed regions inside small craters that themselves lie within the permanently shadowed regions of larger craters. Diviner measured minimum channel 9 brightness temperatures as low as 35K (-238C or -397F) in these areas, even at noon on the warmest day of the year.


Read the Diviner News Release HERE.


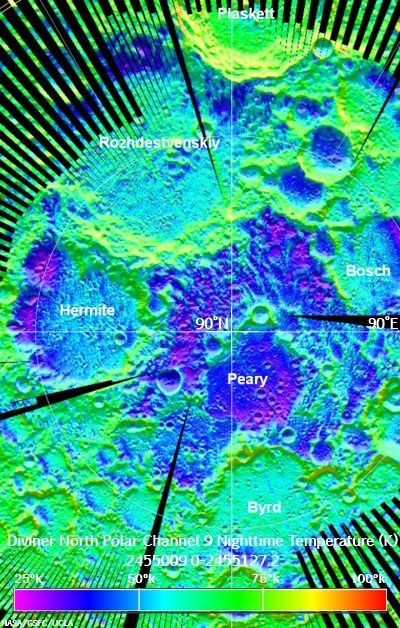
On the opposite side of the planet, Diviner mapped the north polar region at winter solstice. Figure 4 from Diviner's news release (December 15, 2009) shows a nighttime false-color channel 9 map of the region that reveals the presence of areas with temperatures as low as 25K (-258C or -415F). The coldest spot on the Moon that Diviner has detected thus far is located on the south western edge of the floor of Hermite Crater. There are also regions on the southern edges of the floors of Peary and Bosch Craters that are almost as cold. To put these cold temperatures in perspective, one would have to travel to a distance well beyond the Kuiper belt to find objects with surfaces this cold. Diviner measures the temperature of the top millimeter of the lunar surface. We would expect temperatures below the surface to be warmer due to heat retention from the spring and summer seasons.

Friday, December 4, 2009

LRO DIVINER LPSC Symposium, February 2010


It's beginning to look like the 41st Annual Lunar and Planetary Science Conference at The Woodlands in Texas, March 1-5, 2010, will be among the very best places to get any advance view of the long-on-promise data from the Lunar Reconnaissance Orbiter and its seven experiments now in lunar orbit.

The Lunar Reconnaissance Orbiter (LRO) Diviner instrument team will host a symposium on the Sunday afternoon before the LPSC to acquaint the Planetary Science community with the Diviner experiment, its dataset and scientific findings to date.

The meeting will be held in the Montgomery Ballroom of the the Woodlands Waterway Marriott Hotel and Conference Center in Houston, TX - the same hotel hosting the LPSC 2010 meeting, and the Brown-Vernadsky Microsymposium entitled “Compositional Structure of the Lunar Crust: The New View from the Moon” (http://www.planetary.brown.edu/html_pages/micro51.htm).

The Diviner symposium will directly follow the Brown-Vernadsky Microsymposium, scheduled for all day Saturday, February 27 and again on Sunday morning, February 28.

A detailed agenda for the Diviner Symposium will be posted in advance of the meeting on the LRO Diviner instrument site.