Friday, November 12, 2010

The Central Peak of Kepler


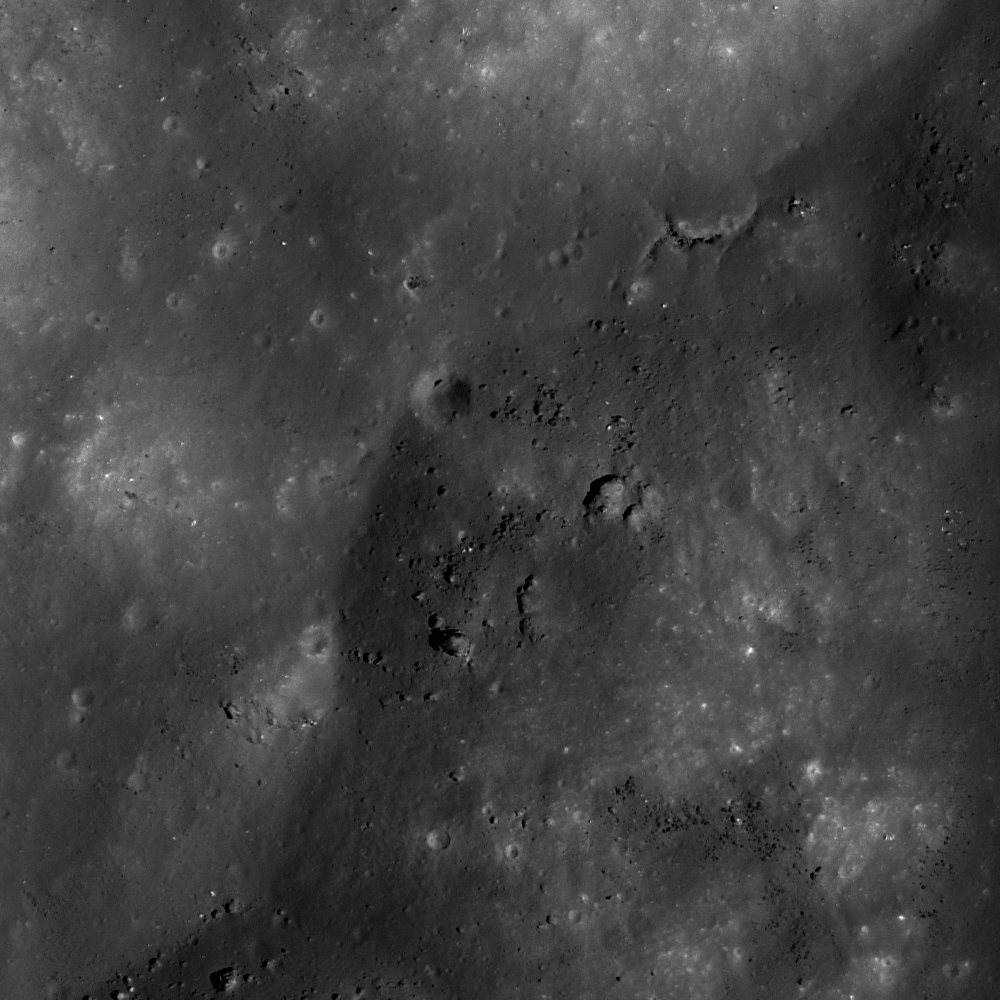
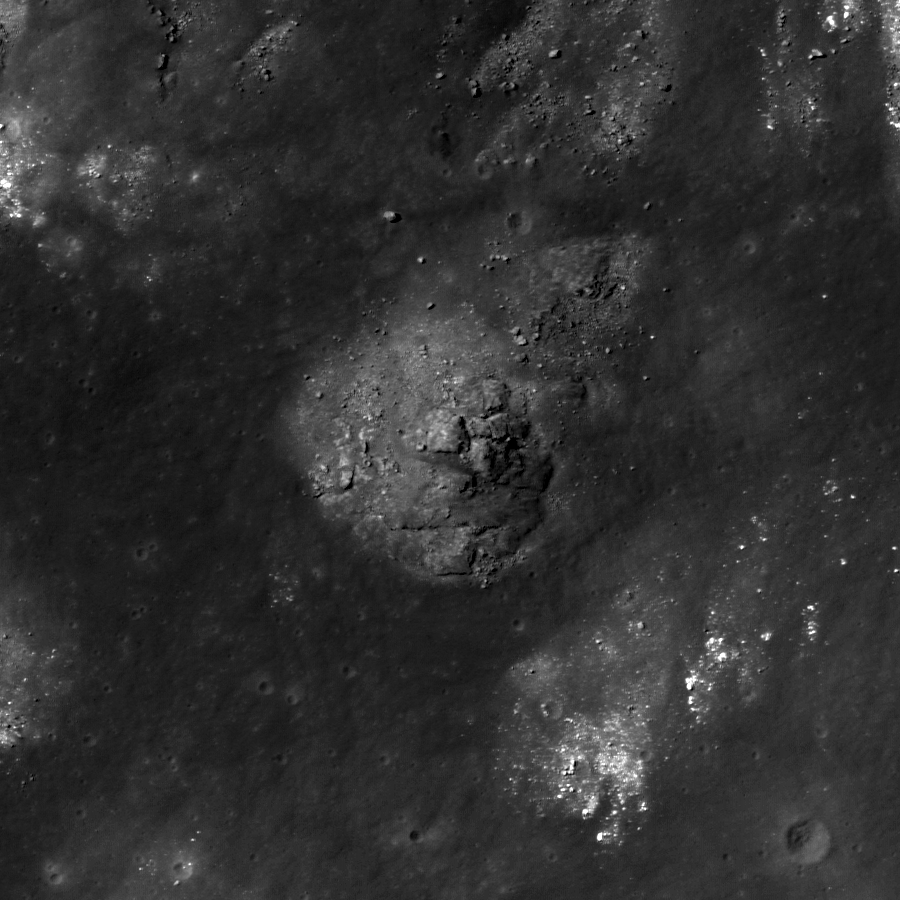
Boulders and simple craters perched on top of Kepler crater's central peak. LROC Narrow Angle Camera (NAC) observation M111843702R, LRO orbit 1616, November 2, 2009; field of view (below and HERE) is 500 meters [NASA/GSFC/Arizona State University].


Drew Enns
LROC News Service

There are two basic types of impact craters: simple and complex. Simple craters form a bowl-like rimmed depression, and complex craters (such as Kepler) display central peaks, terraces, and flat floors. Complex craters occur above a certain diameter crater, the cutoff diameter is dependent on gravity, so it varies from planet to planet (or moon to moon). On the Moon the size cutoff between simple and complex craters is between 10 and 20 km, on the Earth it is between 2 and 5 km.


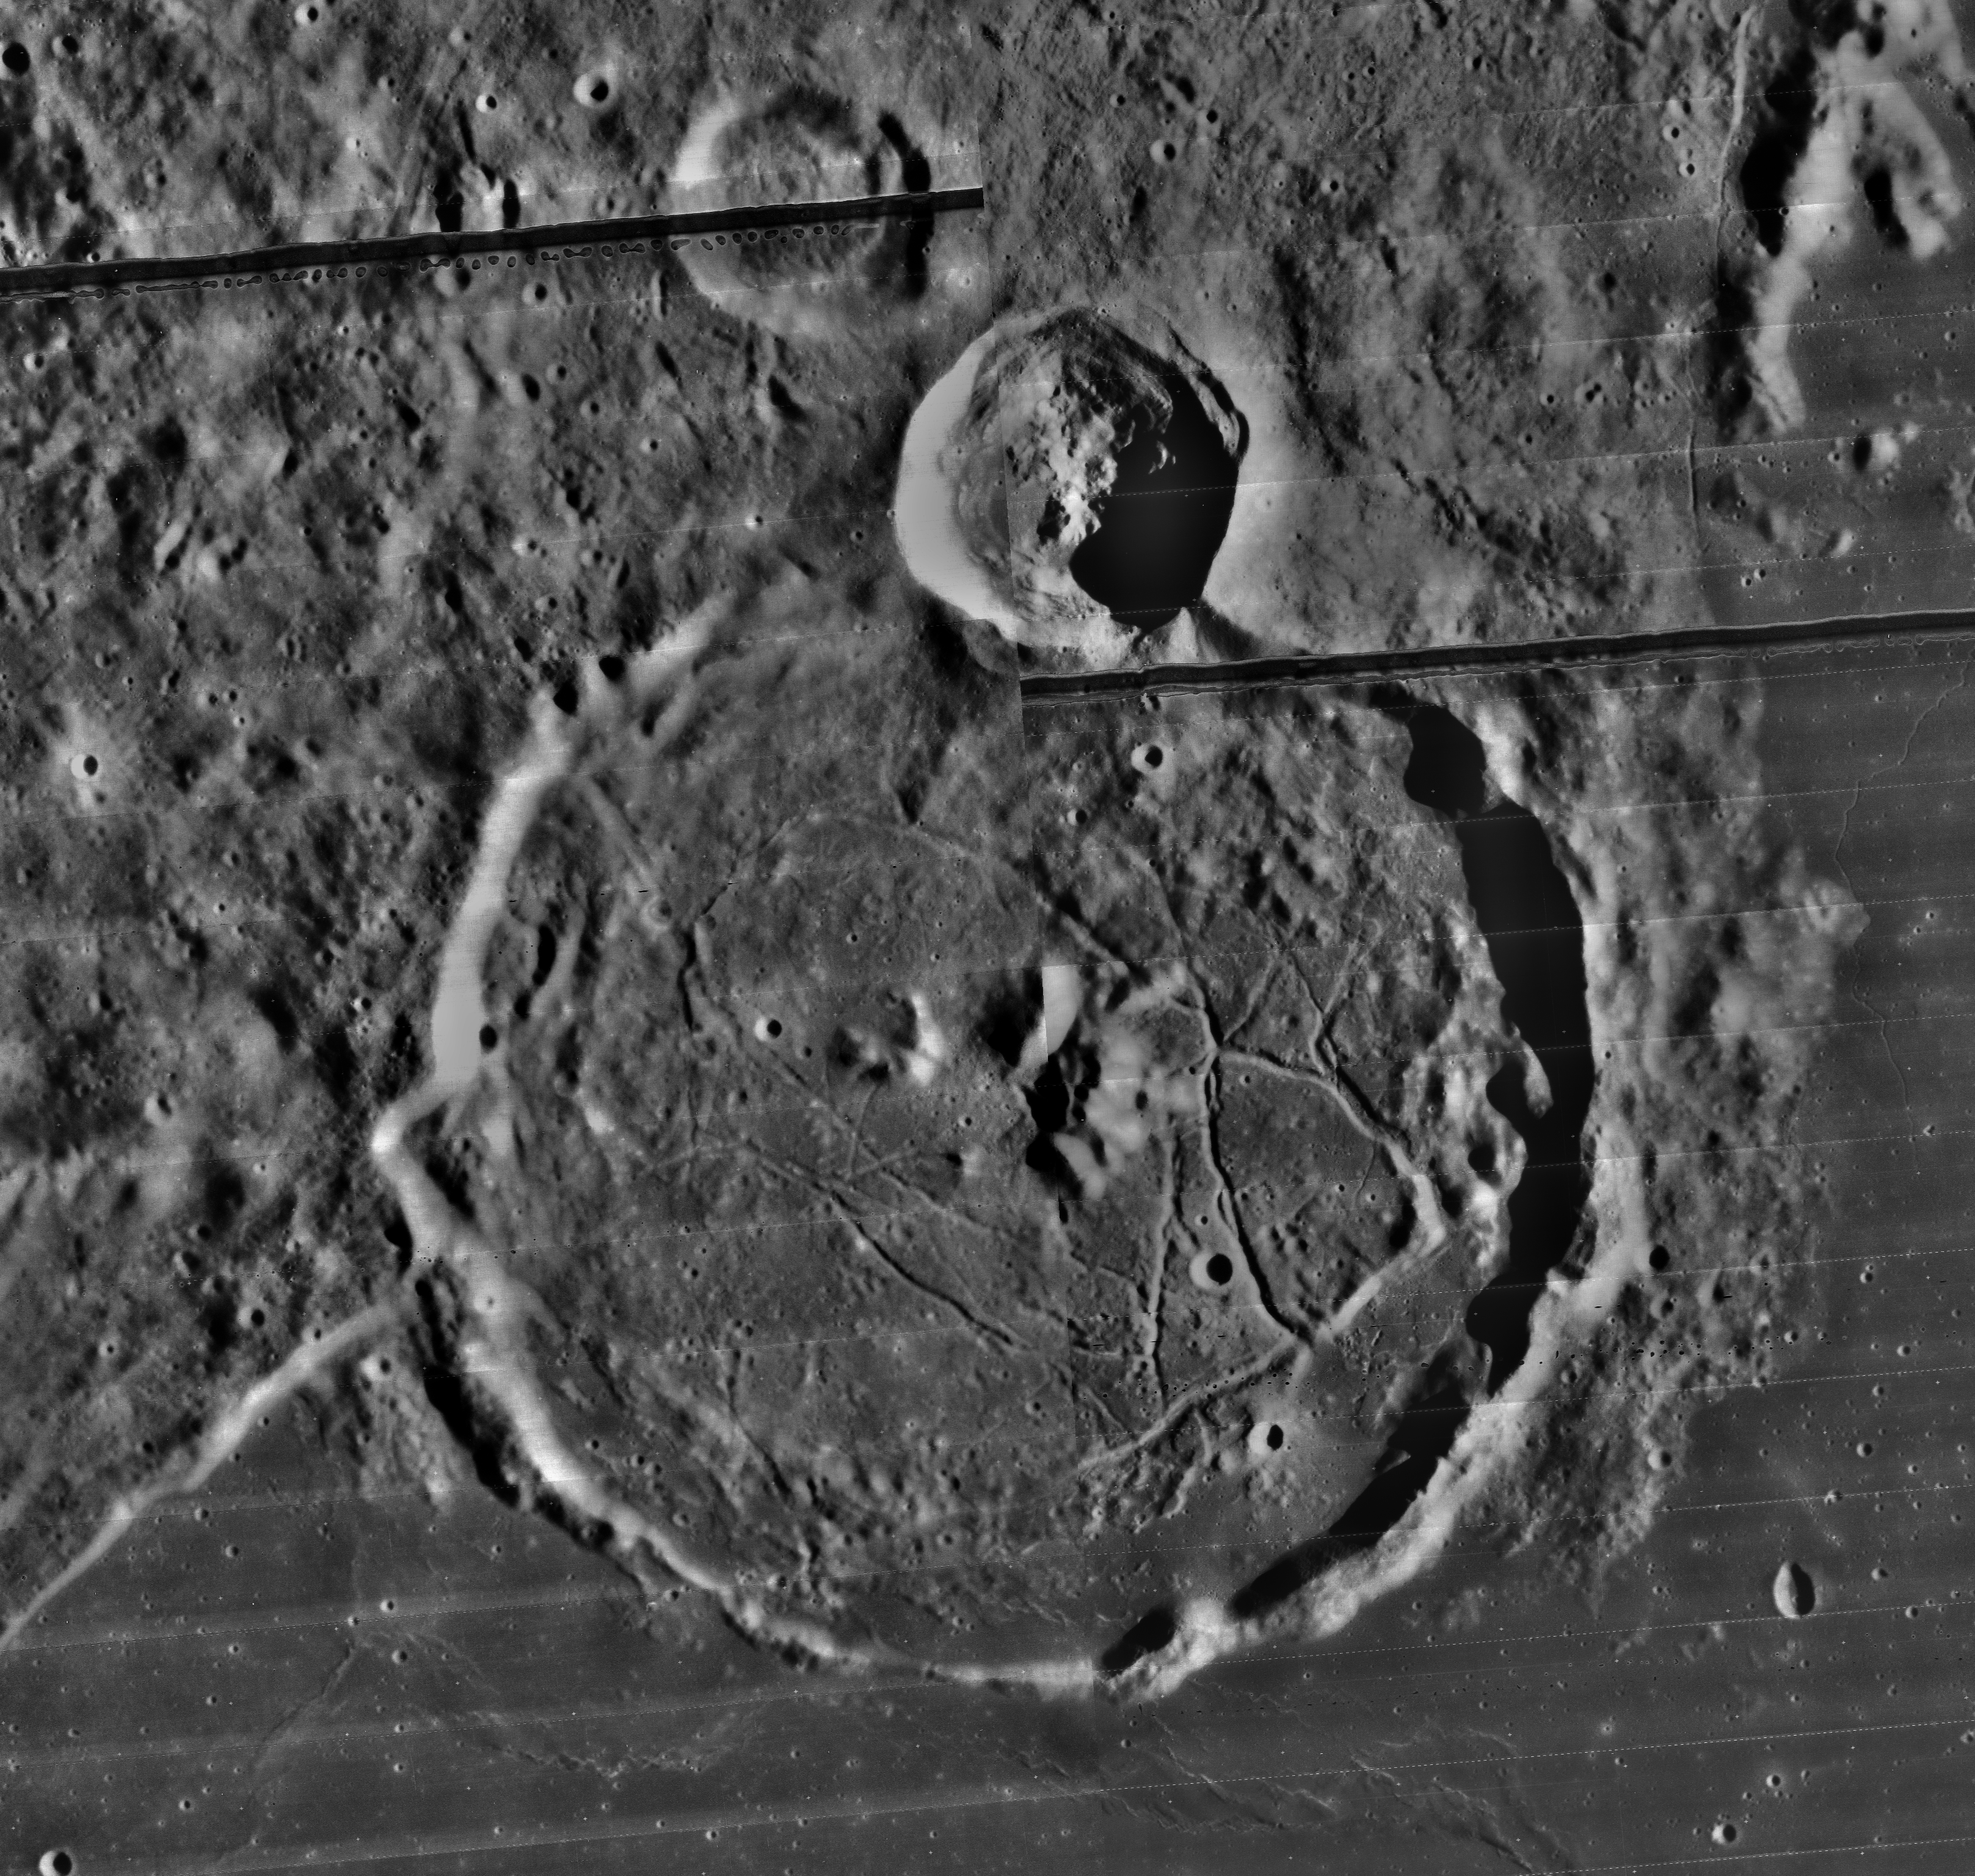
A full-sized segment of an Apollo 12 orbital shot featured in previous postings from Drew Enns discussing Kepler. From this foreshortened angle (see context below) it's easier to see the minimal central peak does not exceed the crater's rim in elevation [NASA/LPI].


An LROC Wide Angle Camera mosaic of Kepler with an arrow indicating the location of featured NAC image above can be viewed HERE.

Despite the label "central peak," a central peak is not always exactly in the center of a crater, nor is it always symmetrically shaped; Kepler crater is an example. Instead of having a nice central peak, Kepler crater has an irregular off-center peak. This form is most likely due to the crater being close to the boundary diameter between a simple and complex crater. Larger craters, such as King crater, can also display oddly shaped central peaks that are likely the result of an oblique impact.
Link
Browse the whole NAC image of Kepler crater and inspect the landforms associated with its central peak. Can you find evidence of impact melt on the central peak, terraces, and floor?

Related Posts:
Concentric crater
Kepler Crater Ejecta
Kepler's Rim

Wednesday, November 10, 2010

Kepler's Rim


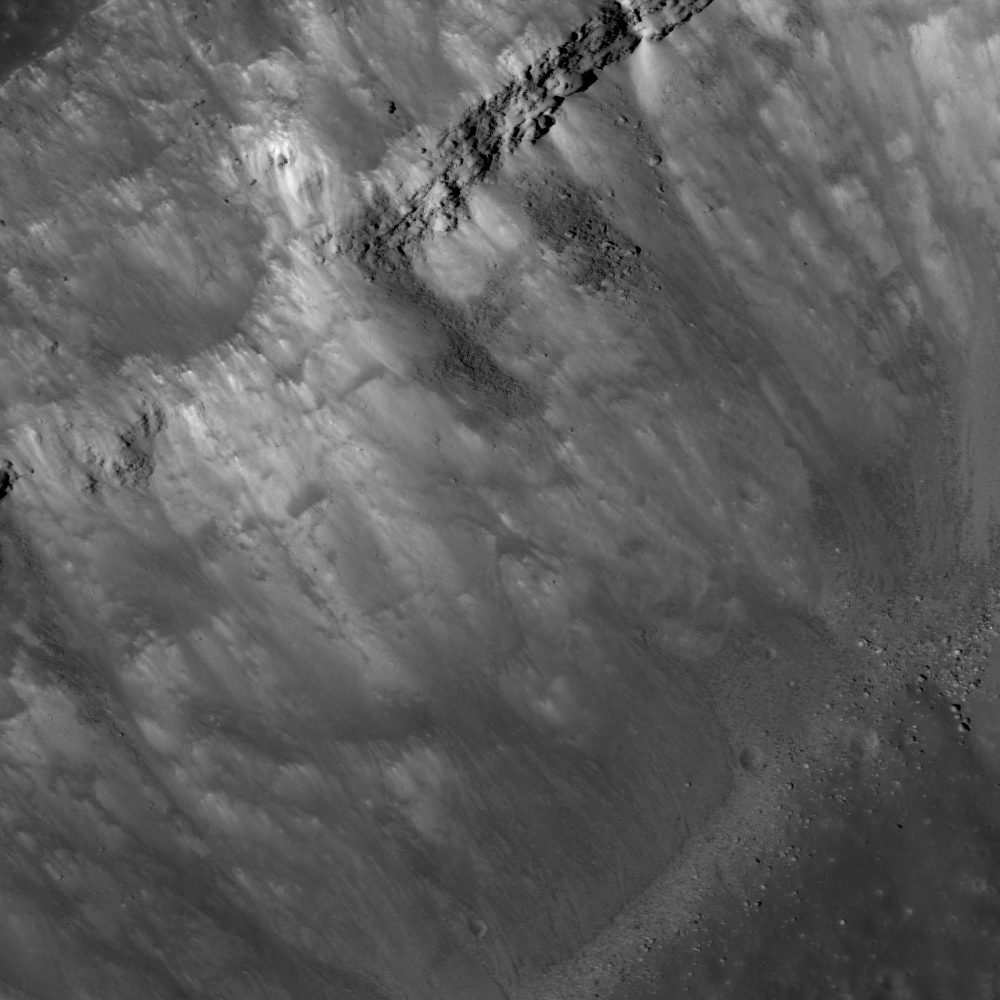
Steep interior wall of Kepler, the crater's northwest rim is to the upper left and interior toward the lower right. Note the exposed layering near the top and boulders collecting at the base of the crater wall. From LROC Narrow Angle Camera observation M107128381R, LRO orbit 926, September 9, 2009; field of view is ~ 800 meters [NASA/GSFC/Arizona State University].

Drew Enns
LROC News System

Landslides are primarily caused by gravity pulling loose material down a slope. Numerous factors contribute to landslides on Earth, including water and vegetation, but these can be ignored for the Moon. However, both bodies are affected by the angle of repose which is related to the cohesiveness of the material making up the slope. Once the angle of repose is exceeded the loose material on the slope slides downhill. Since the exposed bedrock layer near the top of the wall is more cohesive it stays intact while loose rocks and dust slide from underneath. As the wall material continues to slide down, more of the resistant layer will be exposed until it is undermined and is pulled down by gravity. The boulders at the base of the landslides are probably pieces of the bedrock layer.


The range of two LROC NAC observations from early November 2010, from which consecutive Featured Images were derived are seen draped over the Google Earth lunar digital elevation model of Kepler's interior, once again suggesting the vast improvements in resolution since the base albedo map from the Clementine (1994) mission was gathered [NASA/GSFC/Arizona State University].

Explore the rest of Kepler's rim in the NAC image!

Related Posts:
Linné Crater
Kepler Crater Ejecta

Tuesday, November 9, 2010

Kepler Crater Ejecta


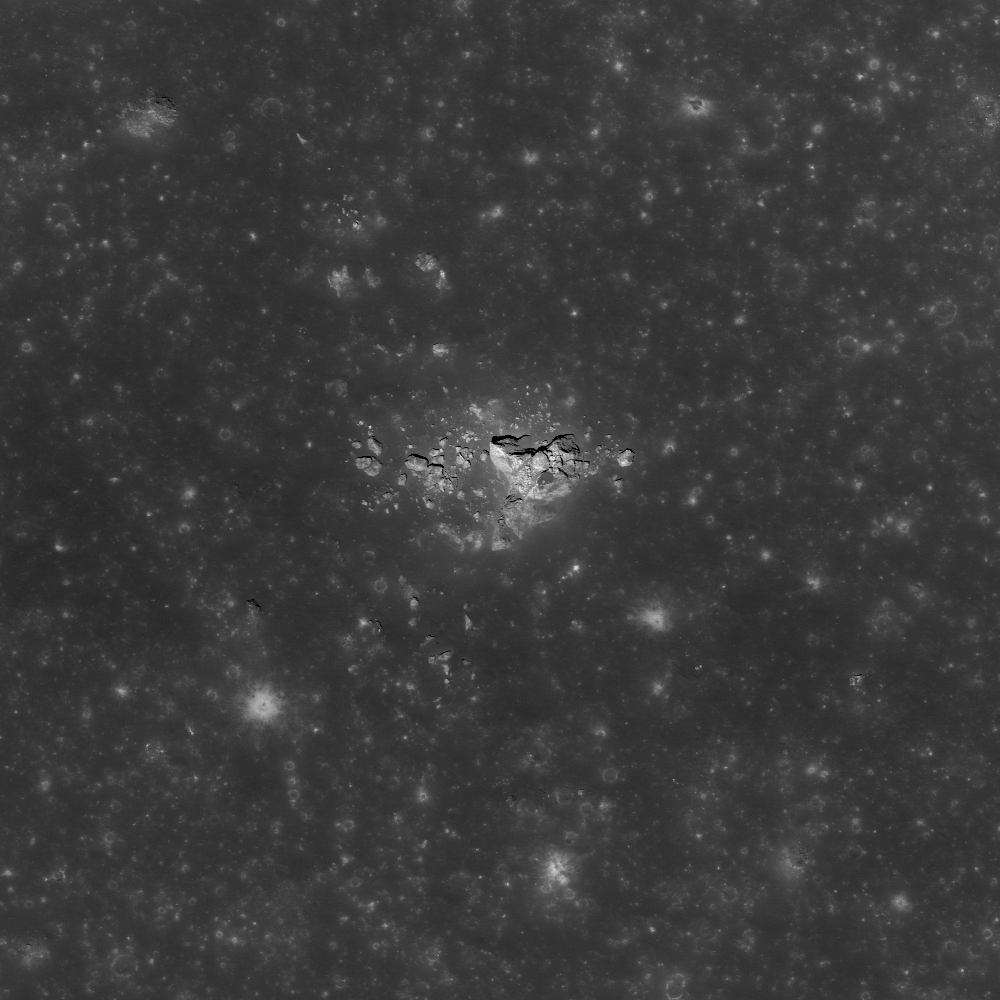
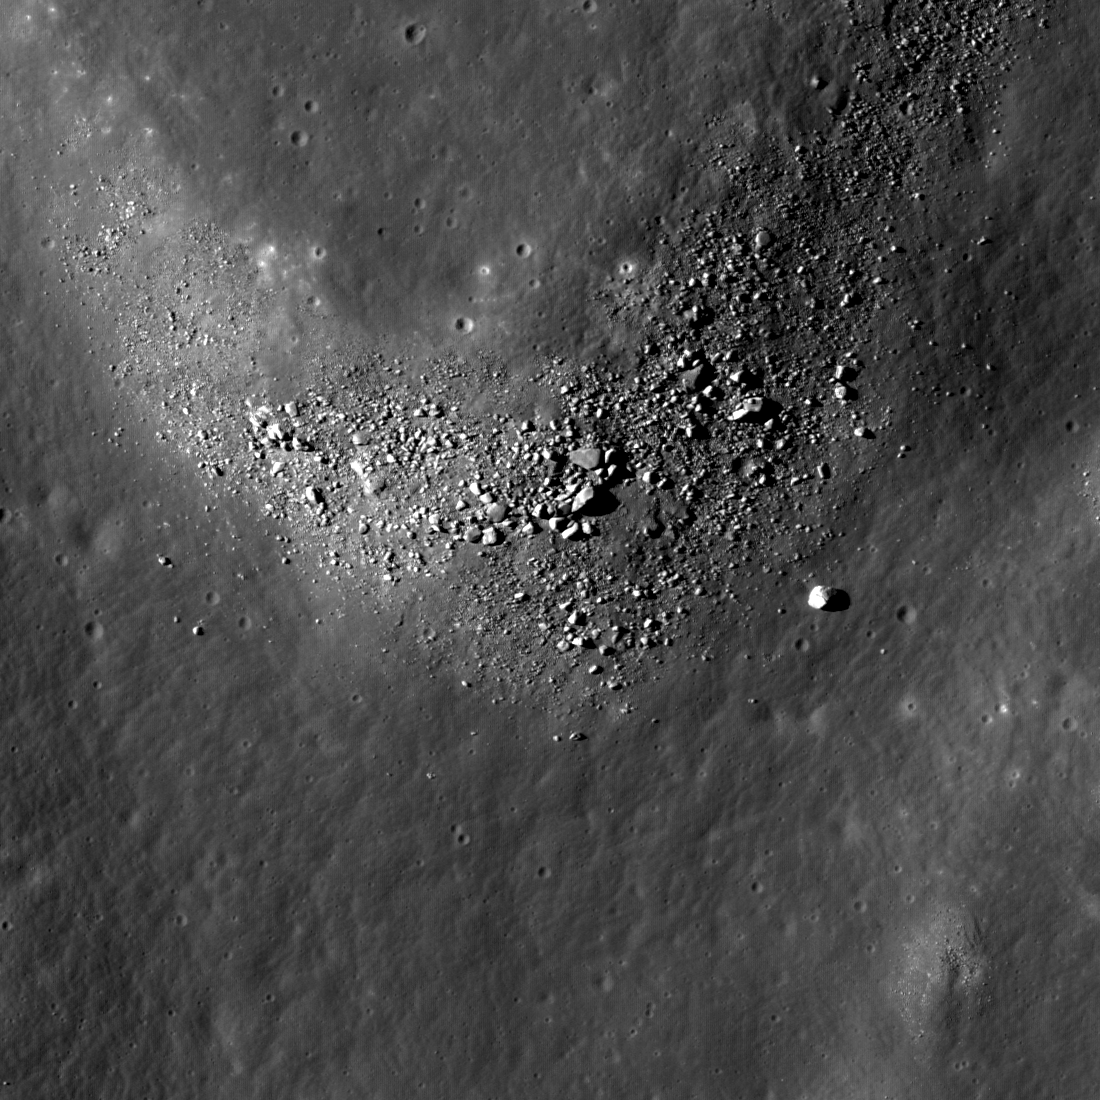
Large boulder ejected from Kepler crater, a small depression from the boulder's impact is just visible. LROC Narrow Angle Camera (NAC) observation M140155410L, LRO orbit 5788, September 26, 2010; above field of view is 320 meters, original LROC featured image (here) 800 meters [NASA/GFSC/Arizona State University].

Drew Enns
LROC News System

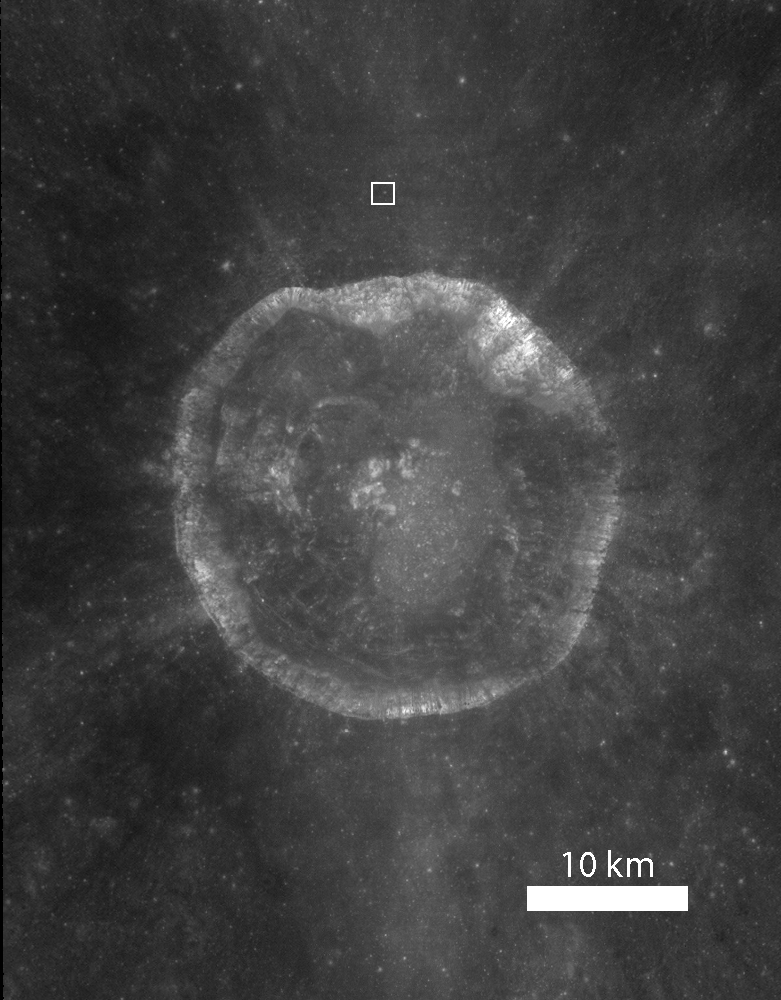
Kepler is a Copernican aged crater (32 km diameter, 8.1°N, 322.0°E) named for the German Astronomer Johannes Kepler, famous for his three laws of planetary motion. The impact event that created Kepler crater was energetic enough to eject this 100 m boulder out onto its continuous ejecta blanket. Impact events excavate material from great depth (approximately 1/3 the transient crater diameter) and distribute the material around the crater as ejecta. The material at the top of the impacted surface is ejected the furthest, while the deepest material has just enough energy to land on the crater rim. This distance to depth relation creates a natural core sample for astronauts to collect as they explore.


LROC Wide Angle Camera (WAC) context image of Kepler showing the location of the boulder field north of the crater on the downward slope of its ejecta blanket [NASA/GFSC/Arizona State University].


Kepler when the Moon is full, or how the optical immaturity of it's surroundings betray its relative youth in this spectacular photograph by P. Van de Haar of the Netherlands. This is how this familiar near side crater appears through modest telescopes at local "high noon."


In November 1969 the crew of Apollo 12 had a landing transfer orbit with a perilune further west than any other of the Apollo surface expeditions, and as such apparently captured the best images of Kepler prior to LRO, forty years later. The view of Kepler, 557 km northeast of the Apollo 12/Survey 3 landing site, had to have been captured late in the mission [NASA/LPI].


A center slice of a wider wallpaper-sized view of Kepler, looking south from a virtual vantage over the featured boulders, peeking over the north rim across Kepler to the south rim 40 km beyond [NASA/GSFC/Arizona State University/Google Earth].

The lunar mare were formed as old impact basins filled by massive eruptions of very fluid basalt. Its easy to measure the area of these mare basalts, but how thick are they? Are there multiple basalt flows that form the mare? If the mare is thin enough the Kepler impact may have excavated both mare and the underlying highland material. Samples from this boulder, and others like it out to the edge of ejecta could answer these questions. An astronaut would start sampling at the far edge of the ejecta blanket and work towards the rim. During this traverse the intrepid geologist would in effect be traveling down the inside of the crater, without doing all the work of climbing in and out! The last sample on the rim would be from near the bottom of the crater. With this suite of samples the history of the emplacement of the basalts at this spot could be unraveled.

Search for other ejecta boulders in the NAC image!

Related Posts:
Ejecta from Van de Graaf Crater

Friday, November 5, 2010

Gassendi A


Impact melt material inside the south rim of Gassendi A, which in turn intrudes into the northern rim of Gassendi. LROC Narrow Angle Camera observation M107136013L, LRO orbit 927, September 9, 2009; image field of view is 840 meters [NASA/GSFC/Arizona State University].


Unfortunately reduced Google Moon nest for the 100 meter/px monochromatic Wide Angle Camera mosaic of Gassendi and the draped extent of the NAC observation from which the featured image within Gassendi A was lifted, intruding into Gassendi's northern rim. The southern rim of the crater was partially flooded with lava during the formation of surrounding Mare Humorum [NASA/GSFC/Arizona State University].

Browse the full LROC NAC frame!

Related Posts:
Gassendi's Central Peak
Gassendi's Fractures

Thursday, November 4, 2010

Gassendi's Fractures


An intersection of two fractures in the crater Gassendi forms a rough "Y," with boulders concentrated on the northern wall. LROC Narrow Angle Camera observation M104770486L, LRO orbit 597, August 13, 2009. Image field of view is 946 meters, and the solar illumination incidence angle is 51 degrees [NASA/GSFC/Arizona State University].

Sarah Braden
LROC News System

The crater Gassendi is 110 kilometers in diameter and located on the northern edge of Mare Humorum at 17.5°S, 320.1°E. Gassendi features an array of intersecting fractures on its floor, collectively known as the Rimae Gassendi.


The LROC featured image nested within the boundaries of the full Narrow Angle Camera observation and the LROC Wide Angle Camera mosaic below. What seems relatively close by is Gassendi's northern rim, more than 40 kilometers away.

Some of the largest fractures are thousands of meters wide. The origin of these fractures in the floor of Gassendi is not known for certain. After the impact the floor of Gassendi was molten and as it cooled, a crust of solid material formed at the surface. As the entire crater floor continued to cool and settle into its final shape, fractures could have formed due to the forces caused by these changes. Other craters besides Gassendi also have fractured floors, like the craters Alphonsus or Goclenius. How do you think fractures form inside craters? What are the differences between each of these craters?


Meets and Bounds of the LROC NAC observation and location of the "Y" intersection in the featured image. The full WAC mosaic can be seen here [NASA/GSFC/Arizona State University].

Examine the fractures by viewing the full NAC frame!

Related Posts:
Gassendi's Central Peak
Alphonsus crater mantled floor fracture

Wednesday, November 3, 2010

Gassendi's Central Peak


Close up of a boulder (25 meters, or two school buses, wide) on the central peak of Gassendi. 180 meter-wide segment from LROC Narrow Angle Camera observation M109495053R, LRO orbit 1270, October 6, 2009 [NASA/GSFC/Arizona State University].

Sarah Braden
LROC News System

During the Apollo era, Gassendi (17.5°S. 320.1°E) was one of two primary landing site alternatives to the Apollo 17 site at Taurus-Littrow. The candidate location was south of the westernmost of Gassendi's central peaks. The main scientific motivation for a landing at the Gassendi site was the possibility of sampling ancient highland rocks in the crater's central peak. Sampling from the region would have also supplied ages for the Humorum basin impact and the Gassendi crater impact. However, engineering constraints kept Gassendi from becoming an Apollo landing site because it was uncertain if the terrain within Gassendi was too rough and dangerous for astronauts to successfully approach the central peak and obtain a sample.


LROC WAC 100 meter/per pixel monochrome mosaic of Gassendi [NASA/GSFC/Arizona State University].


For context, the meets and bounds of the full LROC NAC observation M109495053R set within the Wide-Angle Camera mosaic and the lunar digital elevation model available to users of the Google Earth application (>v.5).

The boulder in today's featured image is exactly what astronauts would want to sample. Since the boulder came from higher up on the peak, witnessed by a trail you can follow back up the peak, astronauts can use it as an opportunity to sample material from higher elevation parts of the peak without having to actually climb the peak! However, Apollo astronauts could not have known ahead of time where boulders like this one were located. The scientists and engineers of the Apollo program used Lunar Orbiter images, Apollo metrics, and Apollo mission photography to make educated decisions between various possibilities for landing sites and to decide where astronauts would travel on the surface. Lunar Orbiter images of Gassendi are lower in resolution (~ 60 m/px) compared to the LROC NAC image (0.5 m/px). Future lunar missions will benefit from LROC images which answer questions about surface roughness and where astronauts should go. For comparison to the NAC image, you can view the Lunar Orbiter image of Gassendi from 1960 below. What a difference new technology makes! The Lunar Orbiter image is provided courtesy of the United States Geological Survey Astrogeology Research Program's Lunar Orbiter Digitization Project.


Lunar Orbiter mosaic of Gassendi crater and the surrounding area. Resolution is about 60 meters [NASA].

Take a look at the central peaks of Gassendi in the full NAC image!

Related Posts:
Eratosthenes Central Peak
Up from the depths
Central Peak/Mare Boundary
Bhabha sinks into the shadows

Tuesday, November 2, 2010

Bowditch Lava Terraces


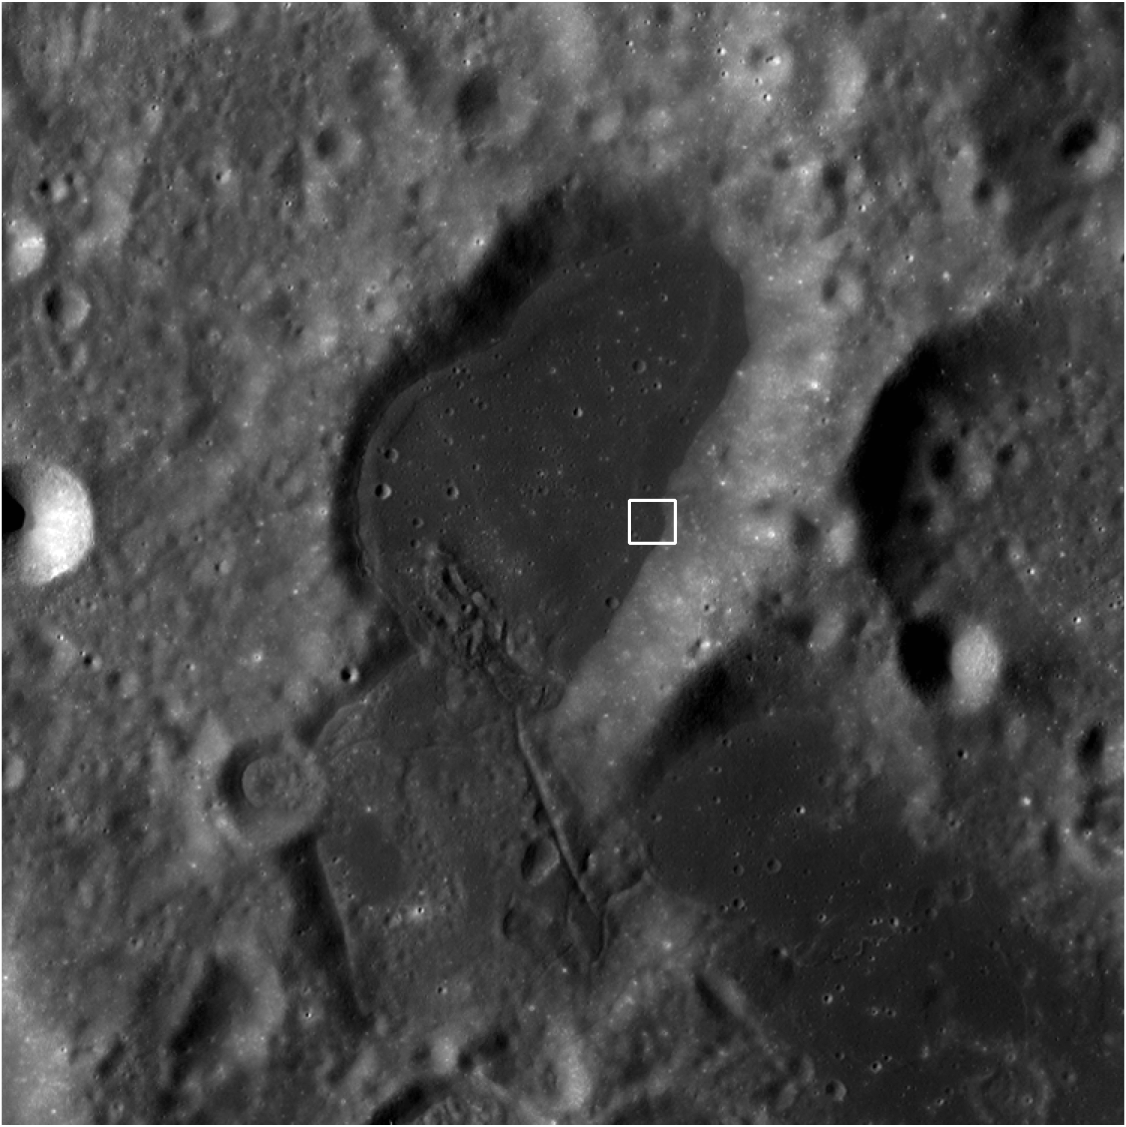
LROC Narrow-Angle Camera (NAC) view of a part of the lava terrace within the Bowditch formation. The wall of Bowditch is on the right and the terrace is located between the two dashed white lines. LROC NAC early Commission phase observation M101478053R, LRO orbit 176, July 9, 2009; field of view 2400 meters with a solar incidence angle of 86° [NASA/GSFC/Arizona State University].

Sarah Braden
LROC News System

Bowditch (25.0°S, 103.1°E) is an irregularly-shaped depression northwest of Lacus Solitudinis. Inside Bowditch is a "ring" that resembles a dirty bathtub. Much like water in a bathtub, this ring is a marker of the highest level of liquid lava within Bowditch. The Bowditch depression filled with lava like many craters on the Moon, and as the lava cooled and solidified, it subsided into the center of the depression. The ring is the remnant from this activity. NAC images give us further evidence of lava cooling, contraction, and subsidence in the mare. We do not know if drainage or contraction during cooling causes lava terraces like Bowditch, but these new images should provide us with more clues. Check out Apollo era images of the Bowditch feature at the Apollo Image of the Week site.


In this 100 meter pixel LROC WAC mosaic Bowditch is the irregularly-shaped mare-filled depression. The lava terraces are clearly visible all the way around the rim of Bowditch. The white box marks the area in the featured NAC image above [NASA/GSFC/Arizona State University].

View the full LROC NAC frame!


Deflecting the LROC Wide-Angle Camera mosaic with some degree of tri-dimensionality, the context for the close-up of the Bowditch "bathtub ring" seen fixed on the lunar digital elevation model available in the Google Earth application (>v.5).

Friday, October 29, 2010

Boulder trails in Menelaus crater


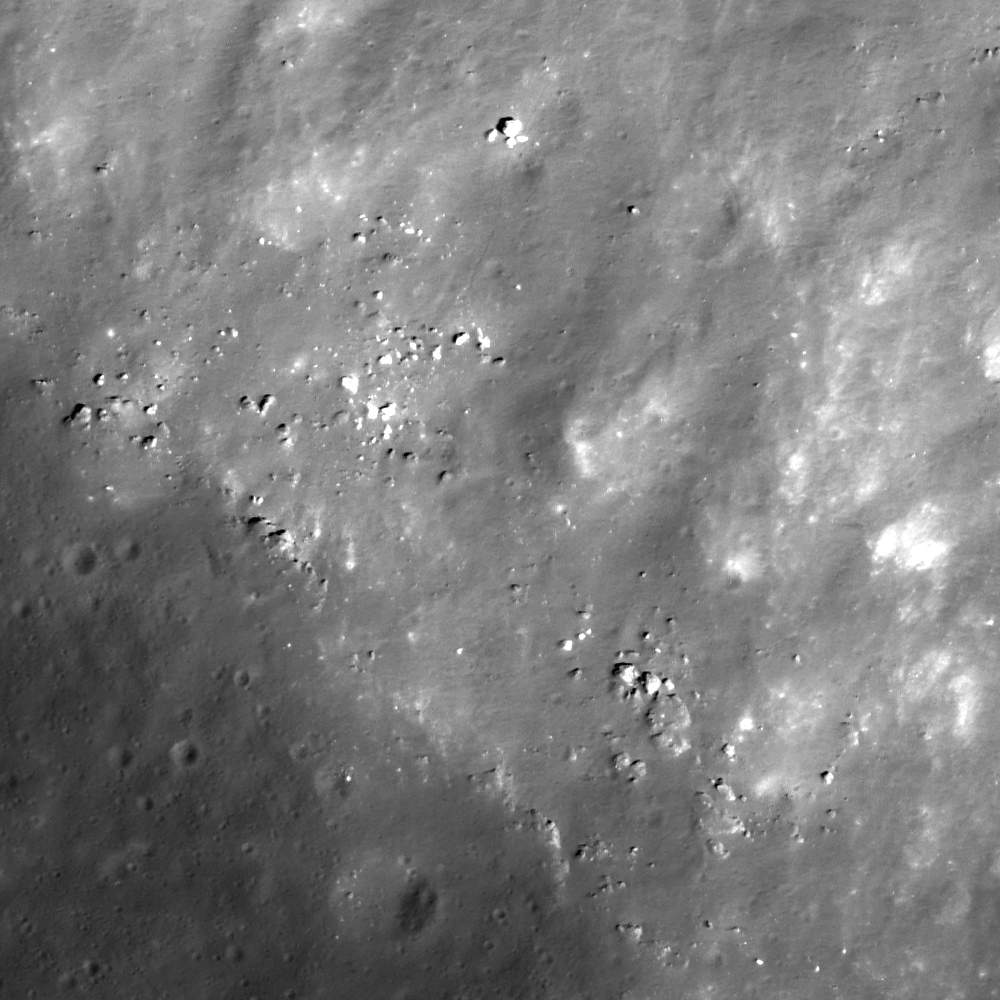
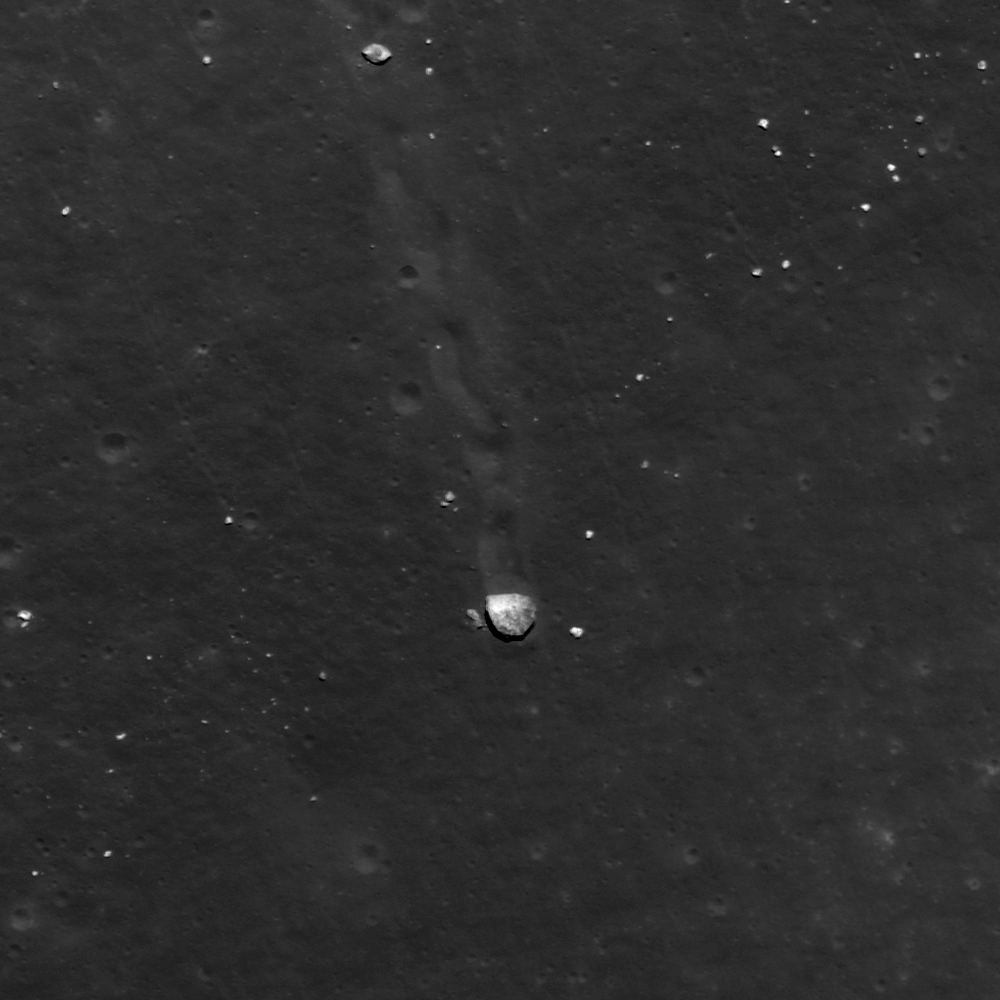
Boulder trails are common to the interior of Menelaus crater as materials erode from higher topography and roll toward the crater floor. Downhill is to the left, image height is 500 meters, from LROC Narrow Angle Camera observation M139802338L, LRO orbit 5736, October 9, 2010 [NASA/GSFC/Arizona State University].

Lillian Ostrach
LROC News System

Most boulder trails are relatively high reflectance, but running through this image is a lower reflectance trail. This trail is smaller than the others, and its features may be influenced by factors such as mass of the boulder, boulder speed as it traveled downhill, and elevation from which the boulder originated.

For example, is the boulder trail less distinct than the others because the boulder was smaller? What about the spacing of boulder tracks? The spacing of bounce-marks along boulder trails may say something about boulder mass and boulder speed. But why is this boulder trail low reflectance when all of the surrounding trails are higher reflectance? Perhaps this boulder trail is lower reflectance because the boulder gently bounced as it traveled downhill, and barely disturbed a thin layer of regolith? The contrast certainly appears similar to the astronauts' footprints and paths around the Apollo landing sites. Or, maybe the boulder fell apart during its downhill travel and the trail is simply made up of pieces of the boulder - we just don't know yet.


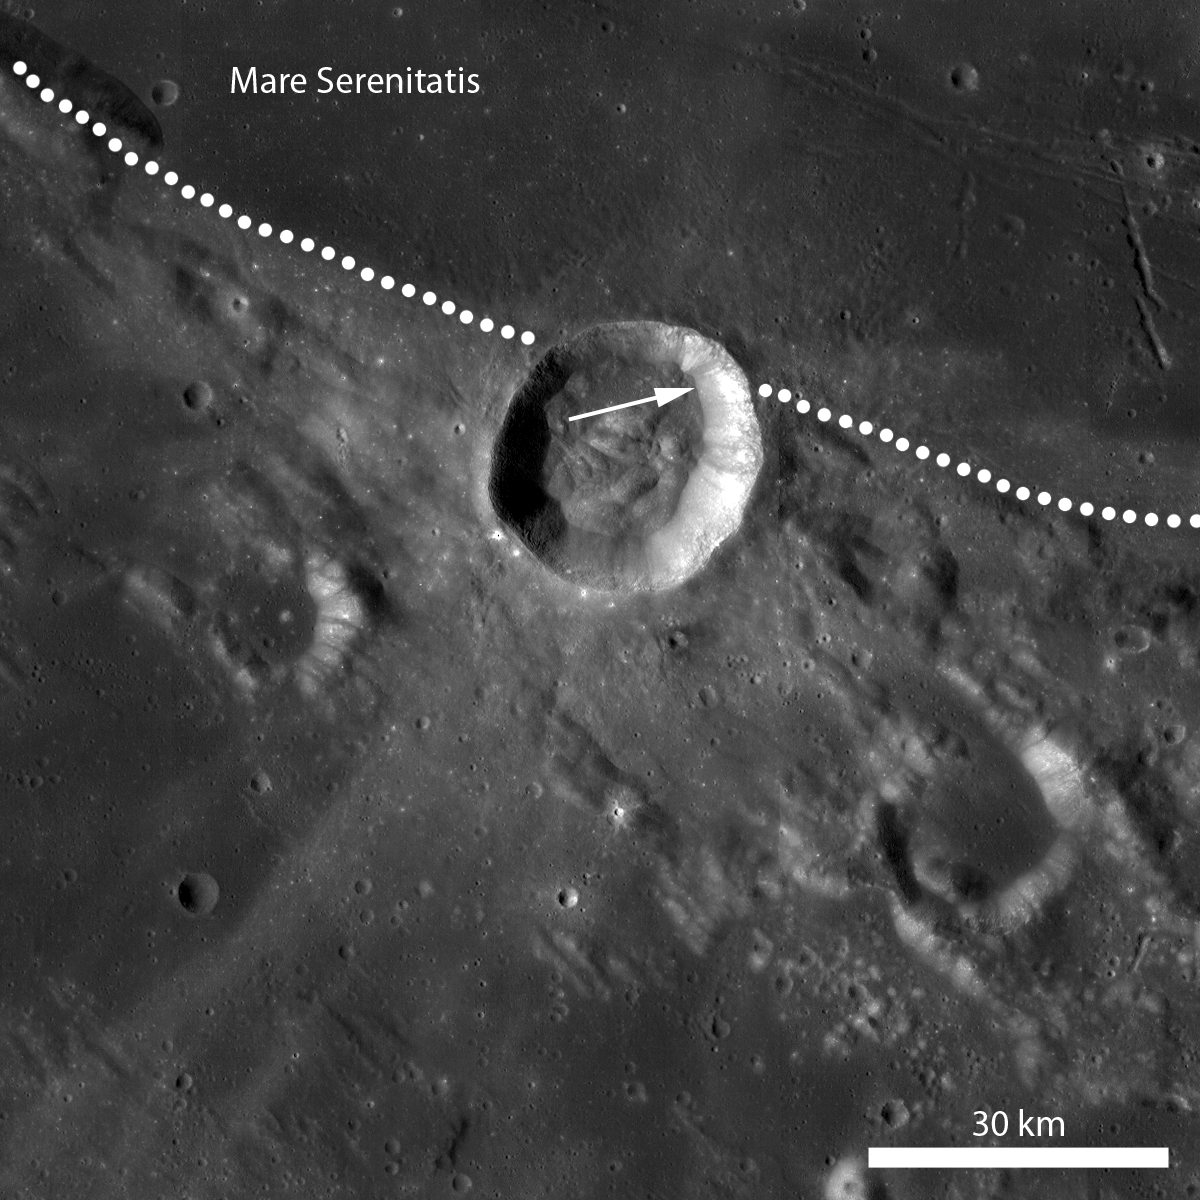
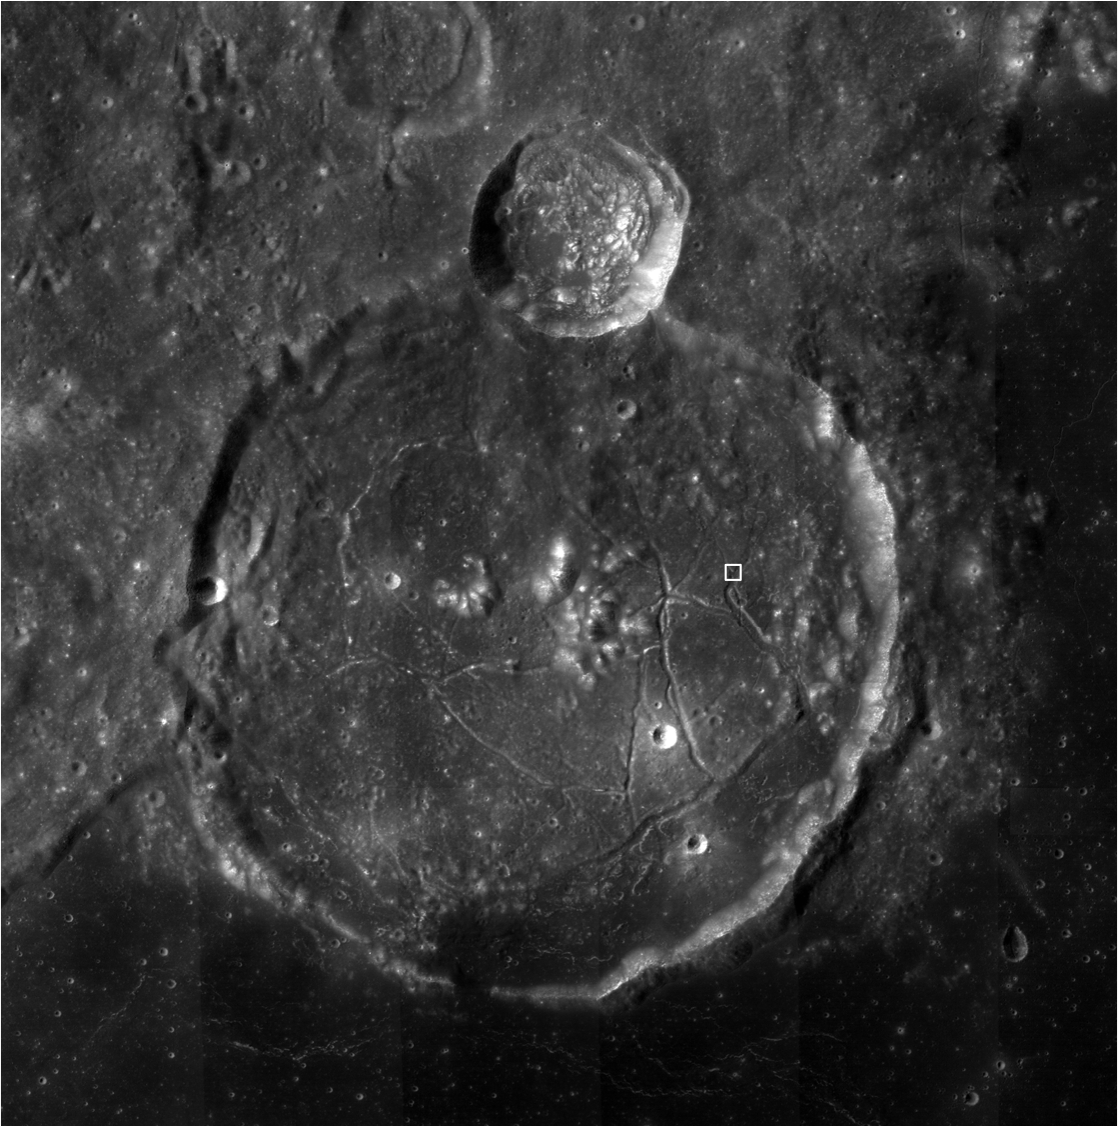
LROC WAC context of Menelaus crater at the boundary between Mare Serenitatis and the highlands (dotted line). The arrow marks the location of today's featured image at contact between the crater floor and NE crater wall [NASA/GSFC/Arizona State University].

What do you think? Why don't you follow the trail to its source in the full LROC NAC frame and see if you can find any other low reflectance trails.

Related posts:
Menelaus' distinctive rays
Small crater at the southern rim of Menelaus
Southern rim of Menelaus Crater
Hole in One!
Bright Boulder Trail
Bouncing, Bounding Boulders!

Southern rim of Menelaus crater


Perspective view HERE. The fresh crater featured previously
is barely visible further up the slope.

Rocks outcrop immediately within the rim of Menelaus and afterward roll downslope toward the crater floor as they erode out from the crater wall (to the upper right). (The boulder at top-middle is 8 meters across) Image (full-size available HERE) field of view is 400 meters, sampled from LROC Narrow Angle Camera observation M126826332L, LRO orbit 3824, April 25, 2010 [NASA/GSFC/Arizona State University].


LROC Wide Angle Camera mosaic of 27 km Menelaus and associated ejecta at the boundary between Serenitatis basin and the equatorial Near side highlands, deeply etched by the Imbrium basin-forming impact event. The arrow marks the location of today's featured image, just inside the crater's southern rim [NASA/GSFC/Arizona State University].

Traverse the rim of Menelaus crater in the full LROC NAC image!

-Lillian Ostrach

Thursday, October 28, 2010

Small crater at the southern rim of Menelaus

Updated October 28, 2010 - 1739 UT

Simulated view looking west from 26 km over the southern edge of Serenitatis basin at Menelaus, in context. The Narrow Angle Camera frames from which the LROC featured image was cropped can be seen as the long, slightly darker rectangular strip running north to south over Menelaus' western rim - see full-sized image HERE. The bright fresh crater can be seen on the crater's southwest rim. The contrast of terrains straddled by Menelaus is stark, between Serenitatis on the north and the highly grooved mountains on the south. Mare Tranquilliatis is at upper right. Rimae Menelaus marks the boundary of basalt melt fills, older and later partial inundation. Menelaus ejecta blanket stretches into (and over) the older Serenitatis fill - and an interior deeper (-4200 meter) than the basin's fill would seem to indicate Menelaus is younger than most features seen here [NASA/GSFC/Arizona State University - Google Earth (v.5.3)].


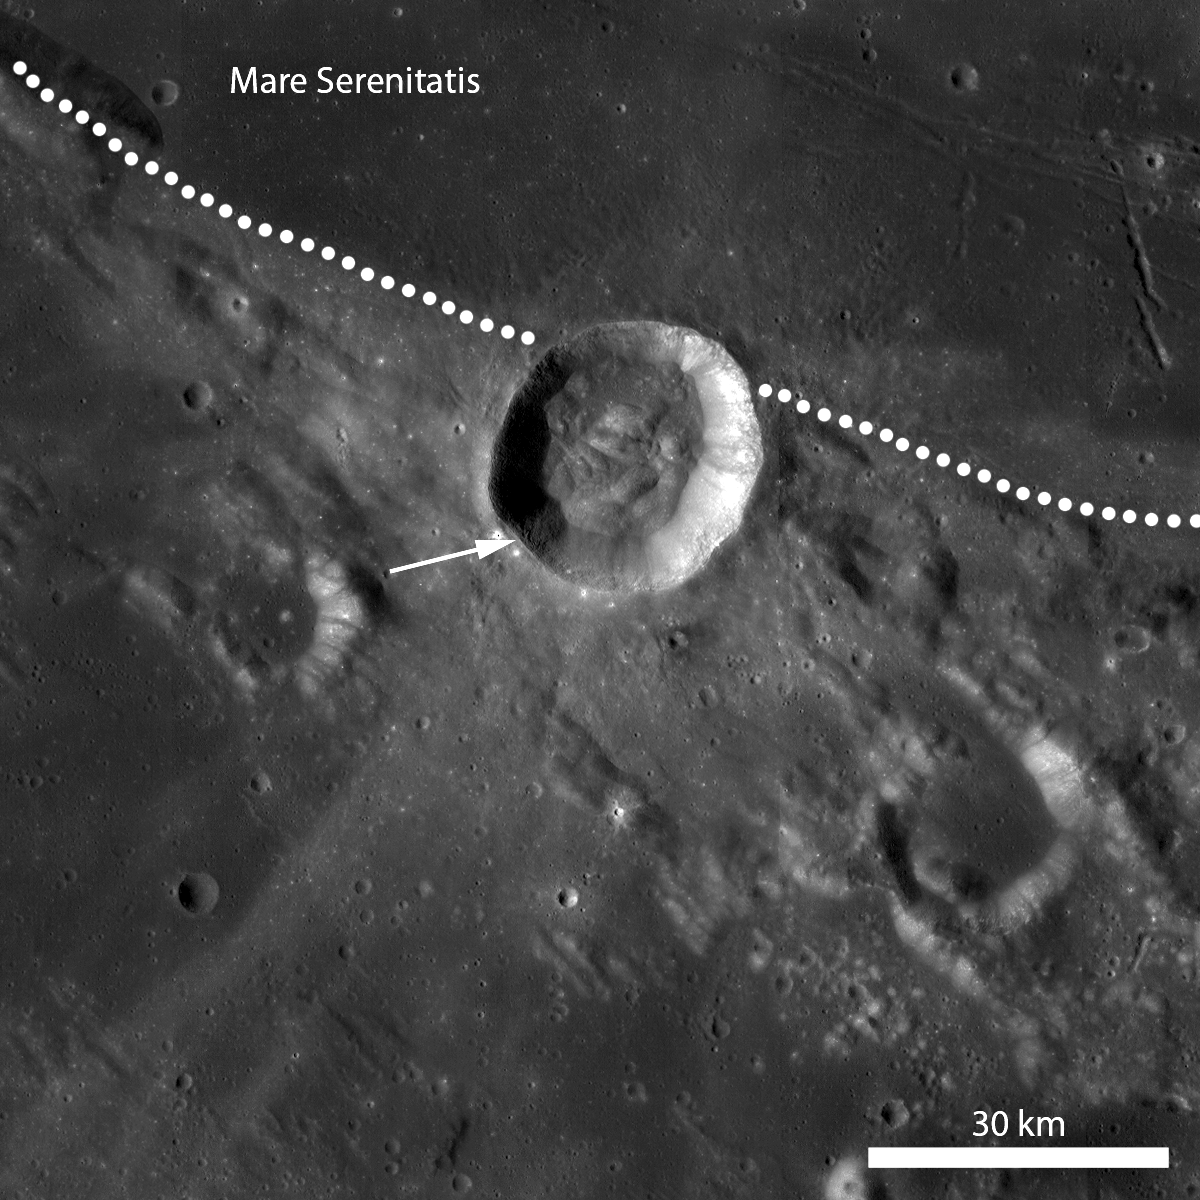
LROC Wide Angle Camera mosaic of Menelaus crater (16.3°N, 16.0°E), at the boundary between Mare Serenitatis and the highlands (dotted line). Broad ejecta rays extend along the mare-highland boundary and also in the NE-SW direction. In this image, the ejecta ray extending to the SW is easier to distinguish than the ray extending into Mare Serenitatis. The arrow marks the location of a recent 350 meter diameter impact near the rim of Menelaus. A full-sized view is HERE [NASA/GSFC/Arizona State University].

Lillian Ostrach
LROC News System

Menelaus crater (27 km diameter) straddles the highland-mare boundary at the southern margin of Mare Serenitatis. For years, scientists have wondered why Menelaus crater exhibits such a distinctive ray pattern. The distinctive ejecta pattern is partly a result of an oblique impact angle of the bolide that formed Menelaus. The ejecta rays are high reflectance relative to the surrounding terrain, but are these maturity or compositional rays? In most cases, a well-defined, high reflectance ray pattern suggests the relative youth of an impact crater. However, Menelaus crater formed in highland material, so Menelaus' rays may result more from compositional differences between the excavated material and the surrounding region, rather than the relative youth of the ejecta deposits. In fact, the optical maturity map for Menelaus crater, which is derived from Clementine multispectral data, supports this hypothesis because the crater rays are not visible, indicating that the rays are relatively mature (bright areas are immature).


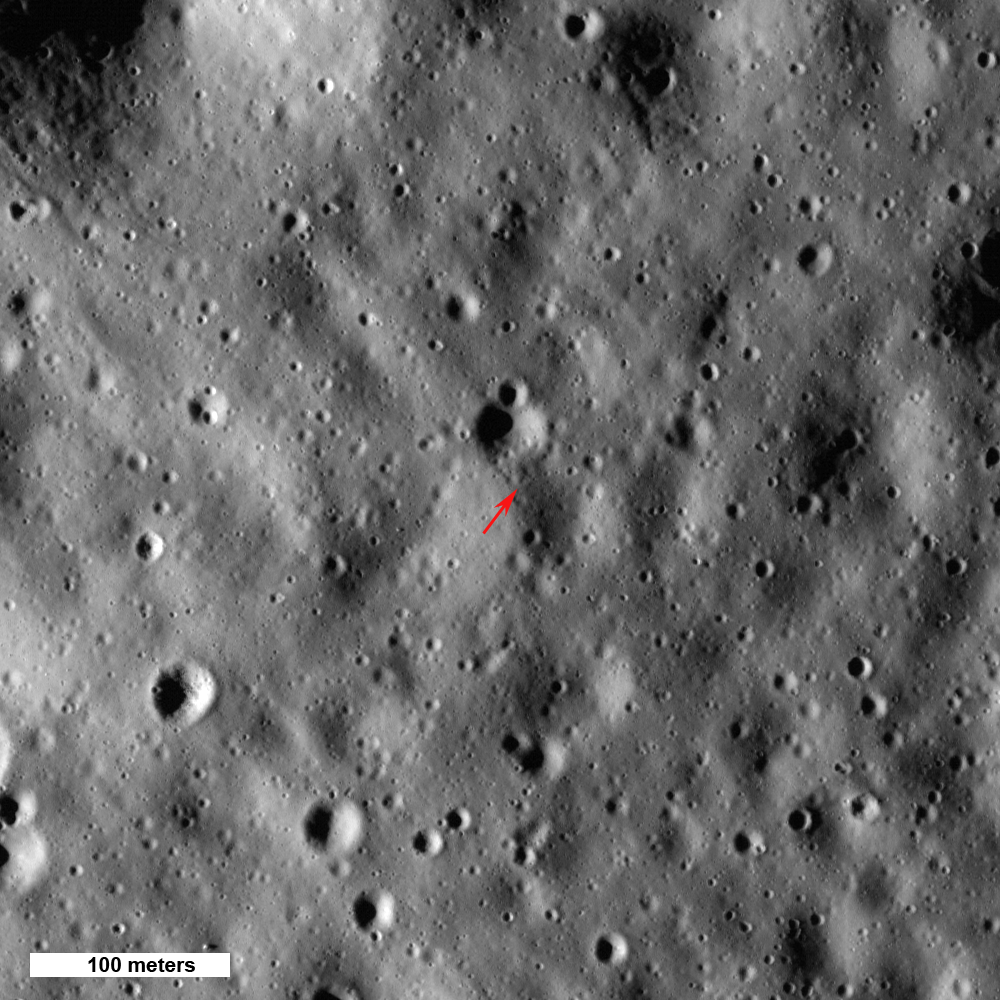
Materials of different reflectance are exposed by a 350 meter diameter fresh impact crater near the southern rim of Menelaus (16.3°N, 16.0°E). The western wall of this small impact crater appears to be composed primarily of very high reflectance material. Image field of view is 400 meters, from LROC Narrow Angle Camera observation M126826332R, LRO orbit 3824, April 25, 2010 (Altitude 40.71 km, resolution 48 cm per pixel; illumination is from the right (west). A fill-size view is available HERE [NASA/GSFC/Arizona State University].

Small craters, like the one above, near larger craters (less than 1 kilometer in diameter) help scientists unravel questions about larger impact events. This small crater is visible in Apollo Metric images and also in the Clementine optical maturity map; in the maturity map, the crater is bright and thus the ejecta material is interpreted to be immature. We know that impacts into ejecta blankets sample the material excavated during crater formation, and this recent impact into Menelaus ejecta effectively exposes material, most likely of anorthositic composition that was brought up from the floor of Menelaus. Its reflectance is low because of its physical state (glassy), not because it is a different rock type.

So, what does this small crater tell us about Menelaus crater? Since the small crater exposes immature Menelaus ejecta, we know that the surface of Menelaus is mature and thus the Menalaus rays show up due to a compositional difference (highlands on mare) and not because of a maturity contrast. This small crater provides an excellent opportunity for future astronauts to study compositional and maturity rays at the same location!

Discover the ejecta patterns of this small crater for yourself in the full LROC NAC image!

Related posts:
Splendors of Mare Smythii
May 20, 2010
Rima Bode: Constellation Region of Interest
May 18, 2010
Small crater on the wall of Metius B
October 19, 2009
Ejecta sweeps the surface
October 11, 2009
Ejecta Blanket
September 23, 2009


LROC Featured Image in context, again, on the southwest rim of Menelaus, a crater that is itself on the southern tier of Serenitatis basin (the northern horizon - see full-sized image HERE). The range of elevations seen here, within the virtual environment of Google Earth's lunar digital elevation model, is dramatic. From overhead, there's little indication of the uneven height of Menelaus' rim, though its uneven height at upper left is close to the global average. Serenitatis basin (beyond the ejecta blanket of Menelaus, about thirty kilometers away) quickly levels out to en elevation gradually descending beginning at around -2,700 meters. But in the shadowed interior of Menelaus, about 10 km away, there are areas below -4200 meters. The featured image square is overlaid on the LROC NAC observation from which it was sampled which, in turn, is set within a regional WAC monochrome mosaic from many LRO observation opportunities [NASA/GSFC/Arizona State University - Google Earth (v.5.3)].

"Dead spacecraft walking"


Artist's concept of ARTEMIS A and B (formally THEMIS-P1 and P2), after a circuitous, low-energy orbital transfer resembling a year-long round of pin-ball - back and forth many times between Lagrange points, finally in lunar orbit on a new and important mission. (A full-sized view is available HERE.) Flight Dynamics data from ARTEMIS P2 recently indicated one electric field instrument end-effector may have been struck by a meteoroid [NASA/UCLA].

Tony Phillips
Science@NASA

In 2007 NASA launched a fleet of five spacecraft into Earth's magnetosphere to study the physics of geomagnetic storms. Collectively, they were called THEMIS, short for "Time History of Events and Macroscale Interactions during Substorms." P1 and P2 were the outermost members of the quintet.

Working together, the probes quickly discovered a cornucopia of previously unknown phenomena such as colliding auroras, magnetic spacequakes, and plasma bullets shooting up and down Earth’s magnetic tail. This has allowed researchers to solve several longstanding mysteries of the Northern Lights.

The mission was going splendidly, except for one thing: Occasionally, P1 and P2 would pass through the shadow of Earth. The solar powered spacecraft were designed to go without sunlight for as much as three hours at a time, so a small amount of shadowing was no problem. But as the mission wore on, their orbits evolved and by 2009 the pair was spending as much as 8 hours a day in the dark.

"The two spacecraft were running out of power and freezing to death," says Angelopoulos. "We had to do something to save them."

The team brainstormed a solution. Because the mission had gone so well, the spacecraft still had an ample supply of fuel--enough to go to the Moon. "We could do some great science from lunar orbit," he says. NASA approved the trip and in late 2009, P1 and P2 headed away from the shadows of Earth.

With a new destination, the mission needed a new name. The team selected ARTEMIS, the Greek goddess of the Moon. It also stands for "Acceleration, Reconnection, Turbulence and Electrodynamics of the Moon’s Interaction with the Sun."

The first big events of the ARTEMIS mission are underway now. On August 25, 2010, ARTEMIS-P1 reached the L2 Lagrange point on the far side of the Moon. Following close behind, ARTEMIS-P2 entered the opposite L1 Lagrange point on Oct. 22nd. Lagrange points are places where the gravity of Earth and Moon balance, creating a sort of gravitational parking spot for spacecraft.


The ARTEMIS spacecraft are currently located at the L1 and L2 Earth-Moon Lagrange points. ARTEMIS-P1 is the first spacecraft to navigate to and perform stationkeeping operations around the Earth-Moon L1 and L2 Lagrangian points. A full-size view is available HERE, and a YouTube demonstration of the route taken to the new mission can be seen HERE [NASA/GSFC/UCLA].

"We're exploring the Earth-Moon Lagrange points for the first time," says Manfred Bester, Mission Operations Manager from the University of California at Berkeley, where the mission is operated. "No other spacecraft have orbited there."

Because they lie just outside Earth's magnetosphere, Lagrange points are excellent places to study the solar wind. Sensors onboard the ARTEMIS probes will have in situ access to solar wind streams and storm clouds as they approach our planet—a possible boon to space weather forecasters. Moreover, working from opposite Lagrange points, the two spacecraft will be able to measure solar wind turbulence on scales never sampled by previous missions.

"ARTEMIS is going to give us a fundamental new understanding of the solar wind," predicts David Sibeck, ARTEMIS project scientist at the Goddard Space Flight Center. "And that's just for starters."

ARTEMIS will also explore the Moon's plasma wake—a turbulent cavity carved out of the solar wind by the Moon itself, akin to the wake just behind a speedboat. Sibeck says "this is a giant natural laboratory filled with a whole zoo of plasma waves waiting to be discovered and studied."

Another target of the ARTEMIS mission is Earth's magnetotail. Like a wind sock at a breezy airport, Earth's magnetic field is elongated by the action of the solar wind, forming a tail that stretches to the orbit of the Moon and beyond. Once a month around the time of the full Moon, the ARTEMIS probes will follow the Moon through the magnetotail for in situ observations.
"Orbiting the Moon is notoriously tricky, however, because of irregularities in the lunar gravitational field."
"We are particularly hoping to catch some magnetic reconnection events," says Sibeck. "These are explosions in Earth's magnetotail that mimic solar flares--albeit on a much smaller scale." ARTEMIS might even see giant 'plasmoids' accelerated by the explosions hitting the Moon during magnetic storms.

These far-out explorations may have down-to-Earth applications. Plasma waves and reconnection events pop up on Earth, e.g., in experimental fusion chambers. Fundamental discoveries by ARTEMIS could help advance research in the area of clean renewable energy.

After six months at the Lagrange points, ARTEMIS will move in closer to the Moon—at first only 100 km from the surface and eventually even less than that. From point-blank range, the spacecraft will look to see what the solar wind does to a rocky world when there's no magnetic field to protect it.

"Earth is protected from solar wind by the planetary magnetic field," explains Angelopolous. "The Moon, on the other hand, is utterly exposed. It has no global magnetism."

Studying how the solar wind electrifies, alters and erodes the Moon's surface could reveal valuable information for future explorers and give planetary scientists a hint of what's happening on other unmagnetized worlds around the solar system.

Orbiting the Moon is notoriously tricky, however, because of irregularities in the lunar gravitational field. Enormous concentrations of mass (mascons) hiding just below the surface tug on spacecraft in unexpected ways, causing them over time to veer out of orbit. ARTEMIS will mitigate this problem using highly elongated orbits ranging from tens of km to 18,000 km.

"We'll only be near the lunar surface for a brief time each orbit (accumulating a sizable dataset over the years)," explains Angelopoulos. "Most of the time we'll linger 18,000 km away where we can continue our studies of the solar wind at a safe distance."

The Dead Spacecraft Walking may have a long life ahead, after all.

Related Posts:
NASA update: ILN Anchor Nodes
and Robotic Lunar Lander Project

August 17, 2010

THEMIS becomes ARTEMIS
Aviation Week
July 30, 2010


Robotic Lunar Landers
for Science and Exploration

41st Lunar and Planetary Science Conference, #2616
March 4, 2010


ARTEMIS, A Two Spacecraft, Planetary
and Heliospheric Lunar Mission
41st Lunar and Planetary Science Conference, #1425
March 4, 2010


Update on the new lunar phase
of THEMIS mission

UC Berkeley Daily Tech
October 30, 2009


ARTEMIS to Lagrange points
to lunar orbit

April 26, 2009
Wednesday, October 27, 2010

Surveyor 7: Our fragile lunar LDEF

From Lunar Pioneer Album 2 -
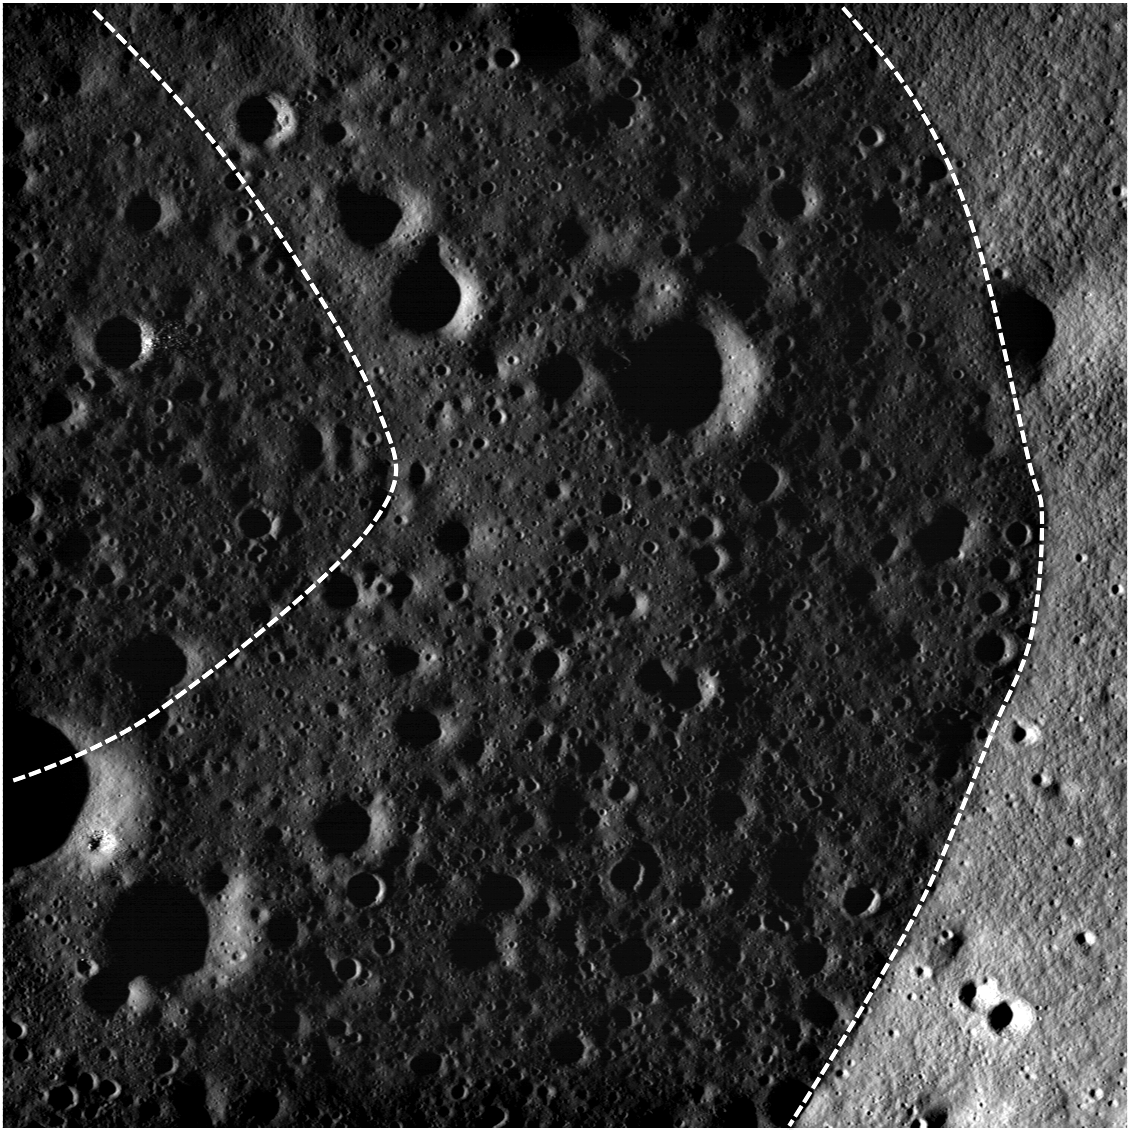
Surveyor 7 (center) - last of the unmanned series, and landed furthest from the equator, north of Tycho (40.980°S, 348.491°E), January 1968. LROC Narrow Angle Camera observation M119936760LE, LRO orbit 2808, February 4, 2010, from 46.32 km. The distinctive square solar panel and mast casts a long shadow. Resolution 53 cm per pixel, spacecraft and camera skew toward target was nearly 20 degrees [NASA/GSFC/Arizona State University].

Can you located the "seemingly" big rock and craggy crater in the television mosaic returned by Surveyor 7 in the 2010 picture above? Can you see the shadow cast by the square solar panel standing on a mast above the Surveyor tripod landing platform?


Thanks to Sam Lawrence of Mark Robinson's LROC team at Arizona State University for maintaining an excellent, definitive list of human artifacts they have managed to locate on the lunar surface, using the Narrow Angle Camera (NAC) on-board LRO. By the time the scene above was imaged, on February 4, 2010 (zipping overhead at around 1.6 km per second, from an altitude of only 46.32 km), Surveyor 7 had been sitting on the Moon here, north of the Tycho for 42 years, 25 days, 14 hours, 25 minutes and 57 seconds. That means Surveyor 7 has been patiently sitting here through 568 blistering hot lunar days and super-cold nights, exposed to virtual vacuum and continuously bombarded by cosmic rays, solar wind and micrometeorites.

Because we have a documented record of the spacecraft's condition, up until losing contact with it 65 hours after its arrival here, and especially prior to its launch, chance are good Surveyor 7 (like other human artifacts on the Moon, located in a variety of places that may experience slightly different conditions, holds a pretty valuable record as a Long Duration Exposure Facility, something worth preserving for very close examination. Though this same situation - on a much shorter time scale - went into the decision to land Apollo 12 at the earlier landing site of Surveyor 3, this was secondary to testing Apollo's ability to land at a pre-determined target, and not just somewhere close. This test was a phenomenal success, vital to later missions that would land in tight spots, after negotiating their way over mountain ranges. When Conrad & Bean retrieved the television camera and robotic arm from Surveyor 3, they were examined with microscopic precision, over the course of nine months.

The report (large .pdf) proved to be a cautionary tale for future missions with the purpose of preserving these priceless baseline records of decades of exposure, some likely to be very delicate. Whether there was any accumulation of dust from the dynamic lunar exosphere on Surveyor 3 was impossible to discover, though that might also have been lost in handling anyway. Though, again, the value of Surveyor 3 as a LDEF was secondary to the Apollo 12 mission, it was eventually found that what minor pitting and paint blistering found on these parts were probably a result of the high velocity dust and debris kicked up by the descent and landing of Apollo 12. Even if Conrad & Bean had landed even closer to their intended target, a little shorter of the shallow crater where Surveyor 3 had been for thirty months, a similar contamination was inevitable.

Because of what has been since been surmised about the likely dynamism of the lunar exosphere, the migration of charged dust, and also because of a far more lengthy record of all the other conditions experienced by Surveyor 7 and the other artifacts - particularly those soft-landed - it's now considered important that future missions arrive from what once would have been considered a very great distance. Approaching these valuable "LDEF's" slowly, low to the ground is mandatory. It's also accepted that the infamous dust and debris fans kicked up by the arrival of manned and unmanned landings accelerated many particles to orbital, even escape velocity. Even arrivals at a modest distance, just over the horizon, is now considered certain to complicate a record waiting to teach us about the conditions on the Moon over an appreciable period.

As an aside, on March 21, 2010, I speculated the following image might also be of Surveyor 7. But, after a close examination it's clear I was mistaken. And after taking a look at the entire frame from which Sam Lawrence's definitive identification above was cropped, there are natural objects in the vicinity that, under the right illumination, might look a lot like the still-strange (to me) looking "thing" found in M111668133LE.

Tuesday, October 26, 2010

LROC: Highest Point on the Moon

Updated October 27, 2010 - 2005 UT

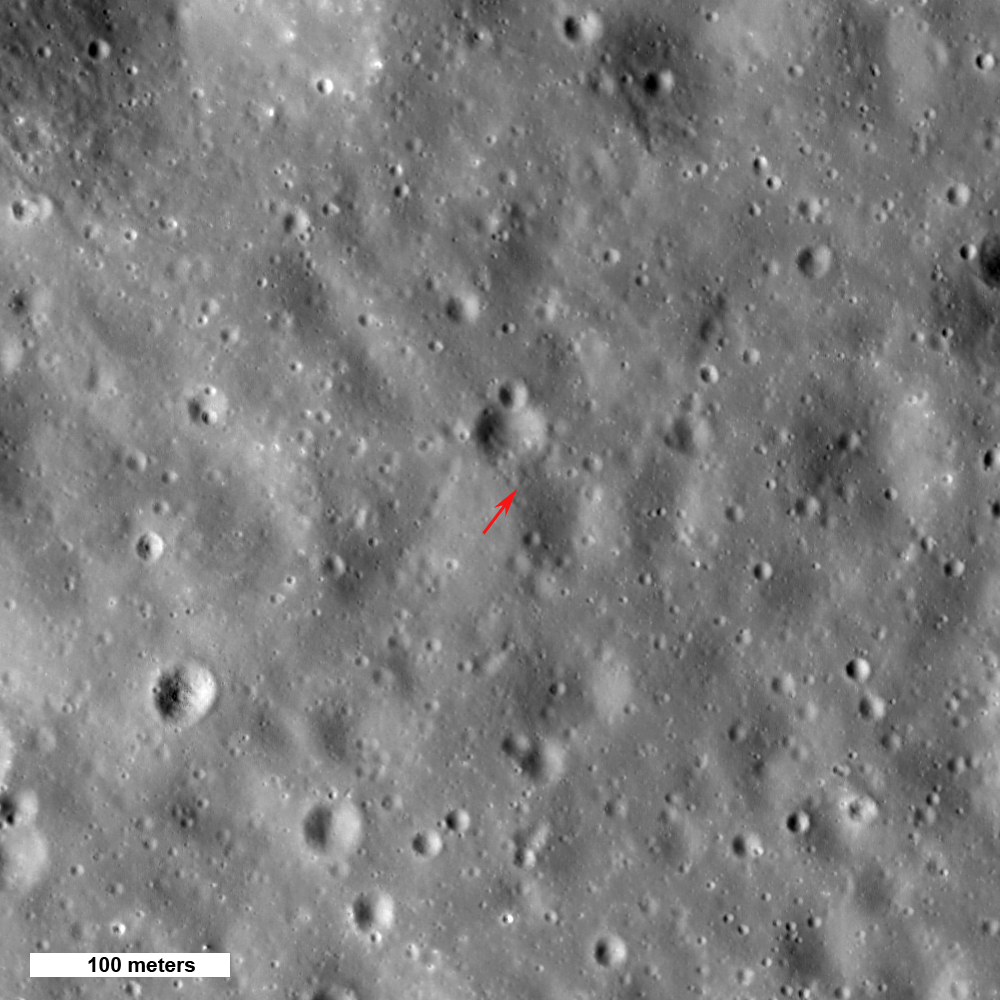
Arrow shows highest point on the Moon, 10,786 meters (35,387 feet) above the mean global radius. North is up, Sun's elevation is 16° above the horizon, image field of view is 500 meters, from LROC Narrow Angle Camera (NAC) M133865651L & R mosaic [NASA/GSFC/Arizona State University].

Mark Robinson

Principal Investigator
Lunar Reconnaissance Orbiter Camera
Arizona State University


Over the course of the Lunar Reconnaissance Orbiter mission, the LOLA team has diligently watched as the highest point on the Moon got higher and higher. No, the Moon is not expanding, but rather the LOLA profile coverage increases each month so the chances increase that a ground track will pass directly over, or very near to the highest point. Once the LOLA team had the spot narrowed down to a small area, the LROC team commanded a NAC stereo pair (12 August 2010) to get an even higher resolution measurement of the elevation and coordinates of the highest point. Once the stereo pair was on the ground, the LROC team processed the images into a digital elevation model (DEM), or topographic map.


Another view of the Moon's highest point with the Sun further above the horizon (Sun angle 48°). Image field of view is 500 meters, LROC NAC M136226953 [NASA/GSFC/Arizona State University].

The highest point on the Earth is at the summit of Mount Everest, which is 8,848 meters (29,029 feet) above sea level. The lunar high point is 1938 meters higher than that of the Earth! However there are several major differences between the two points. Mt Everest is a relatively new feature on the Earth. It was formed as tectonic plates collided and pushed up to astonishing heights what was once seafloor, over the course of about 60 million years. The lunar high point is very ancient, and was most likely formed as ejecta from the enormous South Pole Aitken basin piled up during this cataclysmic event, in matter of minutes, more than 4 billion years ago. Another key difference between the two highest points is slope. The flanks of Mt Everest are very steep, while on the Moon the approach to the summit has slopes of only about 3°, assuming you skirt around impact craters. This difference is due to the two very different formation mechanisms.


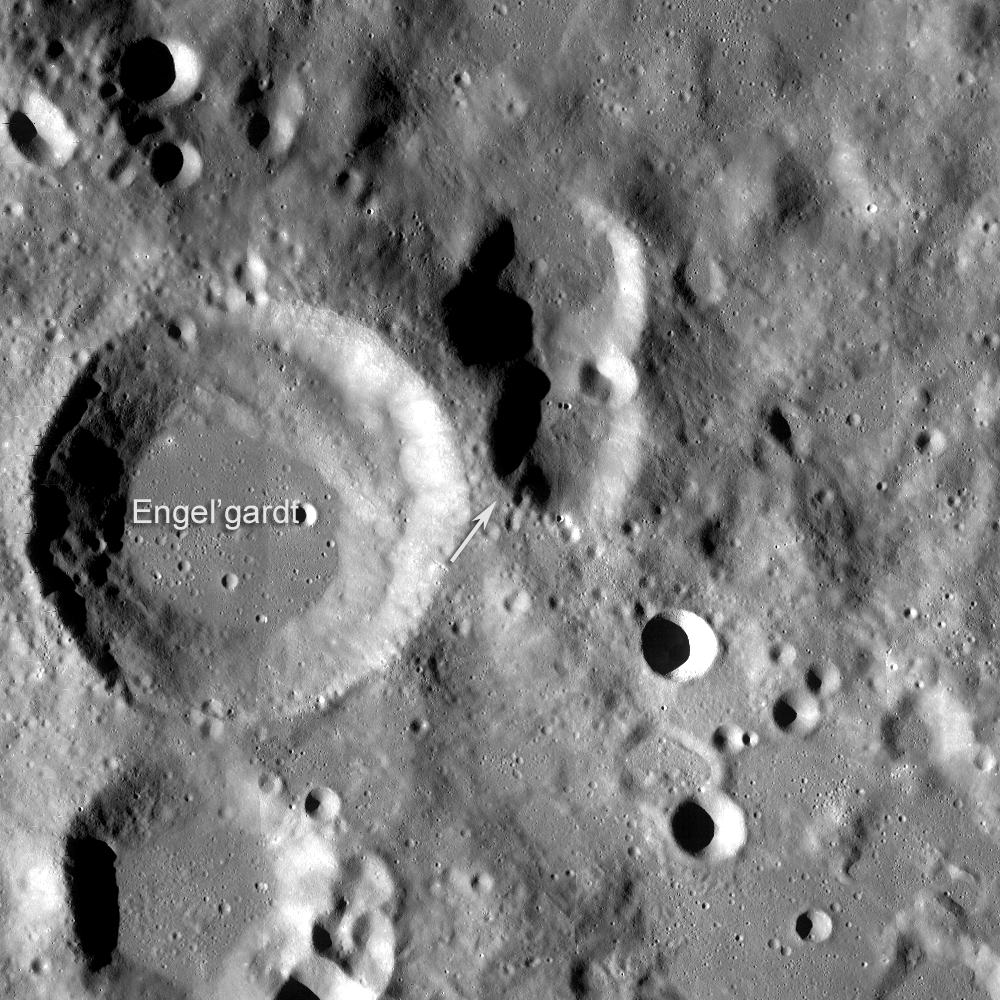
LROC Wide Angle Camera (WAC) mosaic of the Far side highlands region around the Moon's highest elevation (arrow). Engel'gradt (after Vasilij Pavlovich; Russian astronomer, 1828-1915) crater is 44 km in diameter, north is up, mosaic field of view is 100 km [NASA/GSFC/Arizona State University].

As the LRO mission progresses, knowledge of the spacecraft position improves so the accuracy of the elevation and coordinates (5.4125°N, 201.3665°E (158.6335°W) - 10,786 meters) of the highest point will improve a small amount.

The highest point is near sample 5,654 and line 29,939 in the full resolution NAC mosaic.

Related Post:
Lunar superlatives from LROC WAC
September 6, 2010


More than sixty kilometers north by northeast of the Moon's highest point is a view showing the wide variations of elevation nearby. The base of the ridge immediately below is roughly equal to the global mean average, rising to a hight of 1200 meters in a few kilometers. The distance between that closer ridge and the "plateau-like" ridge on the horizon, upon which is the 10 km highest point, is 55 kilometers. LROC NAC mosaic overlaying lunar digital elevation model available in Google Earth (>v.5).

Lunar Beagle and Lunar Astrobiology


Beagle 2 lander deployed in an idealized position. The Position Adjustable Work Station (PAW) is positioned for analysis of a rock and the Mole is ready to move across the surface.

Gibson, Pillinger & Waugh

The study of the elements and molecules of astrobiological interest on the Moon can be made with the Gas Analysis Package (GAP) and associated instruments developed for the Beagle 2 Mars Express Payload.

The Beagle 2’s analytical instrument package including the sample processing facility and the GAP mass spectrometer can provide vital isotopic information that can distinguish whether the lunar volatiles are indigenous to the moon, solar wind derived, cometary in origin or from meteoroids impacting on the Moon. As future Lunar Landers are being considered, the suite of instruments developed for the Mars Beagle 2 lander can be consider as the baseline for any lunar volatile or resource instrument package.

We suggest a possible package based on the Beagle 2 Mars lander, for delivery to a lunar polar region to conduct definitive studies in situ analysis of molecules of astrobiology importance.

Review the (pdf) proposal and rationale, HERE.

LRO-Diviner Lunar Radiometer observations of cold traps in the Moon’s south polar region

David A. Paige,1* Matthew A. Siegler,1 Jo Ann Zhang,1 Paul O. Hayne,1 Emily J. Foote,1 Kristen A. Bennett,1 Ashwin R. Vasavada,2 Benjamin T. Greenhagen,2 John T. Schofield,2 Daniel J. McCleese,2 Marc C. Foote,2 Eric DeJong,2 Bruce G. Bills,2 Wayne Hartford,2 Bruce C. Murray,3 Carlton C. Allen,4 Kelly Snook,5 Laurence A. Soderblom,6 Simon Calcutt,7 Fredric W. Taylor,7 Neil E. Bowles,7 Joshua L. Bandfield,8 Richard Elphic,9 Rebecca Ghent,10 Timothy D. Glotch,11 Michael B. Wyatt,12 Paul G. Lucey13
22 OCTOBER 2010 VOL 330 SCIENCE

Diviner Lunar Radiometer Experiment surface-temperature maps reveal the existence of widespread surface and near-surface cryogenic regions that extend beyond the boundaries of persistent shadow. The Lunar Crater Observation and Sensing Satellite (LCROSS) struck one of the coldest of these regions, where subsurface temperatures are estimated to be 38 kelvin. Large areas of the lunar polar regions are currently cold enough to cold-trap water ice as well as a range of both more volatile and less volatile species. The diverse mixture of water and high-volatility compounds detected in the LCROSS ejecta plume is strong evidence for the impact delivery and cold-trapping of volatiles derived from primitive outer solar system bodies.

The Moon’s polar regions are notable because of their potential to cryogenically trap water ice and other volatile species (1). The Lunar Reconnaissance Orbiter (2) (LRO) Diviner Lunar Radiometer Experiment has been mapping the infrared emission from the Moon since July 2009 using seven spectral channels that span a wavelength range from7.55 to 400 mmat a spatial resolution of ~200 m (3).

Thermal maps of the south polar region (Fig. 1, A and B) were obtained during the LRO monthly mapping cycle just before the Lunar Crater Observation and Sensing Satellite (LCROSS) impact (4), as the Moon approached southern summer solstice (5). The mapped quantity is the bolometric brightness temperature, which is the wavelength-integrated radiance in all seven Diviner channels expressed as the temperature of an equivalent blackbody (6). For quantifying the overall heat balance of the surface and comparing with available models, the bolometric brightness temperature is the most fundamental and interpretable measurable quantity.

For the simplest case in which Diviner’s surface footprint is filled with a blackbody of uniform surface temperature, the bolometric brightness temperature will be equal to the temperature of the surface.


Figure 1. Maps of measured and model-calculated surface and subsurface temperatures in the lunar south polar region. The outer circle on all maps is 80° south latitude. Observations were acquired between 6 September and 3 October 2009 as the Moon approached southern summer solstice. (A) Diviner-measured daytime bolometric brightness temperatures acquired between 11.4 and 13.6 hours local time (5). (B) Diviner-measured nighttime bolometric brightness temperatures acquired between 21.41 and 1.66 hours local time (5). (C) Model-calculated annual average near-surface temperatures and the location of the LCROSS impact in Cabeus Crater. (D) Model-calculated depths at which water ice would be lost to sublimation at a rate of less than 1 kg/m−2 per billion years. - The white regions define the locations where water ice can currently be cold trapped on the surface, the colored regions define the upper surface of the lunar ice permafrost boundary and the gray regions define locations where subsurface temperatures are too warm to permit the cold-trapping of water ice within 1 m of the surface.

In the more general case, where Diviner’s surface footprint contains small-scale slopes, shadows, or rocks, the brightness temperatures in Diviner’s individual infrared channels may vary with wavelength depending on the distribution of sub–footprint-scale temperatures, spectral emissivities, and photometric properties. In this case, the bolometric brightness temperature cannot be interpreted in terms of a unique surface temperature. However, within cold regions that are not in direct sunlight, simultaneously acquired brightness temperatures in Diviner channels 7 (25 to 41 mm), 8 (50 to 100 mm), and 9 (100 to 400 mm) are in good agreement (6), which is consistent with uniformly high spectral emissivity across this wavelength range and relatively uniform temperatures within each Diviner footprint (fig. S1, A and B). This interpretation is supported by the results of an analysis of data acquired in each of the Diviner infrared channels at the LCROSS impact site in Cabeus Crater (7). For unilluminated regions, we use Diviner bolometric brightness temperatures as reasonably accurate proxies for the temperature of the surface.

The thermal maps show that the coldest regions are located on the floors of larger impact craters that receive no direct sunlight (Fig. 1,A and B). For these regions, previous modeling studies have shown that the main heat source is emitted infrared radiation from distant interior sunlit crater walls (8–11). Topographic relief within cold crater floor regions can provide additional radiation shielding, resulting in intensely cold localized regions with measured mid-day bolometric brightness temperatures as low as 29 K. Heat flow fromthe lunar interior may contribute to the overall heat balance of these coldest surfaces, but is not dominant compared to heating from scattered solar and infrared radiation during this season (6). Diviner’s summer solstice observations represent a valuable snapshot of the south polar region surface temperatures that can be extended in depth and in time with models. We have developed a thermal model that realistically accounts for the effects of large-scale topographic relief on direct and indirect solar and infrared radiation on the heat balance of the lunar surface (6). The model uses a ~500-m-scale triangular mesh based on south polar topography derived from the Kaguya LALT laser altimeter (12) and a spatially uniform set of thermal and reflectance parameters that are generally consistent with those derived from previous studies (6). The excellent overall agreement between maps (fig. S3, A and B) and histograms (Fig. 2A) of the observed and calculated bolometric temperatures demonstrate the general validity of our modeling approach. The only notable discrepancy occurs for daytime temperatures in the shadowed portions of craters that have measured bolometric temperatures in the range of 60 to 120 K, where the model underestimates temperatures by roughly 15 K (fig. S4, A and B). This may be largely due to directionally anisotropic infrared emission from rough sunlit crater walls, which is not accounted for in the present model (6). Given the better agreement between the model and the Diviner nighttime data, we estimate that the net effect on model-calculated annual average temperatures at 2-cm depth (Figs. 1C and 2B) is less than 7 K in the warmest craters and close to zero in the coldest craters. For the limiting case of zero heat flow from the lunar interior, the temperatures at greater depths would be close to this near-surface average temperature (11). However, with nonzero heat flow, average temperatures will increase with depth at a rate proportional to the heat flow rate and inversely proportional to the thermal conductivity. Using parameters derived from the heat flow experiments at the Apollo 15 and 17 landing sites (13), we estimate that LCROSS impact site temperatures at 2-m depth should be <6 K higher than annual average surface temperatures (fig. S5). Although the Diviner bolometric temperatures presented here and cooling curves at the LCROSS impact site are generally consistent with the presence of unconsolidated regolith near the surface (7, 14), the thermophysical properties of the Moon’s cryogenic regolith are not currently well constrained and could differ substantially from those in warmer regions (15), particularly at depth.


Figure 2. (A) Normalized histograms of measured daytime and nighttime bolometric brightness temperatures for the maps shown in Fig. 1, A and B, with comparisons to model-calculated surface temperatures at the same locations and times as those of the Diviner observations (fig. S3, A and B). (B) Histograms of model-calculated annual average temperatures at 2-cm depth for the maps shown in Fig. 1C and fig. S7, A to D, and at the LCROSS impact site for selected values of qmax, the mean maximum angle between the Moon’s spin axis and the normal to the ecliptic plane. qmax =1.54° for present-day conditions. (C) The recent evolution of qmax as a function of the Earth-Moon distance (29). (D) The volatility temperatures of a range of potential cold-trapped volatile compounds (21, 22) View higher-resolution Fig. 2 HERE.

We expect that the Moon’s cryogenic regions extend to depths of at least tens of meters below the surface, but estimating the volumetric extent of the Moon’s cryogenic regions purely from surface-temperature observations is highly uncertain.

Thermal model results can be used to estimate the stability of water ice deposits to loss by sublimation and diffusive migration through the lunar regolith (11, 16). Figure 1D shows a map of the depths at which water ice would be lost at a rate of less than 1 kg m−2 per billion years, which corresponds to a loss rate of 1 mm per billion years for a pure ice deposit (6). The results show that surface cold traps for water ice are surrounded by much more extensive “lunar permafrost” regions where water ice is stable in close proximity to the surface (17). These regions may receive direct solar radiation during periods when solar lighting conditions are most favorable, but maintain annual maximum temperatures at depth that are sufficiently cold to effectively prevent appreciable water loss due to sublimation. Because of their more hospitable surface thermal and illumination environments, lunar permafrost regions may be accessible locations for future in situ exploration of the Moon’s cold traps.

The overall picture painted by the present thermal state of the lunar south polar region is one of extreme cold. Temperatures in the Moon’s larger cold traps are closer to those expected for the poles of Pluto (18) than for Earth’s closest neighbor. At the cold temperatures that exist within most south polar craters, cold-trapped water molecules have negligible mobility (16), such that any water molecules deposited on the surface will not effectively diffuse below the surface where they can be protected from loss processes such as photolysis and sputtering (19). In cryogenic regions, burial of frozen volatiles by impact gardening is likely to be a much more effective process (20). However, warmer permafrost regions that currently exist at the margins of cold traps may represent somewhat more favorable environments for the downward diffusion of water molecules into the regolith, which should be aided by the daytime temperature gradient between warmer surface layers and colder subsurface layers below.

The distribution of temperatures in the lunar south polar region also places constraints on the thermal stability of non-water volatile species. Figure 2D shows the volatility temperatures (the temperatures at which pure solids exposed to vacuum at the surface would sublimate at a rate of 1 mm per billion years) for several volatile species (21, 22). Non-water subsurface volatiles will also be stable to sublimation at higher temperatures owing to the effects of diffusive migration through the regolith (6). Large areas of the lunar south polar region have the capability to cold-trap water and less volatile species such as mercury and sodium. All three of these volatile species were in the LCROSS ejecta plume (4, 14, 23).

Colder surface and subsurface areas in the south polar region also have the capability to cold-trap so-called super volatile species that have higher volatility than water, which include compounds such as sulfur dioxide, carbon dioxide, formaldehyde, ammonia, and methanol. The detection of a representative cross-section of these same supervolatile species in the LCROSS ejecta plume (4) represents strong evidence for the impact delivery of volatiles to the Moon by primitive outer solar system bodies, and the subsequent cold-trapping of these volatiles at the lunar poles (21, 22).

A question of interest regarding the lunar cold traps is whether they contain abundant deposits of nearly pure water ice such as those discovered by radar observations of impact craters at the poles of Mercury (24). Diviner-measured summer solstice daytime and nighttime surface bolometric brightness temperatures of 46.7 and 38.7 K in the region surrounding the LCROSS impact site, and model-calculated annual average temperatures at this site at a depth of 2 cm, are close to 38 K (6). As shown in Figs. 1, C and D, and 2B, the LCROSS impact site is a surface cold trap for water and is among the coldest locations in the south polar region. The Lunar Prospector Neutron Spectrometer (LPNS) results show that the average hydrogen abundance in the near-surface regolith at the south pole is ~70 parts per million (ppm) by weight, which translates to a water-equivalent average abundance of ~600 ppm by weight (25). Our results show that the surface and near-surface water ice cold traps comprise >66% of the surface area poleward of 85° south latitude (Fig. 1D). If we assume that all the hydrogen detected by LPNS was uniformly distributed within these cold traps, then the average water-equivalent abundance would be only ~1000 ppm by weight, which is substantially less than the 1 to 10% water content inferred at the LCROSS impact site (4). This suggests that the LCROSS site must be enriched in water compared to the average south polar near-surface cold trap, which is consistent with enhanced hydrogen abundances observed in the Cabeus region by orbital neutron spectrometers (26–28).

The spin pole of the Moon is currently in a tidally damped Cassini State 2 configuration in which the time-averaged maximum angle between theMoon’s spin axis and the normal to the ecliptic plane (qmax) has decreased to its present value of qmax = 1.54° as the Earth-Moon distance increased over time (Fig. 2C) (29). The absolute time scale for the tidal evolution of the Earth-Moon system is highly uncertain, but it is likely that the transition depicted in Fig. 2C has occurred over a period of more than 1 billion years (30). Model-calculated annual average near-surface temperatures qmax = 4°, 8°, 12°, and 16° (Fig. 2B and fig. S7, A to D) show that portions of the Moon’s south polar region cooled considerably as the Moon’s orbital radius increased, first creating cold traps capable of cold-trapping water, and then trapping compounds with higher volatility. The LCROSS impact site,which is located on the floor of the large Cabeus impact crater, is typical of the coldest areas on the Moon today. However, earlier in the Moon’s orbital history, when qmax was greater than ~10°, the floors of large-impact craters were not the coldest areas on the Moon because the walls of these relatively shallow craters did not shield their floors from direct solar radiation. Based on the results in Fig. 2B and fig. S7, A to D, the Moon’s earliest surviving near-surface cold traps are not located on the floors of large-impact craters, but rather on the floors of intermediate-sized craters, which thus may have had longer opportunities to accumulate water ice.

1Department of Earth and Space Sciences, University of California, Los Angeles, 595 Charles E. Young Drive East, Los Angeles, CA 90095, USA. 2Jet Propulsion Laboratory, California Institute of Technology, Pasadena, CA 91109, USA. 3California Institute of Technology, Pasadena, CA 90025, USA. 4NASA Johnson Space Center, Houston, TX 77058, USA. 5NASA Goddard Space Flight Center, Greenbelt, MD 20771, USA. 6U.S. Geological Survey, Flagstaff, AZ 86001, USA. 7Oxford University, Oxford OX1 3PU, UK. 8University of Washington, Seattle, WA 98195, USA. 9NASA Ames Research Center, Moffett Field, CA 94035, USA. 10University of Toronto, Toronto, ON M5S 3B1, Canada. 11State University of New York, Stony Brook, NY 11794, USA. 12Brown University, Providence, RI 02912, USA. 13University of Hawaii, Honolulu, HI 96822, USA.

*To whom correspondence should be addressed. E-mail: dap@moon.ucla.edu

References and Notes:

1. K. Watson, B. C. Murray, H. Brown, J. Geophys. Res. 66, 3033 (1961).
2. G. Chin et al., Space Sci. Rev. 129, 391 (2007).
3. D. A. Paige et al., Space Sci. Rev. 150, 125 (2010).
4. A. Colaprete et al., Science 330, 463 (2010).
5. The LRO orbit plane is inclined 90° to the lunar equator and is fixed in inertial space. LRO’s ground track rotates through 360° of longitude every sidereal month, allowing Diviner to make one daytime and one nighttime map every 27.3-day mapping cycle in pushbroom nadir mapping mode. Local time on the Moon can be expressed in hours by normalizing the angular distance between geographic longitude and the longitude of the solar point to a 24-hour day. We define daytime to be between 6 a.m. and 6 p.m. local time, and nighttime to be between 6 p.m. and 6 a.m. local time. Because the plane of the LRO orbit rotates relative to the lunar terminator by 360° every Earth year, the local times of Diviner’s observations drift by ~2 hours during each mapping cycle. The subsolar latitude on the Moon currently varies by approximately T1.54° over the course of the Moon’s 346-day draconic year, resulting in distinct seasonal temperature variations at the highest latitudes. The LRO launch date was chosen so that the LRO orbit plane was within 10° of the noon-midnight plane during LRO’s first southern summer solstice.
6. Supporting material is available on Science Online.
7. P. O. Hayne et al., Science 330, 477 (2010).
8. R. R. Hodges, Lunar Planet Sci. Conf. 11, 2463 (1980).
9. D. A. Paige, S. E. Wood, A. R. Vasavada, Science 258, 643 (1992).
10. A. P. Ingersoll et al., Icarus 100, 40 (1992).
11. A. R. Vasavada et al., Icarus 141, 179 (1999).
12. H. Araki et al., Science 323, 897 (2009).
13. M. G. Langseth et al., Proc. Lunar Sci. Conf. 7, 3143 (1976).
14. P. H. Schultz et al., Science 330, 468 (2010).
15. G. J. Taylor et al., Proceedings of Space Resources Roundtable VI. LPI Contribution No. 1224., Golden, CO, Abstract 6040 (Lunar and Planetary Institute, Houston, TX, 2004).
16. N. Schorghofer, G. J. Taylor, J. Geophys. Res. 112, E02010 (2007).
17. We estimate that the total area of surface water ice cold traps in the lunar south polar region shown in Fig. 1D is 13,087 km2, and the total area of near-surface water ice cold traps to a depth of 1 m is 119,507 km2.
18. C. J. Hansen, D. A. Paige, Icarus 120, 247 (1996).
19. T. H. Morgan, D. E. Shemansky, J. Geophys. Res. 96 (A2), 1351 (1991).
20. D. H. Crider, R. R. Vonrak, Adv. Space Res. 31, 2293 (2003).
21. J. A. Zhang, D. A. Paige, Geophys. Res. Lett. 36, L16203 (2009).
22. J. A. Zhang, D. A. Paige, Geophys. Res. Lett. 37, L03203 (2010).
23. G. R. Gladstone, Science 330, 472 (2010).
24. J. K. Harmon, Space Sci. Rev. 132, 307 (2007).
25. W. C. Feldman et al., J. Geophys. Res. 106 (E10), 23,231 (2001).
26. D. J. Lawrence et al., J. Geophys. Res. 111, E08001 (2006).
27. R. C. Elphic et al., Geophys. Res. Lett. 34, L13204 (2007).
28. I. Mitrofanov et al., Lunar Planet. Sci. Conf. 41, 2250 (2010).
29. W. R. Ward, Science 189, 377 (1975).
30. B. G. Bills, R. D. Ray, Geophys. Res. Lett. 26, 3045 (1999).
31. We thank the many people at the Jet Propulsion Laboratory and the Goddard Space Flight Center who contributed to the success of the Diviner instrument and the LRO project. We also thank the National Aeronautics and Space Administration for funding this investigation.

Supporting Online Material
www.sciencemag.org/cgi/content/full/330/6003/479/DC1
Methods Figs. S1 to S7
References 1 February 2010; accepted 12 August 2010 10.1126/science.1187726