Showing posts sorted by relevance for query Clementine. Sort by date Show all posts

Tuesday, January 21, 2014

Clementine - The Legacy, Twenty Years On

Engineering model of the Clementine spacecraft in the Lunar Exploration Vehicles exhibit at the National Air and Space Museum. Interstage and solid rocket motor (bottom half) was discarded before insertion into lunar orbit.
Paul D. Spudis
Smithsonian Air & Space

The first spacecraft to globally map the Moon left lunar orbit on May 3, 1994.  Clementine, a joint Department of Defense-NASA mission, had systematically mapped the Moon’s surface over 71 days, collecting almost 2 million images.  For the first time, scientists could put results of the Apollo lunar sample studies into a regional, and ultimately, a global context.  Clementine collected special data products, including broadband thermal, high resolution and star tracker images for a variety of special studies.  But in addition to this new knowledge of lunar processes and history, the mission led a wave of renewed interest in the processes and history of the Moon, which in turn, spurred a commitment to return there with both machines and people.  We peeked into the Moon’s cold, dark areas near the poles and stood on the edge of a revolution in lunar science.

Prior to Clementine, good topographic maps only existed for areas under the ground tracks of the orbital Apollo spacecraft.  From Clementine’s laser ranging data, we obtained our first global topographic map of the Moon.  It revealed the vast extent and superb preservation state of the South Pole-Aitken (SPA) basin and confirmed many large-scale features mapped or inferred from only a few clues provided by isolated landforms.  Correlated with gravity information derived from radio tracking, we produced a map of crustal thickness, thereby showing that the crust thins under the floors of the largest impact basins.

Two cameras (with eleven filters) covered the spectral range of 415 to 1900 nm, where absorption bands of the major lunar rock-forming minerals (plagioclase, pyroxene and olivine) are found.  Varying proportions of these minerals make up the suite of lunar rocks.  Global color maps made from these spectral images show the distribution of rock types on the Moon.  The uppermost lunar crust is a mixed zone, where composition varies widely with location.  Below this zone is a layer of nearly pure anorthosite, a rock type made up solely of plagioclase feldspar (formed during the global melting event that created the crust).  Craters and large basins act as natural “drill holes” in the crust, exposing deeper levels of the Moon.  The deepest parts of the interior (and possibly the upper mantle) are exposed at the surface within the floor of the enormous SPA basin on the far side of the Moon.

Topographic map of the Moon made from Clementine laser altimetry in mid-latitudes and stereo images near the poles. Large depression in southern far side is the South Pole-Aitken basin.
Clementine showed us the nature and extent of the poles of the Moon, including peaks of near permanent sun-illumination and crater interiors in permanent darkness.  From his first look at the poles, Gene Shoemaker (Leader of the Clementine Science Team) got an inkling that something interesting was going on there.  Gene was convinced that water ice might be present, an idea about which I had always been skeptical.  At that time, no trace of hydration had ever been found in lunar minerals and the prevailing wisdom was that the Moon is now and always had been bone dry.  With Gene arguing to keep an open mind and Stu Nozette (Deputy Program Manager) devising a bistatic radio frequency (RF) experiment to use the spacecraft transmitter to “peek” into the dark areas of the poles, we moved ahead on planning the observations.

To my astonishment (and delight), a pass over the south pole of the Moon showed evidence for enhanced circular polarization ratio (CPR) – a possible indicator of the presence of ice.  A control orbit over a nearby sunlit area showed no such evidence.  However, CPR is not a unique determinant for ice, as rocky, rough surfaces and ice deposits both show high CPR.  It took a couple of years to reduce and fully understand the data, but collection of the bistatic collection was successful.  In part, our ice interpretation was supported by the discovery of water ice at the poles of Mercury (a planet very similar to the Moon).  We published our results in Science magazine in December 1996, setting off a media frenzy and a decade of scientific argument and counter-argument about the interpretation of radar data for the lunar poles (an argument that continues to this day, despite subsequent confirmation of lunar polar water from several other techniques).

Along with Clementine’s success came a growing interest in lunar resources and a new appreciation for the complexity of the Moon.  This interest led to the selection of Lunar Prospector (LP) as the first PI-led mission of NASA’s new, low-cost Discovery series of planetary probes.  LP flew to the Moon in 1998 and carried instruments complementary to the data produced by Clementine, including a gamma-ray spectrometer to map global elemental composition, magnetic and gravity measurements, and a neutron spectrometer to map the distribution of hydrogen.  LP found enhanced concentrations of hydrogen at both poles, again suggesting that water ice was probably present.  The debate on the abundance and physical nature of the water ice continued, with estimates ranging from a simple enrichment of solar wind implanted hydrogen in polar soils, to substantial quantities of water ice trapped in the dark, cold regions of the poles.

Buttressed by this new information, the Moon became an attractive destination for robotic and human missions.  With direct evidence for significant amounts of hydrogen (regardless of form) on the surface, there now was a known resource that would support long-term human presence.  This hydrogen discovery was complemented by the identification in Clementine images of several areas near the pole that remain sunlit for substantial fractions of the year – not quite the “peaks of eternal light” first proposed by French astronomer Camille Flammarion in 1879 but something very close to it.  The availability of material and energy resources  – the two biggest necessities for permanent human presence on the Moon – was confirmed in one fell swoop.  Combined, the results of Clementine and LP finally gave scientists the Lunar Polar Orbiter mission we had long sought.  These two missions certified the possibility of using lunar resources to provision ourselves in space, permanently establishing the Moon as a valuable, enabling asset for human spaceflight.  Remaining was to verify and extend the radar results from Clementine and map the ice deposits of the poles.

The Clementine bistatic experiment led to the development of an RF transponder called Mini-SGLS (Space Ground Link System), which flew on the Air Force mission MightySat II in 2000.  This experiment miniaturized the RF systems necessary for a low mass, low power imaging radar.  With the 2008 inclusion of our Mini-SAR on India’s Chandryaan-1 lunar orbiter, we finally got the chance to build and fly such a system.  Chandrayaan-1 not only mapped the high CPR material at both poles, it also carried a spectrometer (the Moon Mineralogy Mapper, or M3) that discovered large amounts of adsorbed surface water (H2O) and hydroxyl (OH) at high latitudes.  Coupled with the measurement of exospheric water above the south pole by its Moon Impact Probe, Chandrayaan-1 significantly advanced our understanding of polar water, revealing it to be abundant and present in more varied forms on the Moon than had previously been imagined.

Mosaic of Clementine images of the south pole of the Moon. Dark regions contain water ice and small areas near pole are sunlit for significant fractions of the lunar day.
The ever increasing weight of evidence for the presence of significant amounts of water at the lunar poles led to the LCROSS experiment being “piggybacked” on NASA’s 2008 Lunar Reconnaissance Orbiter (LRO) mission.  LCROSS was a relatively inexpensive add-on, designed to observe the collision of the LRO launch vehicle’s Centaur upper stage with the lunar surface, looking for water in the ejecta plume of that impact.  Water in both vapor and solid form was observed, suggesting the presence of water ice in the floor of the crater Cabaeus (at concentration levels between 5 and 10 weight percent).  LRO orbits the Moon and collects data to this day.  Although much remains unknown about lunar polar water, we now know for certain that it exists; such knowledge has completely revised our thinking about the future use and habitation of the Moon.

The Clementine programmatic template has influenced spaceflight for the last 20 years.  The Europeans flew SMART-1 to the Moon in 2002, largely as a technology demonstration mission with goals very similar to those of Clementine.  NASA directed the Applied Physics Laboratory (APL) to fly Near-Earth Asteroid Rendezvous (NEAR) to the asteroid Eros in 1995 as a Discovery mission, attaining the asteroid exploration opportunity missed when control of the Clementine spacecraft was lost after leaving the Moon.  India’s Chandrayaan-1 was of a size and payload scope similar to Clementine.  The selection of LCROSS as a low-cost, fast-tracked, limited objectives mission further extended use of the Clementine paradigm.

The “Faster-Better-Cheaper” mission model, once panned by some in the spaceflight community, is now recognized as a preferred mode of operations, absent the emotional baggage of that name.  A limited objectives mission that flies is more desirable than a gold-plated one that sits forever on the drawing board.  While some missions do require significant levels of fiscal and technical resources to attain their objectives, an important lesson of Clementine is that for most scientific and exploration goals, “better” is the enemy of  “good enough.”  Space missions require smart, lean management; they should not be charge codes for feeding the beast of organizational overhead.  Clementine was lean and fast; perhaps we would have made fewer mistakes had the pace been a bit slower, but overall the mission gave us a vast, high-quality dataset, still extensively used to this day.  The Naval Research Laboratory transferred the Clementine engineering model to the Smithsonian in 2002.  The spacecraft hangs today in the Air and Space Museum, just above the Apollo Lunar Module.

It is probably not too much of an exaggeration to say that Clementine changed the direction of the American space program.  After the failure of SEI in 1990-1992, NASA was left with no long-term strategic direction.  For the first time in its history, NASA had no follow-on program to Shuttle-Station, despite attempts by Dan Goldin and others to secure approval for a human mission to Mars (then and now, a bridge too far – both technically and financially).  This programmatic stasis continued until 2003, when the tragic loss of Columbia led to a top-down review of U.S. space goals.  Because Clementine had documented its strategic value, the Moon once again became an attractive destination for future robotic and human missions.  The resulting Vision for Space Exploration (VSE) in 2004 made the Moon the centerpiece of a new American effort beyond low Earth orbit.  While Mars was vaguely discussed as an eventual (not ultimate) objective, the activities to be done on the Moon were specified in detail in the VSE, particularly with regard to the use of its material and energy resources to build a sustainable program.  Regrettably, various factors combined to subvert the Vision, thereby ending the strategic direction of America’s civil space program.

Clementine was a watershed, the hinge point that forever changed the nature of space policy debates.  A fundamentally different way forward is now possible in space – one of extensibility, sustainability and permanence.  Once an outlandish idea from science fiction, we have found that lunar resources can be used to create new capabilities in space, a welcome genie that cannot be put back in the bottle.  Americans need to ask why their national space program was diverted from such a sustainable path.  We cannot afford to remain behind while others plan and fly missions to understand and exploit the Moon’s resources.  Our path forward into the universe is clear.  In order to remain a world leader in space utilization and development – and a participant in and beneficiary of a new cislunar economy – the United States must again direct her sights and energies toward the Moon.

Note: Background history for the Clementine mission is described in a companion post at my Spudis Lunar Resources blog, HERE.

Originally published at his Smithsonian Air & Space blog The Once and Future Moon, Dr. Spudis is a senior staff scientist at the Lunar and Planetary Institute. The opinions expressed are those of the author but are better informed than average.

Monday, April 8, 2013

The Mystery of Shackleton Crater

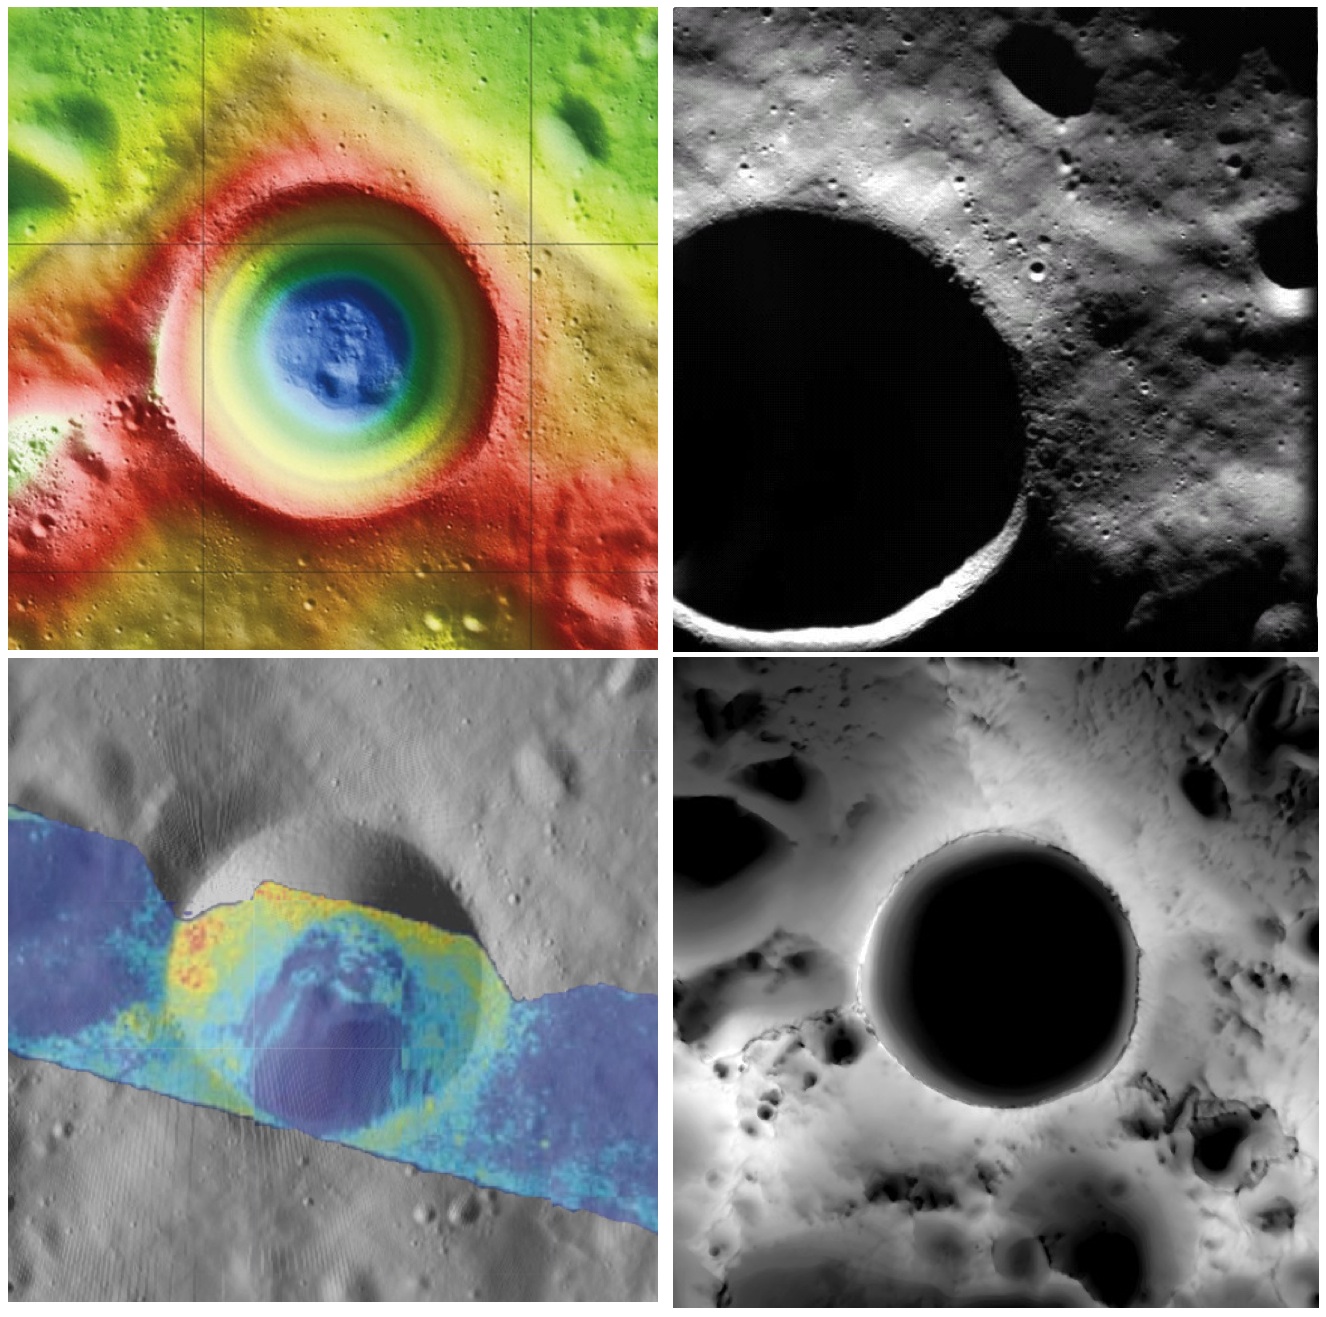
Shackleton crater, Earth's Moon. Clockwise from top left: topography from (LOLA) laser altimetry, photography from ESA SMART-1 mission, lighting map (relative isolation - brighter indicates longer periods of illumination) from LROC data, Mini-RF Circular Polarization Ratio (CPR) image draped over shaded relief. The crater is about 20 km across.
Paul D. Spudis
The Once and Future Moon
Smithsonian Air & Space


Though unremarkable in appearance compared to the roughly 4,000 craters on the Moon in its size range, the 20 km diameter crater Shackleton has been the source of relentless scientific controversy for the past 20 years.  Shackleton is located at the south pole of the Moon; indeed, its near side rim is the precise location of the geographic pole itself.   Its location makes observation by Earth-based telescopes difficult and it was not well photographed by the Lunar Orbiter series (our principal source of lunar images) of the 1960s.  That all changed in 1994 with the flight of the joint DoD-NASA mission to the Moon, Clementine.

Clementine carried cameras that globally imaged the Moon in eleven visible and near-infrared wavelengths.  In addition, it mapped the surface and lighting of the poles of the Moon at uniform resolution over the course of almost three lunar days (74 Earth days).  When the Science Team first saw the south polar mosaic, the extent of darkness in the map was striking.  Because the Moon’s spin axis is close to perpendicular to the ecliptic plane, the Sun is always at the horizon at the lunar poles.  Instead of rising and setting, the Sun circles around the poles at or near the horizon.  Because of this grazing incidence, an area in a topographic depression may be in permanent shadow.  And so it appeared for Shackleton crater in the Clementine data, setting off bells in the heads of the Science Team.

Intuitive selection from HDTV still frame captured by Japan's lunar orbiter SELENE-1 (Kaguya) in 2008 shows Shackleton, with the Moon's south pole on its rim (upper left) in relation to Earth and Malapert Massif, part of the nearside rim of the ancient South Pole-Aitken impact basin, along the line of sight. Shackleton's interior and the craters between it and Malapert, are permanently shadowed interiors (PSR), unmapped before the 21st century [JAXA/NHK/SELENE].
A key controversy of the post-Apollo era was whether the lunar poles might contain water or not.  Although the Apollo samples had been studied and found to be “bone-dry,” we had not been to the poles on any Apollo mission.  We knew that any shadowed areas had to be extremely cold as well as permanently dark.  As water-bearing debris in the form of asteroids and comets constantly strike the Moon, it was thought that some of that water might get into a polar “cold trap” and would be kept there (essentially) forever – billions of years of impacting cosmic “debris” can add up.

Clementine was not configured to measure the presence of water, but a cleverly improvised experiment used the spacecraft’s data transmitter to beam radio waves into the dark regions near the poles and listen to their reflected echoes on the enormous (70 m) dish antenna of NASA’s Deep Space Network.  Interestingly, the reflections indicated an enhancement of “same sense” polarization within the (very large) resolution cell that contained Shackleton crater.  A collect of data from a nearby sunlit area (taken as an experimental control) did not show this peak.  The Clementine team interpreted the RF peak as evidence for the presence of a few percent water ice within the dark, cold interior of Shackleton crater.  The media quickly spread the startling news about water on our “bone-dry” Moon.

Shackleton, as seen in a joint 70 mm radar experiment collected by radio telescopes at Greenbank and Arecebo during a favorable libration opportunity in 2006.
Such a controversial conclusion did not go unchallenged.  Some in the radar community argued that abundant wavelength-sized rocks on the surface were the source of the enhanced same sense reflection.  Since the lunar surface is indeed rocky, this interpretation could not be ruled out.

Then a few years later, the Lunar Prospector (LP) mission found an enhancement of hydrogen concentration at both poles of the Moon; as hydrogen is a major constituent of water, the idea ice exists in the dark areas gained credence and has lead to a decade-long scientific search (using a variety of techniques) for lunar polar ice.  Though many areas near the poles were studied in detail, attention continued to be drawn back to Shackleton and the area near the south pole.

From studying Clementine images, we discovered that part of the rim crest of Shackleton is one of the most sunlit areas on the Moon.  Now we had a double-attraction: constant sunlight with water ice nearby.  At a press briefing in 1996, I called this area of water and sunlight “the most valuable piece of real estate in the Solar System.” Nothing found subsequently has changed my mind on that judgment.

So what have we learned about Shackleton lately?  Many different, new sensors have flown to the Moon in the last few years, including radar, ultraviolet (UV) imaging, laser reflections, and low-light level imaging.  And yet again, Shackleton crater continues to confound us with contradictory evidence, both for and against the presence of water ice in its interior.

In 2009, the question regarding the presence of water ice somewhere near the lunar south pole was answered when the LCROSS impactor threw up a cloud of water vapor and ice particles during its collision with the floor of the nearby crater Cabaeus.  Spectral mapping instruments on three different spacecraft (Chandrayaan-1, Cassini, and EPOXI) documented the presence of adsorbed water on the lunar surface, increasing in concentration with latitude toward both poles.  A small impact probe flown by India (MIP) passed through a water vapor zone in the exosphere just above the lunar south pole.  And radar images from Mini-RF, our radar imaging experiment on both Chandrayaan-1 and Lunar Reconnaissance Orbiter (LRO), found evidence of high same sense reflections (just as Clementine had suggested in 1994) within the interior of Shackleton crater.

LRO Mini-RF instrument radar data indicate the walls of Shackleton crater may, indeed, hold ice, confirming exacting measurements of laser altimeter (LOLA) point brightness studies revealed in June. Actual observations (CPR) are compared to calculated radar values for 0.5% to 10% ice. Illustration to post "Mini-RF adds to evidence of ice on Shackleton walls," September 1, 2012 [NASA ].
These new lines of supporting evidence were countered by Japanese researchers, whose Kaguya spacecraft imaged the interior of the crater and found morphology similar to other lunar craters in the same size-class.  But no one had ever claimed that the interior of Shackleton was a skating rink of pure ice – the lunar polar ice is partly covered by waterless dust and mixed with an unknown amount of dry regolith.

Interpretation of the new data continues to vex us.  The LOLA (laser altimeter) team on LRO recently published a paper that documents the high reflectivity (at 1 micron wavelength) of the walls of Shackleton.  Although the team’s favored interpretation is that this is caused by a constant exposure of fresh material on a steep slope, they also note that it is consistent with the presence of water ice on the walls of the crater.

In addition, a team analyzing neutron spectrometer data from both LP and LRO found evidence in the fast neutron data (never before analyzed) that water in the interior of Shackleton is a possible explanation for its signal.  Detailed analysis of the Mini-RF data for Shackleton corrected for its steep wall slopes and found that the presence of 5-10 wt.% water there provides the best model fit to the observed data.  Newly obtained UV images from LRO show the existence of water frost in the interiors of the craters Haworth and Shackleton, and the neutron detector on LRO shows enhanced hydrogen within both Shoemaker and Shackleton craters.  The Japanese team from Kaguya continue to insist that the no-ice interpretation is the correct one.

So we are left with a mystery.  Some evidence is pro-ice and some is contra-ice.  I find it interesting that for most of the investigators, new data does not necessarily change any minds, but tends to be interpreted in a way most favorable to their previously published ideas.  This should not be terribly surprising; the people who have argued for some specific interpretation presumably did so for good reasons and desire hard and clear-cut evidence to the contrary before abandoning a previously held position, one no doubt reached after much thought and soul-searching.

Less so, but still-mysterious Shackleton, "twice as deep as the Grand Canyon," from "Tour of the Moon," a 2:30 video prepared by the Science Visualization Studio (SVS) at Goddard Space Flight Center in 2012 [NASA/GSFC/SVS].
The way to unravel the water-ice mystery is to go to the surface of the lunar south pole (or both poles) and measure the composition of the surfaces in question.  Getting a definitive answer about the nature of lunar water would be game changing.   Some say the bigger mystery is:  Why hasn’t the United States sent a rover to the south pole of the Moon to take a closer look?

Originally published April 8, 2013 at his Smithsonian Air & Space blog The Once and Future Moon, Dr. Spudis is a senior staff scientist at the Lunar and Planetary Institute. The opinions expressed are those of the author but are better informed than average.
Related Posts:
Mini-RF adds to evidence of ice on Shackleton walls (September 1, 2012)
Shackleton harbors ice after all (June 12, 2012)
1000 Day Anniversary of LROC Imaging (March 27, 2012)
Shackleton on a Summer's Day (March 26, 2012)
Shadowed fluffy lunar frost detected in starlight (January 14, 2012)
Shackleton: Out of the Shadows (September 17, 2009)

Friday, May 23, 2014

Punching through Abel C

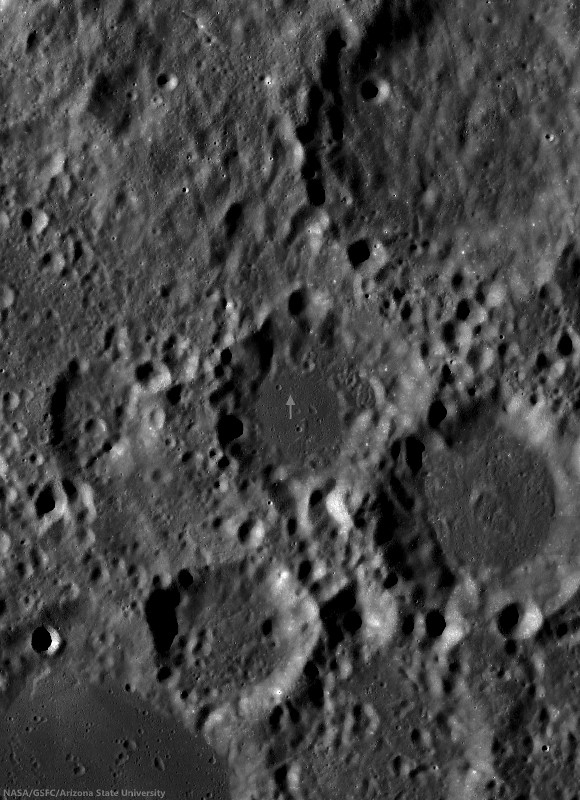
Excavation on the floor of Abel C. A bench crater in the pyroclastic deposit mantling the floor of Abel C. The impactor appears to have punched through multiple layers, giving the 100 meter crater an irregular, stepped appearance. LROC NAC observation M1153673248R, LRO orbit 21990, May 2, 2014; 68.8° incidence angle, resolution 75 cm from 72.53 km [NASA/GSFC/Arizona State University].
H. Meyer
LROC News System

Lunar craters less than between approximately 15-20 km in size are usually bowl-shaped, so the crater above, excavating the floor of Abel C (41.5 km; 36.72°S, 82.5°E) has a somewhat irregular morphology relative to most craters of its size (about 100 meters).

This crater is characterized by its block-strewn, hummocky floor and low-relief rim. The step-like or benched appearance most evident in the northeastern portion of the wall is due to a strength discontinuity. Such discontinuity indicates that the impact penetrated through two materials of different strengths. Lab experiments have shown that the bench crater morphology forms when the surface layer is composed of thin and poorly consolidated regolith and the subsurface is composed of harder, more coherent material.

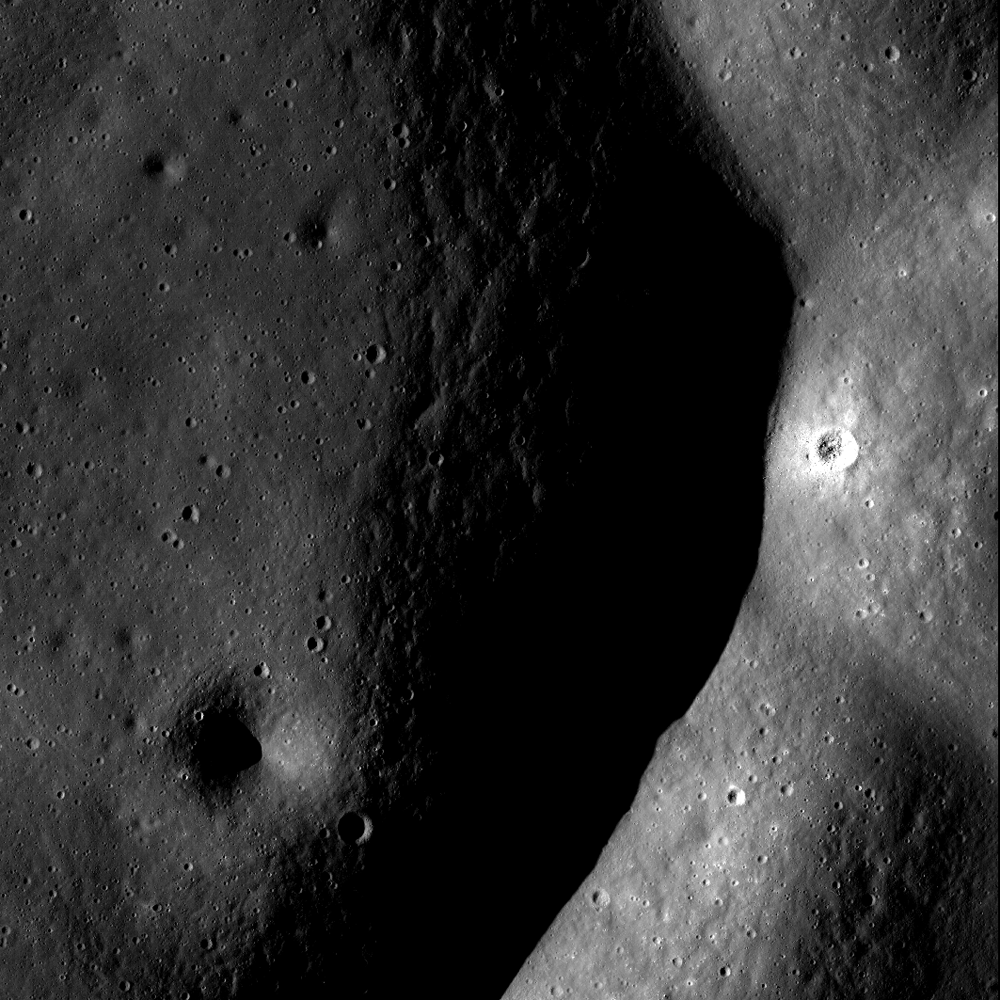
Small relatively fresh excavation, the 100 meter crater right of center shown in context of the full, 3.6 km-wide field of view swept up in LROC NAC observation M1153673248R, May 2, 2014 [NASA/GSFC/Arizona State University].
In some cases, the underlying material is bedrock, evidenced by an abundance of boulders. So, what did the impactor punch through at the surface? Usually regolith is the culprit, but further investigation of the floor of Abel C suggests that it may not be regolith alone.

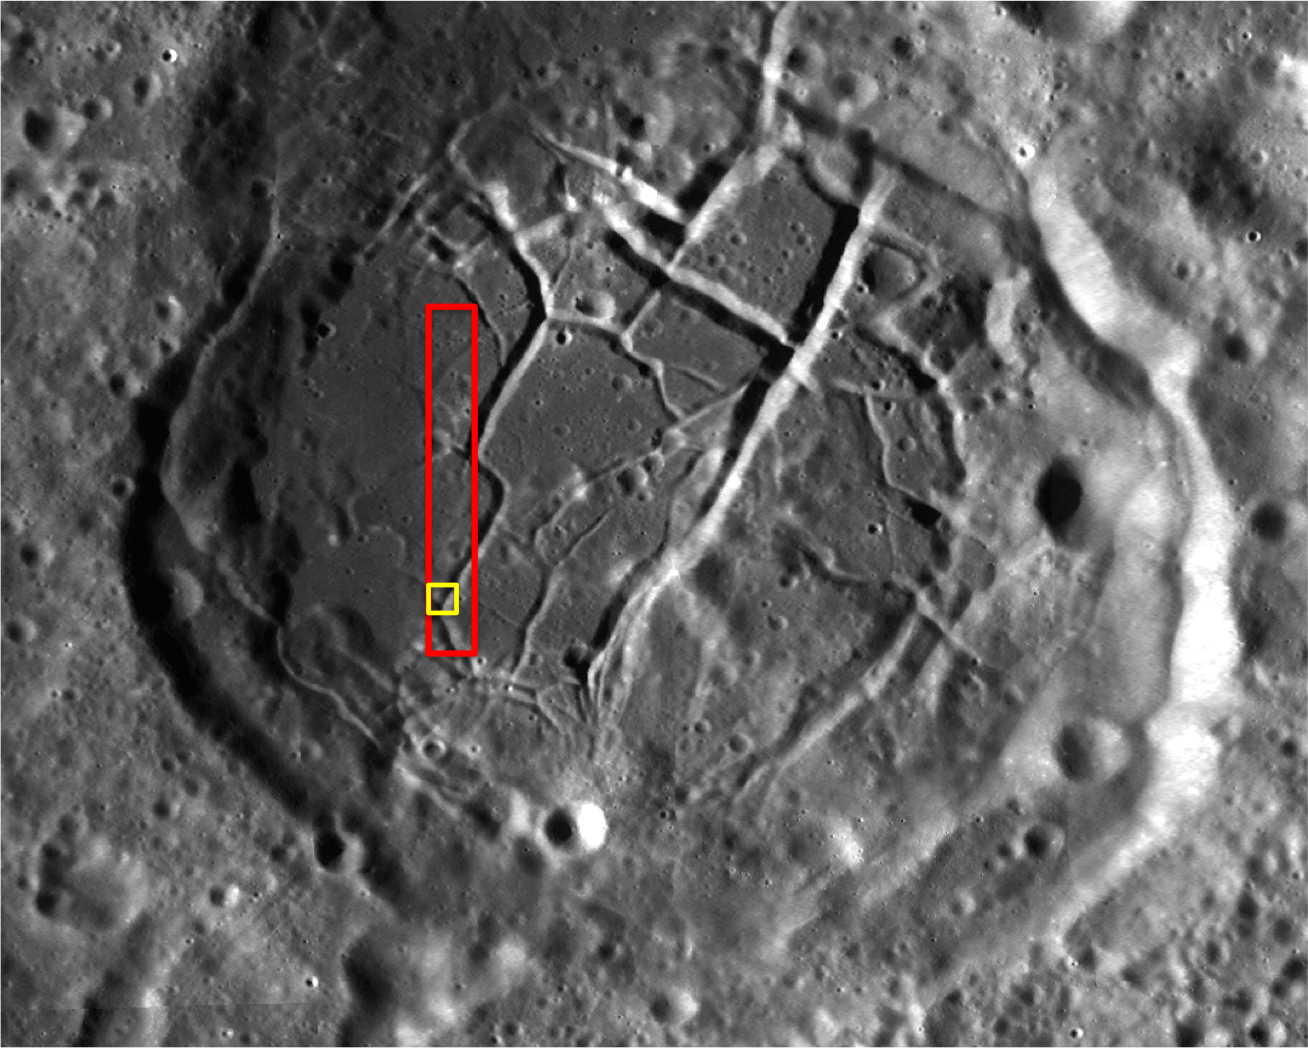
Ancient Abel C (41.5 km; 36.72°S, 82.5°E), on the northwest frontier of Mare Australe, has a smooth floor of relatively low reflectance, compared with it's equally eroded neighbors. Arrow marks the location of the 100 meter crater presented at high resolution above. LROC 100 meter Wide Angle Camera (WAC) global mosaic [NASA/GSFC/Arizona State University].
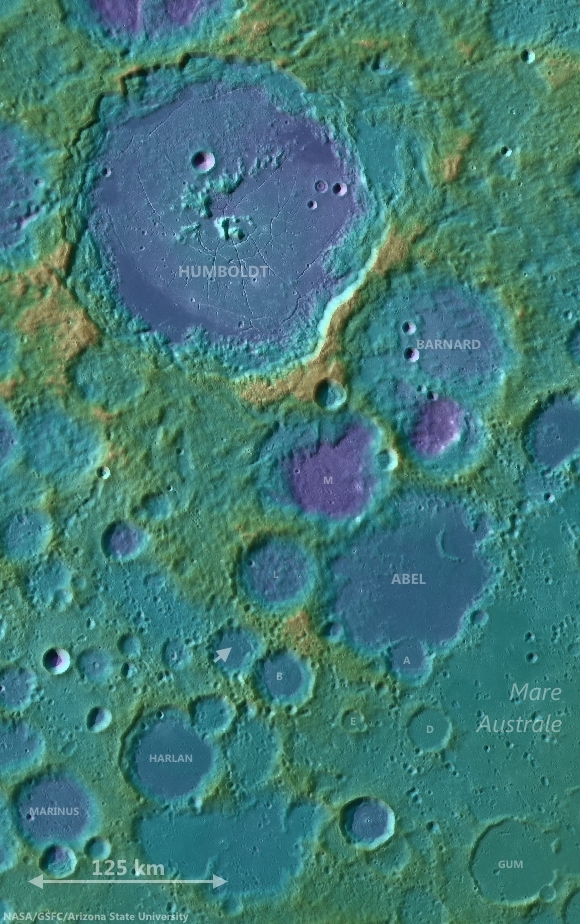
Abel C is a 36 km diameter crater on the southeastern limb of the Moon, just off the northwest edge of Mare Australe, a large region dominated by volcanic activity. Clementine (1994) color ratio images are extremely useful in identifying nonmare deposits since non basaltic compositions tend to stick out when Clementine images are placed in the proper color space. Three bands (415 nm, 750 nm, and 1000 nm) from the Clementine UVVIS camera were used to create the false-color image below.

Clementine (1994) false color image of the Mare Australe region with Abel C off the western edge. The floor of Abel C appears more red than the surrounding highlands, along with a clear indication of similar pyroclastic exposure like the multiple indications within Mare Australe   [NASA/GSFC/Arizona State University].
The three bands were ratioed to control the colors of the false-color image. The 750/415 ratio controls the red component, which is an indication of low titanium or high glass content as found in mature lunar regolith and to a greater degree pyroclastic deposits. The 750/1000 ratio controls the green component and is an indicator of the amount of iron on the surface. The 415/750 ratio controls the blue component and indicates high titanium or bright slopes and albedos. In the Clementine false-color image, Abel C stands out  from the highlands and more closely resembles the nearby mare. The strong red component, combined with the low-reflectance, mantled floor seen in Abel C is indicative of a pyroclastic deposit.

Abel C is shown in relation to the terrain of the Moon's southeastern limb, between Humboldt crater and Mare Australe. LROC WAC-derived digital elevation model and 100 meter global mosaic data [NASA/GSFC/Arizona State University].
This pyroclastic deposit encompasses approximately 190 km2 and has been identified in studies of pyroclastic deposits across the Moon (Compositional analyses of lunar pyroclastic deposits by Gaddis et al. 2003). Because pyroclastic deposits have a mantled appearance,  they must be relatively thin. It's possible that the thin upper layer the impactor penetrated was partially composed of pyroclastics.

Related Posts:

Thursday, January 23, 2014

A colorful history of floor-fractured Komarov

Small fresh crater in Komarov
A small, fresh crater dots the wall of a fracture in the floor of Komarov crater. An approximately 2.5 km-wide field of view from LROC NAC frame M130653607, LRO orbit 4388, June 8, 2010; incidence angle 71.7° at 63 cm per pixel resolution from 60.73 km [NASA/GSFC/Arizona State University].
H. Meyer
LROC News System

A small, fresh crater can be seen on the right side of Today's Featured Image on the floor of Komarov crater. The crater was formed when an impactor smashed into the wall of one of the fractures (or graben) in the crater floor. Some of the ejecta from the impact can be seen draping the wall of the graben. This graben is one of many in the floor of Komarov.

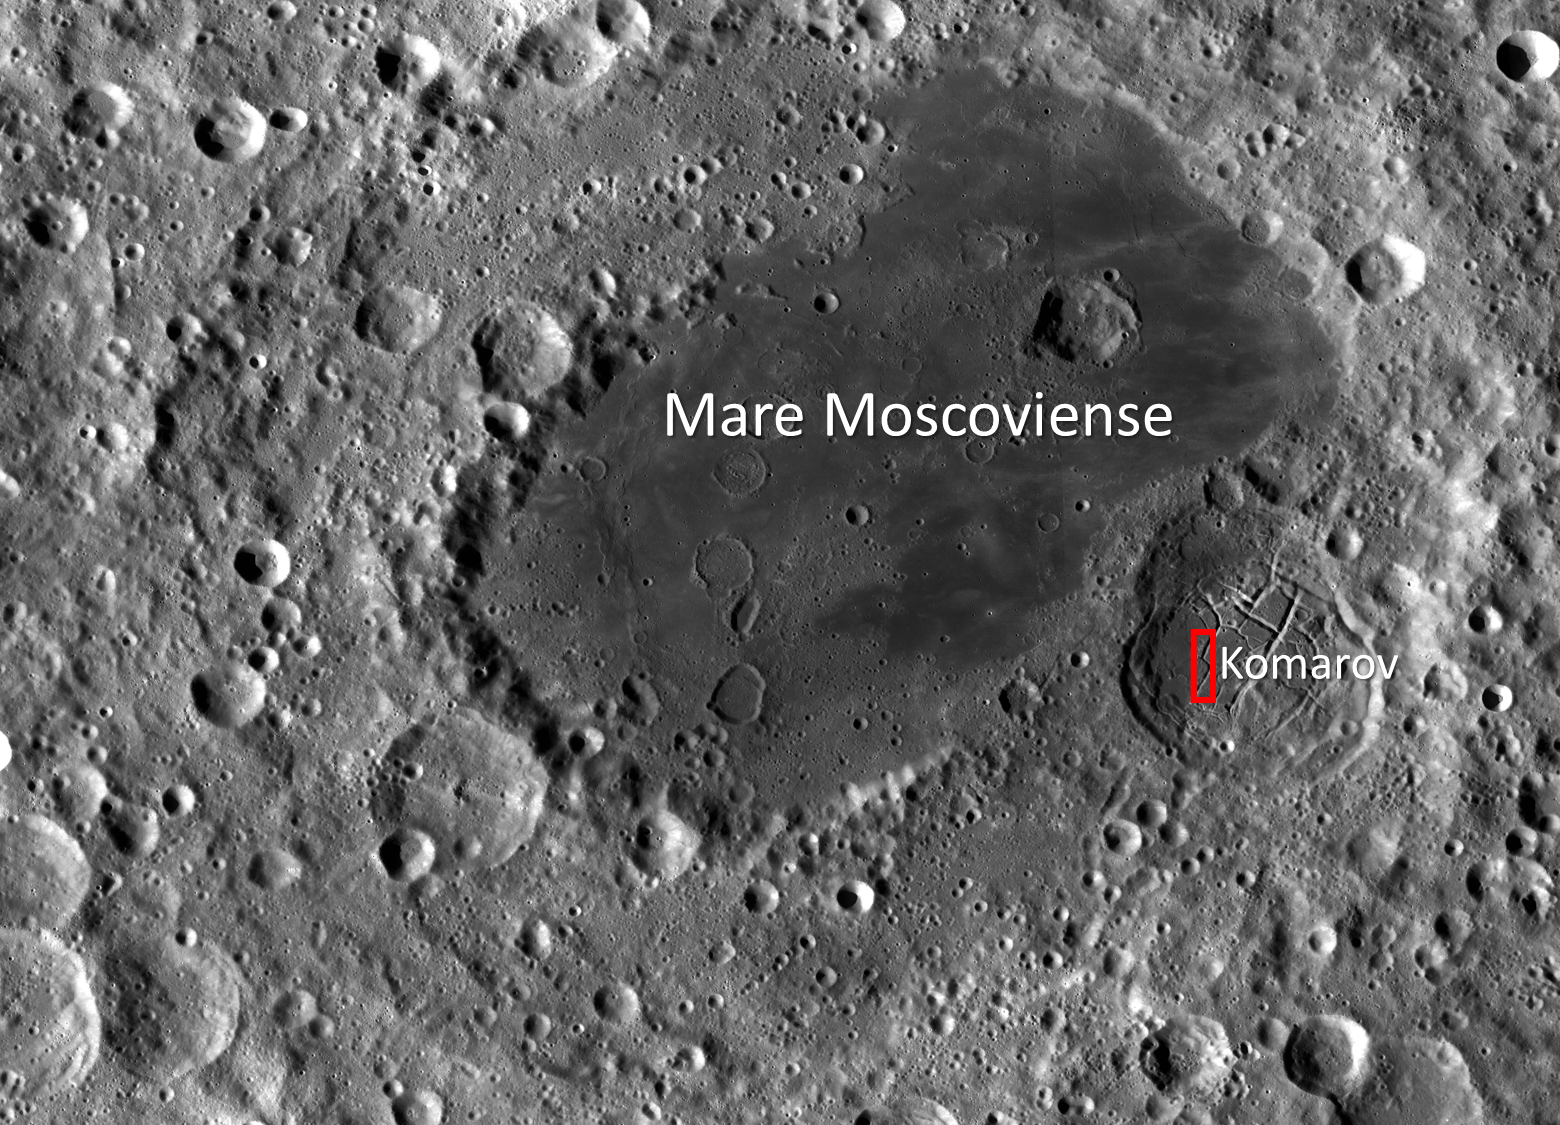
Komarov, best seen in the context image below, is known as a floor-fractured crater whose fractures likely formed through intrusive magmatic activity. The western portion of Komarov crater has been modified by the deposition of smooth, low albedo material and the formation of floor fractures. Is this the same low albedo mare basalts that filled nearby Mare Moscoviense?

Virtual view from an imaginary point 93 km over the lunar farside, south of Komarov. The LROC 302 ppd WAC mosaic draped over LOLA 128 laser ppd topography shows how pyroclastic flow overran the mare-filled Moscoviense floor. Both the famous long floor and Komarov are each well inside the larger, circular and less obvious Moscoviense basin [NASA/GSFC/LMMP/Arizona State University].

Komarov (context)
LROC Wide Angle Camera (WAC) context image of the western interior, wall and rim of floor-fractured Komarov, outlining the LROC Featured Image field of view (yellow), released January 22, 2014, with the frame of the LROC NAC observation from which it was derived outlined in red [NASA/GSFC/Arizona State University].
WAC2_Moscoviense-1560x1125
LROC WAC context image of Komarov crater (~80 km in diameter) relative to Mare Moscoviense (centered at 27.282°N, 148.122°E). The red box denotes the full NAC frame from which Today's Featured Image was taken. Image field of view is approximately 450 km wide [NASA/GSFC/Arizona State University].
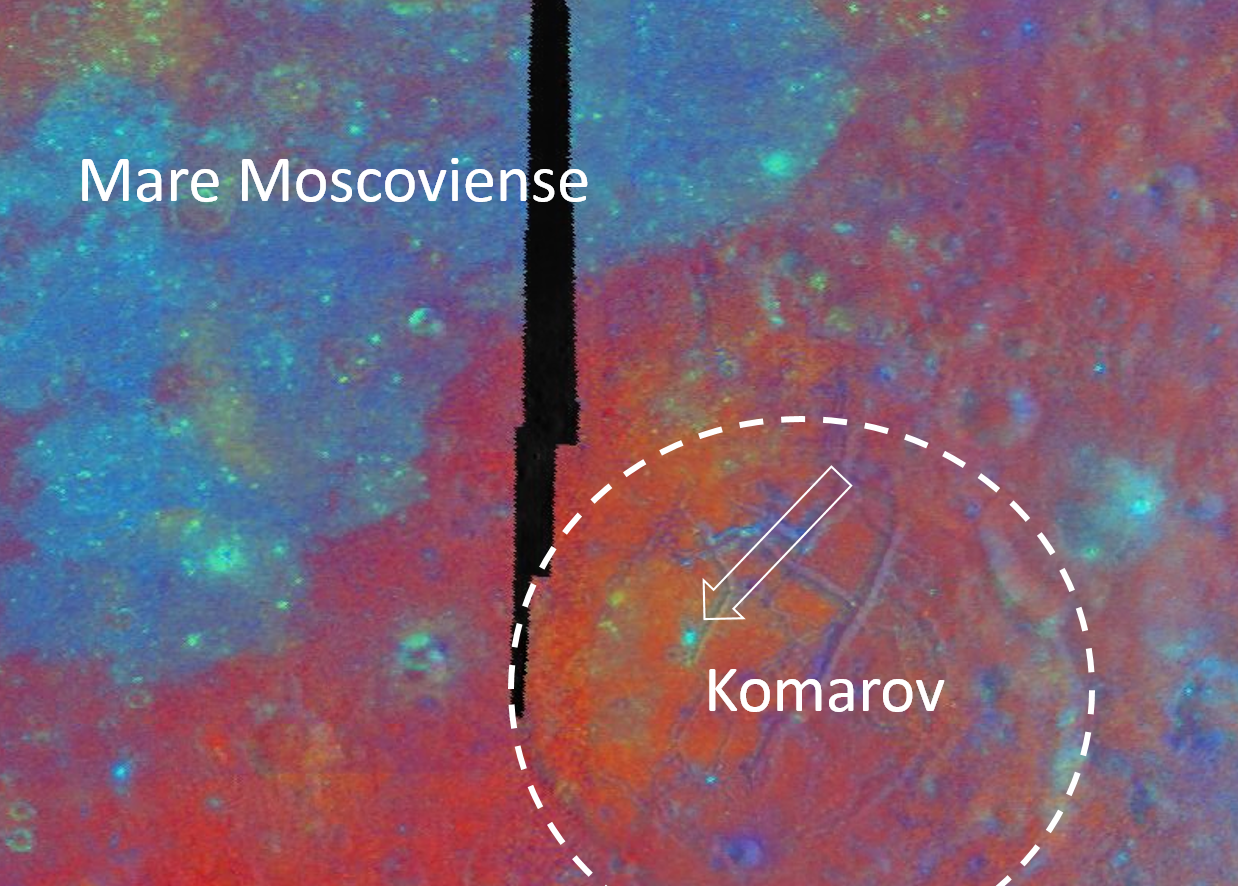
Though Komarov is located on the edge of Mare Moscoviense, it is not covered in the same smooth, low albedo mare basalts that are seen in the Moscoviense basin today (See WAC context image above and Clementine false-color image below). Compositional differences in and around Mare Moscoviense indicate multiple episodes of volcanic activity. Three bands (415 nm, 750 nm, and 1000 nm) from the Clementine UVVIS camera were used to create the false-color image below. The three bands were ratioed to control the colors of the false-color image. The 750/415 ratio controls the red component, which is an indication of low titanium or high glass content as found in mature lunar regolith and to a greater degree pyroclastic deposits. The 750/1000 ratio controls the green component and is an indicator of the amount of iron on the surface. The 415/750 ratio controls the blue component and indicates high titanium or bright slopes and albedos.

Clementine-1994-multispec-Komarov-1238x886
Clementine false-color multi-spectral mosaic of Komarov and Mare Moscoviense. The dashed circle denotes the rim of Komarov and the white arrow points to a fresh crater from the full NAC frame. Field of view approximately 180 km across [NASA/DOD/USGS/Arizona State University].
Notice in the false-color image above that Mare Moscoviense appears blue (higher in titanium since we know Mare Moscoviense is a low albedo feature), whereas Komarov appears red. Even within Komarov, the western side is more red (likely pyroclastics or low-titanium basalts) than the eastern side, which is comparable to deep red of the surrounding highlands (mature regolith). A crater in the NAC frame from which Today's Featured Image was taken appears bright blue and stands out from the rest of Komarov's floor. This bright blue color is likely due to the fact that this crater is fresh and has brought up unweathered (fresh) higher albedo material from depth. The fresh crater from the opening image is too small to be seen in the Clementine false-color image.

Investigate this complex region for yourself, HERE.

Related Posts:
Fresh crater in Komarov's fractured floor
Bah Humboldt!
Gassendi's Fractures
Atlas
Karpinskiy Floor Fractures

Thursday, June 10, 2010

LROC/LOLA: Hunting for Ancient Impact Basins


Figure 1: The lesser-known impact basin Freundlich-Sharonov (centered ~ 18.5°N, 175°E) is revealed in this Digital Terrain Model (DTM) created using data from LROC Wide-Angle Camera stereo images. Darker shades represent lower elevations and higher elevations by increasingly brighter shades. The diameter of the orange-colored ring is 595 km. DTM images like these allow scientists to inventory and study the morphologies of lunar basins. (Most of the mare-intrusion in this area is not readily apparent to the naked eye, presumably from orbit. The basin is north of the equator near the far side's central meridian. Mare material has largely become obscured by an overfill of ejecta from later impacts in the area.) [NASA/GSFC/Arizona State University/DLR].


Freundlich-Sharonov basin is all but invisible in this sampling of roughly the same region within the LROC Featured Image taken from the Clementine (1994) far side albedo mosaic [NASA/DOD].

Juergen Oberst
LROC News System

Large impact structures represent important time markers and clues to the early history of the Moon. Unfortunately, older basins may be highly degraded and are sometimes difficult to identify in images. Digital Terrain Models (DTMs) allow us to make more confident identifications of lunar basins and to study their morphologies. Large numbers of tentatively identified lunar impact basins, thoroughly listed in catalogs [1], are awaiting verification and detailed investigation of their ages.

Previous lunar topographic data sets used for studies of basins include the stereo model derived from Clementine images (5 km resolution). Currently, LRO's Lunar Orbiter Laser Altimeter (LOLA) is collecting a global topographic dataset. Due to LRO's polar orbit, the LOLA topographic products have high resolution (better than 40 meters) at the poles and suffer from orbit gaps of about a kilometer in equatorial areas.


Early LRO/LOLA laser altimetry of the Freundlich-Sharonov basin for comparison with LROC photographic elevation studies and the Clementine visible light albedo image of the region further above [NASA/GSFC].

The DTM of the Nubium basin (below) was made from overlapping LROC Wide-Angle Camera (WAC) images obtained in adjacent orbits. The topography has a uniform global spatial resolution of 500 meters, except at the poles where deep shadow results in areas of no coverage. Using these new WAC topographic data, several degraded impact structures were positively confirmed (opening image and Fig. 2).


Ancient Mare Nubium basin, as represented from data collected from the Lunar Reconnaissance Orbiter. Above the LROC Digital Terrain Model of the near side landmark is set atop a mosaic of multiple LROC Wide-Angle Camera images gathered in adjacent orbital passes.

Figure 2: The geographic location of the ancient Nubium basin (20°S, 344°E) is difficult to determine in images. The color-coded DTM (above-top) and the hill-shaded model (above-bottom) help show Nubium due to a slight topographic depression easily seen in the topographic map. Parts of a rim structure can be identified in the southeast, suggesting a basin diameter of about 675 km (black dashed), which is consistent with previous estimates of 690 km (gray dashed, [1]).

The mean rim height (the height difference between rim and basin floor) is ~1.8 km according to the DTM. The hill-shaded model accentuates Nubium's smooth floor [NASA/GSFC/Arizona State University/DLR].


Though Nubium is a near side landmark it's basin-like features are highly degraded, and it can hardly be recognized as a basin at all in the Clementine albedo mosaic. The LROC WAC elevation study validates a confirmation of Nubium as an authentic basin from laser altimetry gathered by Japan's first lunar orbiter Kaguya (SELENE-1) in 2009.


Finally, for even further context and comparison, here is a bonus look at Mare Nubium in a representation of LRO/LOLA laser data points from the initial release of LOLA data to the Planetary Data System, March 15, 2010 [NASA/GSFC].

Landmark features like Rupes Recta, the Straight Wall, hardly show at all in the early LOLA elevation study, at least not as one has come to expect. Instead, in both LROC and LOLA small-scale representations of data, the marked differences in grade on either side of this famous telescopic target stand out better than the fault itself.

Charles Wood at Lunar Picture of the Day (LPOD) takes up a learned comment on these newly released images of Mare Nubium, HERE.

Other basins, such as Mare Marginis, (Figure 3, below) are not yet positively confirmed.


Mare Marginis is more easily recognized as a telescopic landmark to viewers of an early evening's crescent Moon, straddling the eastern limb and the boundary between the near and far sides of the Moon, further east of Mare Crisium. Above top are the results of elevation analysis from stereoscopic LROC WAC photography of the region, near the equator. Above-bottom is roughly the same area as determined from initial LOLA laser altimetry data [NASA/GSFC/Arizona State University/DLR].

Figure 3: Confirming the location of Marginis basin (20°N, 84°E), with a proposed rim diameter of ~580 km (black dashed, [1]), is difficult. A chain of mountain peaks in the western area may represent remnants of a basin rim. However, this chain could also be part of the neighboring prominent Crisium basin, located to the west. With time the WAC and LOLA topographic maps will have higher resolution and more accuracy to help scientists better decipher the location, size, and relative ages of ancient lunar basins.


Mare Marginis was so-named because it's mare-infill was distinct in the highly-foreshortened and necessarily steep angled views from Earth prior to the Space Age. This mare inundation, whether it is truly distinct to Marginis or coincident with a nearby cataclysm, is still visible from lunar orbit. But it's most striking feature in the Clementine mosaic above, something completely invisible in any elevation study made so far, are countless swirl albedo markings -- perhaps the richest such field on the Moon. These features appear to coincide with a wide-spread, close-cropped crustal magnetic anomaly here, on the face of the Moon directly opposite, or "antipodal," to Mare Orientale. The latter needs little analysis to be confirmed as a basin.

[1] Wood C.A. (2004): Impact Basin Database.

Tuesday, March 26, 2013

Follow-up research on the effusive dome near Yangel

Under an early afternoon Sun subtle albedo contrasts stand out more than the 600 meters high effusive dome in Mare Vaporum, first discussed HERE, February 19. LROC Narrow Angle Camera (NAC) mosaic M1098830275LR, LRO orbit 14284, August 5, 2012; 1.28 meters resolution from 126.74 km [NASA/GSFC/Arizona State University].
Raffaello Lena and Barry Fitz-Gerald
GLR group

In a previous communication we reported a volcanic structure located some 40 km west-southwest of the crater Yangel in Mare Vaporum (16.44°N, 3.27°E), southeast of Sinus Fidei.

It is characterized by the presence of dark pyroclastic material, also distributed on the inner slope of the ruined crater immediately north of the elevated non-monogenetic volcanic dome, suggesting an ash type deposit.

The morphometric properties we reported (620 meters high, slope 13.4°) indicate the dome presumably formed during several stages of effusion, a process that may build up steep edifices  followed by a subsequent explosive phase of volcanism producing the dark pyroclastic deposit. In this follow-up we include further analysis and spectral data of the unusual volcanic construct.

Our closest available look at the 620 meter high effusive dome on the northern edge of Mare Vaporum, and its apparent dark mantle intrusion, disrupting the rim of an ancient ghost crater; a roughly 1600 by 3800 meter field of view, two contiguous strips from the full range captured in LROC NAC mosaic M168183822LR, orbit 9919, August 17, 2011; incidence angle 42.22° at 40 cm per pixel resolution from 24.42 km [NASA/GSFC/Arizona State University].

The northern flank of the dome partially covers the southern rim of a partially submerged pre-mare, impact crater (approx. 7 kms in diameter), which appears to have undergone subsidence to the east, where the craters wall is only visible as a feint 'ghost ring.' The height of the western rim is approximately 200 m above the mare surface, giving an indication of the vertical displacement affecting the eastern rim. This subsidence could be the consequence of crustal downwarp, but may also be a result of faulting, with the eastern wall being on the downthrow side of a north-south orientated fault. It is worth noting that a continuation of Rima Yangel to the west would intercept the crater rim at the position of the breach, though if this tectonic feature is related to the breach, it does not extend to the craters western rim. Evidence for subsidence or faulting is provided by the overall morphology of the dome and the rather 'off-center' appearance of the upper slopes relative to the apron as seen in Fig.1B with the apron to the west of an apparently greater extent than to the east. It is possible that if this apron was previously symmetrical, tilting would have lowered its level in the east with subsequent obscuration during the emplacement of the mare lavas, as is the case with the eastern crater rim.

Figure 1A and 1B - LROC (Arizona State University) Quickmap and NAC images show the effusive dome on the north edge of Mare Vaporum (A) and detail (B) showing possible vent complex (circled:B) and dark mantling (DM) on the ghost crater's southern wall. B: LROC NAC M181144987LR, LRO orbit 11810, January 14, 2012, scaled down from 1.3 meters per pixel resolution, from 128 km [NASA/GSFC/Arizona State University].
The dome itself appears to be divided into two distinct zones in elevation, the lower slopes comprising a relatively smooth textured debris apron of even albedo, and more rugged the upper slopes which appear to have a lower albedo surface layer overlying a subsurface of a higher albedo.

This may reflect mass wastage of the darker surface layers on steeper slopes to reveal either a fresh, low maturity soil beneath or soils of differing composition. The surface albedo of the northern flank appears lower than elsewhere on the dome, which may indicate the presence dark pyroclastic mantling deposit.

The summit of the dome is occupied by a number of rimless depressions, with the most conspicuous being roughly square in outline (approx. 400 m across) within which is a large smooth rimmed crater (approx. 150m diam). This square feature (Fig.2A) appears to be displaced slightly to the east of the dome summit, possibly as a result of subsidence which is discussed above. The square depression appears to be bounded by a fault scarp, whilst the smooth rimmed central crater within lacks a sharp rim, and may be of volcanic rather than an impact origin. This square depression and central crater may represent some form of vent complex.

The eastern side of the dome shows evidence of slope failure, with an arcuate scar cutting the upper eastern flank, beneath which the slope is modified by radial and sub radial grooves, possibly representing erosion gullies. This asymmetric slope failure affecting the eastern flanks may be related to the subsidence postulated above. This presumes that the dome was emplaced prior to any episodes of subsidence and therefore prone to de-stabilising slope modification occurring as a result.

To the north of the dome and lying on the inner slope of the ruined crater wall is an area covered by a low albedo mantle. These low albedo deposits are patchy, with a darker surface layer overlying a lighter subsurface, again possibly as a result of exposure of fresh, immature material or material of a differing composition.

Figure 2A - Full resolution (40 cm) resolution detail of depression and crater within - LROC NAC M168183822LR [NASA/GSFC/Arizona State University].
Figure 2B - Under high Sun, dark mantle deposits on ruined ghost crater rim and wall with adjacent lighter boulder field. LROC NAC observation M1103545264LR, spacecraft orbit 14944, September 29, 2012, angle of incidence 20.62° at 1.02 meters resolution from 126.06 km [NASA/GSFC/Arizona State University].
This low albedo area is flanked to the west by a zone where the albedo of the inner crater wall is considerably higher. A detailed view reveals that it is composed of multiple, often superimposed boulder trails that appear to have originated from exposures along the upper margins of the inner crater wall (Fig. 2B). These trails form a boulder trail field with the boulders responsible visible in considerable numbers lying on the crater floor. It is possible that the low albedo dark mantled area was previously more extensive, but that a large area of it was disrupted during the formation of the boulder trail field. Evidence for this can be seen in the form of isolated patches of darker materiel within the boulder trail field, which may represent surviving remnants of the original mantling. The upper slopes of the dark mantled areas are largely clear of trails but isolated boulders are visible. In contrast the lower slopes do contain both trails and boulders. This may indicate that the lack of trails on the upper slopes reflect a later phase of localised dark mantling that obscured any trails that were present, but left the boulders responsible still visible. The existence  of these multiple boulder tracks indicate a significant ground disturbance that dislodged large numbers of boulders from the crater wall. This may be related to the subsidence or down-faulting discussed above, or to volcanically induced seismic disturbance during the active phase of the domes growth.

The Clementine UVVIS ratio enhances color differences related to soil mineralogy and maturity. The color ratio image is obtained assigning the R750/R415, R750/R950 and R415/R750 into the red, green, and blue channels of a color image, respectively.

Figure 3 - Inset: Clementine 750nm imagery with pyroclastic deposit. Surrounding context: Clementine false color of the region obtained assigning the R750/R415, R750/R950 and R415/R750 into the red, green and blue channels, respectively. The volcanic construct with pyroclastic deposits is marked with an arrow and renders as blue [NASA/USGS/DOD].
The lunar highlands are depicted in red (old) and blue (younger) and the maria are depicted in yellow/orange (iron-rich, lower titanium) or blue (iron-rich, higher titanium). The pyroclastic deposit is characterized by a different color respect to the nearby soil and appears blue indicating an increased TiO2 content (Fig. 3). The LPD has a lower 750 nm albedo of about 0. 092, while the examined mare unit is similar to that of the undisturbed crater unit with a 750 nm albedo of about 0. 011, but the LPD has a higher R415/R750 ratio, and is spectrally bluer than the other examined units with lower R415/R750 ratios of ~0.60.

For the spectral study the Multiband Imager (MI) on the Selenological and Engineering Explorer (Selene) with both visible and near infrared coverage in the spectral bands at 415, 750, 900, 950, 1000, 1050, 1250, and 1550 nm have been used. The spectral data were normalized using the region of Sinus Aestuum 2 site and calibrated using bidirectional reflectance corrected Keck 120 color spectral data for Sinus Aestuum 2. The color ratio image obtained with Selene-1 MI and assigning the R750/R415, R750/R950 and R415/R750 into the red, green, and blue channels of a color image, confirms the results found with the Clementine imagery but with higher spatial resolution. According to preceding findings the dark material extends beyond the dome itself into the flooded crater to the north, suggesting an ash type deposit and displays a blue color with a compositional contrast between the whole dome and the mare based on the UVVIS ratios imagery (Fig. 4).

Figure 4 - Ratio color image from SELENE-1 (Kaguya) dataset in which the R750/R415, R750/R950 and R415/R750 are assigned to red, green and blue channels, respectively. A slight contrast enhancement was applied to the RGB image [JAXA/SELENE].
We have applied the TiO2 and FeO estimation equations by Lucey et al. (2000)*. The derived values for FeO and TiO2 are then converted to Fe and Ti elemental abundance by multiplication for the factor (56/72) and (48/80) respectively, according to the atomic weights of the constituent elements. According to the Clementine and Selene-1 color ratio images, the Ti map indicates that the pyroclastic deposit has a Ti contents between 5.0 and 6.2 wt% corresponding to a high TiO2 content of 8.4-10.2 wt%. The elemental abundances of the mare units correspond to a lower Titanium content of 2.7-2.9 wt% (4.5 - 4.8 wt % as TiO2). The Fe map, obtained with the method described by Lucey et al. (2000), shows that the LPD has a Fe contents between 13.4 wt% and 14.0 wt% (17.7 wt% - 18.0 wt% as FeO), with a slightly lower Fe content in the nearby mare soil.

We also used the Chandrayaan-1’s Moon Mineralogy Mapper (M3) data between 460 to 3000 nm. For this work M3 data at a resolution of 140 mpp were calibrated and photometrically corrected and converted to apparent reflectance. These spectra are not thermally corrected, so they are not analyzed for wavelengths longer than 2300 nm as these have a significant thermal emission component. In order to characterize the 1000 nm band a continuum removal method that enhances the characteristic of the 1000 nm absorption band was used. We fit a straight line between 750 and 1500 nm to remove the continuum.

Figure 5 - Image of study area from M3 (Chandrayaan-1) dataset (Left). The LPD, the northern crater and mare unit east of the crater are marked. At right, M3 spectra of the examined units [NASA/ISRO].
Figure 6 - M3 spectra of the pyroclastic deposit located on the surface of the volcanic dome, previous described by the authors, HERE.
In the mare unit and in the pyroclastic deposit spectra weak inflections over 1000 nm are detectable, but we wouldn't regard this as an unambiguous identification of olivine, because M3 spectra of high-olivine soils show a much broader absorption.

The spectral signature of olivine has a wide band centered beyond 1000 nm, while the pyroxenes displays a narrow trough around 1000 nm, with a minimum wavelength below 1000 nm, and a wide absorption band around 2000 nm. Interestingly, the dark pyroclastic deposit has a narrower absorption (centered at 970 nm) than the mare unit, such that it cannot be enriched in olivine when compared to the mare. Probably the previously detected Clementine-specific olivine signatures are only partially due to olivine but also due to mis-calibration. Although the continuum-removed M3 spectrum of the crater seems to be noisy, it displays three absorption bands centered at 920, 970 and 1029 nm, likely due to admixed quantity of pyroxenes and olivine.

The effusive dome (center) lords over the northern extremes of Mare Vaporum in this view of the north central nearside captured on Earth (stacked CCD image) and processed by Astronominsk, May 31, 2009. Twenty-one kilometer wide Conon crater adds some scale to the area, scoured out by the Imbrium basin-forming-impact 3.8 billion years ago. Under sunrise illumination, the dome's true height can be seen clearly [Astronominsk].
The Christiansen Feature (CF) from Gridded data record (GDR) level 3 data product of Diviner Lunar Radiometer Experiment/Lunar Reconnaissance Orbiter (Diviner) data were used for further analysis. The Lunar Reconnaissance Orbiter’s (LRO) Diviner Lunar Radiometer Experiment has a spatial resolution of 950 m per pixel. Diviner produces thermal emissivity data, and can provide compositional information from three wavelengths centered around 8 µm that are used to characterize the Christiansen Feature (CF), which is directly sensitive to silicate mineralogy and the bulk SiO2 content. Silicic minerals and lithologies exhibit shorter wavelength positions at 8 µm channel. For the study area, CF values of 8 µm are towards longer wavelength (CF ~ 8.3 µm) indicating less silicic composition.

Email: Raffaello Lena <gibbidomine@libero.it>  Barry Fitz-Gerald <barryfitz_gerald@hotmail.com>

REFERENCE: Lucey, P. G., Blewett, D. T., Jolliff, B.L.  Lunar iron and titanium abundance algorithms based on final processing of Clementine ultraviolet-visible images, J. Geophys. Res., 105(E8), 20,297–20,305 (2000)

(*) Mapping FeO and TiO2 content

Classic approaches to the estimation of  FeO and TiO2 are based on the evaluation of Clementine UVVIS reflectance. Lucey et al (2000) derive the equation:

Wt % FeO = 17.427θFe – 7.565

where θFe is calculated according to: θFe = - arctan [(R950 / R750) – yFe / R750 – xFe] as the polar angle in the R950 /R750  vs. R750 diagram with respect to the reference point (xFe, yFe ) = (0.08, 1.19).

Similarly for the abundance of TiO2 Lucey et al. (2000) obtain the relation:

Wt % TiO2 = 3.708 (θTi )5.979 with θTi =  arctan [(R415 / R750) – yTi / R750 – xTi] as the polar angle in the R415 /R750  vs. R750 diagram with respect to the reference point (xTi, yTi ) = (0.0, 0.42)

Tuesday, August 31, 2010

A review of all things Schrödinger

We end August with a long-running mystery: Why has the LRO LOLA "Image of the Week" not been updated since the middle of July? One answer may be that the LOLA topography of Schrödinger basin flagged on NASA center websites served as a reminder to complete the exacting new synergistic geological map of the far south, far side basin, released Monday, August 30:


Geologic map of Schrödinger basin, which formed when a huge object struck the moon, reveals a patchwork of lunar material, including the peak ring (inner brown ring), recent volcanic activity (red), cratering (yellow) and plains material (dark green and kelly green) [NASA/Scott Mest]." >Massive Image > Sensible Image

Elizabeth Zubritsky
NASA GSFC

Schrödinger is located near the moon's south pole, a region where pockets of permanent ice are thought to exist. The map will help researchers understand lunar geologic history and identify suitable landing sites for future exploration. Scott Mest, a research scientist with the Planetary Science Institute working at NASA's Goddard Space Flight Center in Greenbelt, Md., and his colleagues created this geologic map -- the most detailed one to date -- by combining topographic data from the Lunar Orbiter Laser Altimeter, a Goddard instrument aboard the 2009 Lunar Reconnaissance Orbiter, with images and spectral data from the earlier Clementine and Lunar Prospector missions.

From August 31, 2010 -
Detail from the Schrödinger basin geologic map released by NASA GSFC, August 31, 2010 highlighting the roughly 10 x 20 kilometer area of the eastern interior occupied by the intriguing pyroclastic formation. [NASA/GSFC/Scott Mest].

Schrödinger is an example of an intriguing type of basin called a peak-ring. Like the basin rim (brown outer ring), the smaller and more fragmented peak ring (brown inner ring) is a mountainous region of crust that rose up after a huge object, probably measuring 35-40 kilometers, or about 21-25 miles, smacked into the moon here. These areas of raised crust are the oldest rocks in the basin and just about the only material that wasn't melted by the heat from the object's impact. The melted material was spewed in all directions and formed the plains. Patches of plains material can have slightly different textures and albedo (indicated by dark green and kelly green), probably because they cooled at different times. Fractures (black lines) formed in the basin floor as the material cooled.


The Clementine image of the Schrödinger basin with geological map (2010). The three landing sites and corresponding 10 km EVA radius (20 km return trip) are outlined in white. The yellow numbers correspond to following scientific points of interest: 1 – Schrödinger’s melt sheet, 2 – Schrödinger’s inner ring, 3 – basaltic units, 4 – explosive volcanic unit, 5 – deep crustal fractures, 6 – ghost craters, 7 – secondary craters, 8 – ridged terrain. - From Kohout, O’Sullivan & Kring, et.al., Scientific Opportunities for Human Exploration of the Moon’s Schrödinger Basin [LPSC 2009 #1572] The Schrödinger Basin provides a diverse suite of scientific opportunities because of the superposition of several geologic processes and because of its relatively young age. Three possible landing sites were evaluated for human exploration.

Schrödinger Basin is one of the few areas near the moon's south pole with evidence of recent volcanic activity. This includes lava flows from volcanic activity on the surface (beige areas) as well as explosive eruptions from a vent inside the red area; this vent has brought up dark material that mantles the plains (red area, which is newer than the beige regions). Older volcanic material is spread over a wider range (gray and lime green). More recent cratering by smaller objects has scattered material (yellow areas) near the top of the basin. Next to that (very light green beside yellow) is a region with a knobby texture that suggests loose material that could have come from cratering outside the basin or from a landslide on the basin's rim.

From July 16, 2010 -
LOLA Image of the Week (since July 16, 2010) Schrödinger (centered -75.0˚, 132.4˚ E), "located on the lunar far side and within South Pole-Aitken Basin, is not visible from the Earth. Crater counts suggest that the basin is less than one billion years old, making it the second youngest impact basin on the Moon (the youngest being Orientale)."

From April 23, 2010 -
Mosaic of Clementine UVVIS images (750-nm band) of the Schrödinger Basin (312 km diameter). In addition to the prominent, dark, cone-shaped feature (white arrow), Schrödinger has an inner ring of mountains partially encircling the basin floor (a ‘peak ring complex’) and a network of radial and concentric fractures. The cone is a likely volcanic vent situated on a north- east trending floor fracture, and it has a 4.5 km x 8.6 km vent surrounded by dark, explosively emplaced or pyroclastic material and a low rim. The Schrödinger volcanic vent is one of the most distinctive single-vent cones observed on the Moon and resembles ‘dark halo craters’ like those on the floor of Alphonsus. (Projection is polar stereographic, centered on the basin at -75.0°S, 132.0°E) [NASA/DOD/USGS/ASU].

From April 23, 2010 -
LROC Narrow-Angle Camera (NAC) closeup of clustered craters on the lip of the Schrödinger pyroclastic cone, a Constellation Region of Interest (ROI). Although believed to be relatively young, these craters have a subdued appearance, a texture smoothed by micrometeor 'gardening' typical of older lunar surfaces) because they formed in loose pyroclastic material. LROC NAC Frame M108313384R, this view is 785 meters across [NASA/GSFC/Arizona State University].
"A particularly interesting and unusual feature was imaged by Mini-SAR almost by accident. Because of a timing error, we started a few mapping passes of the south pole early, before the scheduled start at 80° south latitude. Good thing we did! We covered the fresh, spectacular Schrödinger impact basin, on the lunar far side. Schrödinger shows an unusual, keyhole-shaped crater along a long fissure on the basin floor. This crater is surrounded by optically dark material, which has been interpreted as volcanic ash deposits. The new Mini-SAR image shows that this material is also dark in radar reflectivity, exactly what would be expected from a fine-grained, block-free deposit. Thus, our radar images confirm the geological interpretation first derived in 1994 from Clementine images."

- Paul Spudis
Smithsonian Air & Space
March 29, 2009
From February 21, 2008 -
Kaguya (SELENE-1) multi-band imager (MI) compositional and morphological study of the Schrödinger pyroclastic formation (75.3°S, 139.1°E) [JAXA/SELENE].


Clementine (1994) and Kaguya (2008-2009). Ultra-Violet & Visible light (750-nm) UVVIS image of Schrödinger basin. b) Schrödinger DMD image taken by SELENE MI 750 nm band. c) MI 1000 nm/1050 nm absorption depth ratio from 0.8 to 1.2. From Kobayashi & Ohtake, et.al., Estimating Composition of Dark Mantle Deposit in Schrödinger Basin Using SELENE Spectral Data [LPSC 2009 #1636] Dark Mantle Deposit (DMD) regions are considered to contain glassy or crystallized pyroclastic beads. We used the spectrum data acquired by SELENE Multi-band Imager to analyze a DMD in Schrödinger basin, and estimated the composition of the DMD.

From April 23, 2010 -
Moving north (top) in a polar orbit, Japan's Kaguya took extensive HDTV of the lunar far side, including this still showing the Schrödinger Basin interior. The low and relatively darker profile of the pyroclastic dome encircling the vent is right (east) of the image center [JAXA/SELENE].

From August 31, 2010 -
Earlier Kaguya (SELENE-1) image of the eastern interior of 312 km-wide Schrödinger. The subtle differences in geologic compositions are visible, in this very-close to true-color view from 2008, though in late morning illumination the darker Schrödinger pyroclastic formation (upper center right) is an unmistakable contrast with its surroundings, in color and cratering. [JAXA/NHK/SELENE].

Finally, with sincere appreciation for all the tireless efforts underway keeping the LRO mission working and healthy, in the words of the LROC team, we urge you not to hesitate to "explore the Schrödinger Constellation region of interest for yourself!"