
 |
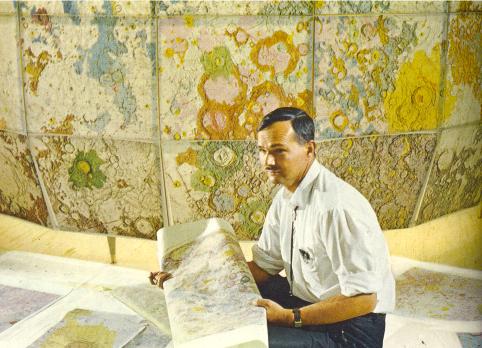
| Eugene Shoemaker with some of the first geological maps of the Moon, in Flagstaff, Arizona during the mid-1960's |
The Once & Future Moon
Smithsonian Air & Space
Many people are surprised when they learn that well before the first landing of Apollo in 1969, we already understood the geological history of the Moon. The idea that such a thing was even possible drew considerable skepticism during early preparations for landing on the Moon. The principles for the remote mapping of the geology of the Moon came from several closely related but distinct threads. Eugene M. Shoemaker, a geologist with the U. S. Geological Survey (USGS) who founded the Branch of Astrogeology, laid out the methodology in broad outline from and through the systematic study of lunar surface images in the early 1960s.
One of the basic principles of geology is that younger rocks lie on top of (or intrude into) older rocks. Interestingly, this relationship can be discerned from a photograph. In the case of the Moon, images show the dark smooth plains of the maria (lava) and the rough, cratered highlands. Some craters were found on top of the dark mare plains, while others were filled with mare. Clearly, the craters on top of the mare formed after those plains existed and were thus younger than the maria. On the other hand, dark mare that fills a crater must have formed after that crater existed and so in this case, the crater was older.
By following these simple relations over large areas, it is possible to determine the relative ages of mare and craters, both among themselves and to each other. But such information is trivial unless we can relate these individual ages to some unit or event of regional significance. In principle, if such a relationship can be defined we can extend relative age assignments over large areas, ultimately on a global basis.
The first effort to map the geology of the Moon was by the USGS, but not by the then-newly created Astrogeology Branch. Branch of Military Geology scientists Arnold Mason and Robert Hackman produced the “Engineer’s Special Study of the Moon” in 1960. This special one-off product documented the principal terrain types of the Moon (maria and highlands) and ordered features into three categories of relative age: post-mare craters (youngest), maria, and highlands (oldest). Additionally, the map showed the distribution of linear features, presumed to be faults (fractures along which movement has occurred), and mare ridges (presumed to be folds) over the near side. In this sense, the Engineer Special Study was a geological map because it showed the spatial distribution of rock types, their relative ages, and the inferred structure of the lunar surface. This map was accompanied by a detailed text chart, which showed a region-by-region evaluation of the terrain and construction challenges for each area. But a critical element was still missing.
On Earth, the geologist recognizes the rocks in the field, maps their locations and orientation, and documents the structure of the area under study. But a key part of this work is to figure out where a particular area fits in the global column of geologic units. On Earth, by documenting the slow, gradual nature of geological processes the stratigraphic column was developed slowly over the course of about a hundred years. The terrestrial stratigraphic column also provided key evidence needed to show the gradual transition of life forms from simple invertebrate organisms in the earliest rocks, to the complex and varied life forms in succeeding strata. With the development of a global stratigraphic system and accompanying geologic time scale for the Earth, a framework for understanding the history and processes of the Earth was created.
Gene Shoemaker recognized the need for an organized stratigraphy to aid in our understanding of the Moon. He wanted to understand the Moon’s evolution and age, but also to correlate events on the Moon with events in Earth history. He recognized that a major step forward to such an end was to define a formal stratigraphic system for the Moon – a clear succession of rock types with key regional units defining the system boundaries. He began mapping the area around the crater Copernicus, which lies on the central near side of the Moon, recognizing that the rocks exposed there (from what had been discerned from images) represented all the distinct phases of lunar history.
The basic sequence is easy to follow. The oldest rocks (1) are those that form the highland units of the large, circular Imbrium impact basin. These units are the mountains that make up the rim of the basin as well as the regional highlands around Copernicus, which are ejecta from the basin forming event. Partial flooding by the dark, smooth maria followed (2), including both dark, ash-like materials and smooth flood-like plains (interpreted even then as flows of basalt, the most common volcanic rock type on Earth). These eruptions were followed by the formation of impact craters, of which two kinds could be recognized: an older group (3) that had slightly eroded and lost their bright rays (such as Eratosthenes) and a younger group (4) that preserved the bright rays and showed a fresh, unmodified form (such as Copernicus.)
Shoemaker used these rock units to define the lunar time-stratigraphic systems: the Imbrian, Procellarian, Eratosthenian and Copernican Systems were each assigned to represent an archetypical deposition event. Rocks that existed before the formation of the Imbrium basin were assigned to an informal category, the pre-Imbrian. Thus, Shoemaker created a geologic map that not only showed the distribution of rock units and the structure of a given area, but also classified these rock types into a stratigraphic column for the Moon, one that (because of the enormous extent of the Imbrium basin) could be applied to areas across the lunar near side. With slight modification (the “Procellarian” System is no longer used and the pre-Imbrian has been subdivided into the Nectarian System and pre-Nectarian), this classification scheme subsequently has been applied to the entire Moon.
Shoemaker’s work on geologic mapping of the Moon gave us the ability to immediately put the lunar samples returned by Apollo into a regional and global context. We found that most lunar events occurred very early in its history, with intense geological activity in the first 1-2 billion years and little activity since. Thus, the Moon’s geological record perfectly complemented that of the Earth, whose traces of earliest activity have been erased over time by the active processes of erosion and plate tectonics.
The 1960 Copernicus Prototype Chart LPC-58, the first true geological map of the Moon, was not formally published by the USGS, though a modified and updated version was published later in that decade. By then, Gene had picked up a couple of co-authors for his effort, including one Harrison Hagan Schmitt (a young geologist with the USGS in the early 1960s), who in 1972 ultimately got the chance on the Apollo 17 mission to do what Gene Shoemaker originally got into the space business to do – check the interpretations of the remote lunar geologic mapping by doing field work on the Moon.
Click HERE to view Shoemaker’s LPC-58 geological map at full resolution.
One of the basic principles of geology is that younger rocks lie on top of (or intrude into) older rocks. Interestingly, this relationship can be discerned from a photograph. In the case of the Moon, images show the dark smooth plains of the maria (lava) and the rough, cratered highlands. Some craters were found on top of the dark mare plains, while others were filled with mare. Clearly, the craters on top of the mare formed after those plains existed and were thus younger than the maria. On the other hand, dark mare that fills a crater must have formed after that crater existed and so in this case, the crater was older.
By following these simple relations over large areas, it is possible to determine the relative ages of mare and craters, both among themselves and to each other. But such information is trivial unless we can relate these individual ages to some unit or event of regional significance. In principle, if such a relationship can be defined we can extend relative age assignments over large areas, ultimately on a global basis.
The first effort to map the geology of the Moon was by the USGS, but not by the then-newly created Astrogeology Branch. Branch of Military Geology scientists Arnold Mason and Robert Hackman produced the “Engineer’s Special Study of the Moon” in 1960. This special one-off product documented the principal terrain types of the Moon (maria and highlands) and ordered features into three categories of relative age: post-mare craters (youngest), maria, and highlands (oldest). Additionally, the map showed the distribution of linear features, presumed to be faults (fractures along which movement has occurred), and mare ridges (presumed to be folds) over the near side. In this sense, the Engineer Special Study was a geological map because it showed the spatial distribution of rock types, their relative ages, and the inferred structure of the lunar surface. This map was accompanied by a detailed text chart, which showed a region-by-region evaluation of the terrain and construction challenges for each area. But a critical element was still missing.
On Earth, the geologist recognizes the rocks in the field, maps their locations and orientation, and documents the structure of the area under study. But a key part of this work is to figure out where a particular area fits in the global column of geologic units. On Earth, by documenting the slow, gradual nature of geological processes the stratigraphic column was developed slowly over the course of about a hundred years. The terrestrial stratigraphic column also provided key evidence needed to show the gradual transition of life forms from simple invertebrate organisms in the earliest rocks, to the complex and varied life forms in succeeding strata. With the development of a global stratigraphic system and accompanying geologic time scale for the Earth, a framework for understanding the history and processes of the Earth was created.
Gene Shoemaker recognized the need for an organized stratigraphy to aid in our understanding of the Moon. He wanted to understand the Moon’s evolution and age, but also to correlate events on the Moon with events in Earth history. He recognized that a major step forward to such an end was to define a formal stratigraphic system for the Moon – a clear succession of rock types with key regional units defining the system boundaries. He began mapping the area around the crater Copernicus, which lies on the central near side of the Moon, recognizing that the rocks exposed there (from what had been discerned from images) represented all the distinct phases of lunar history.
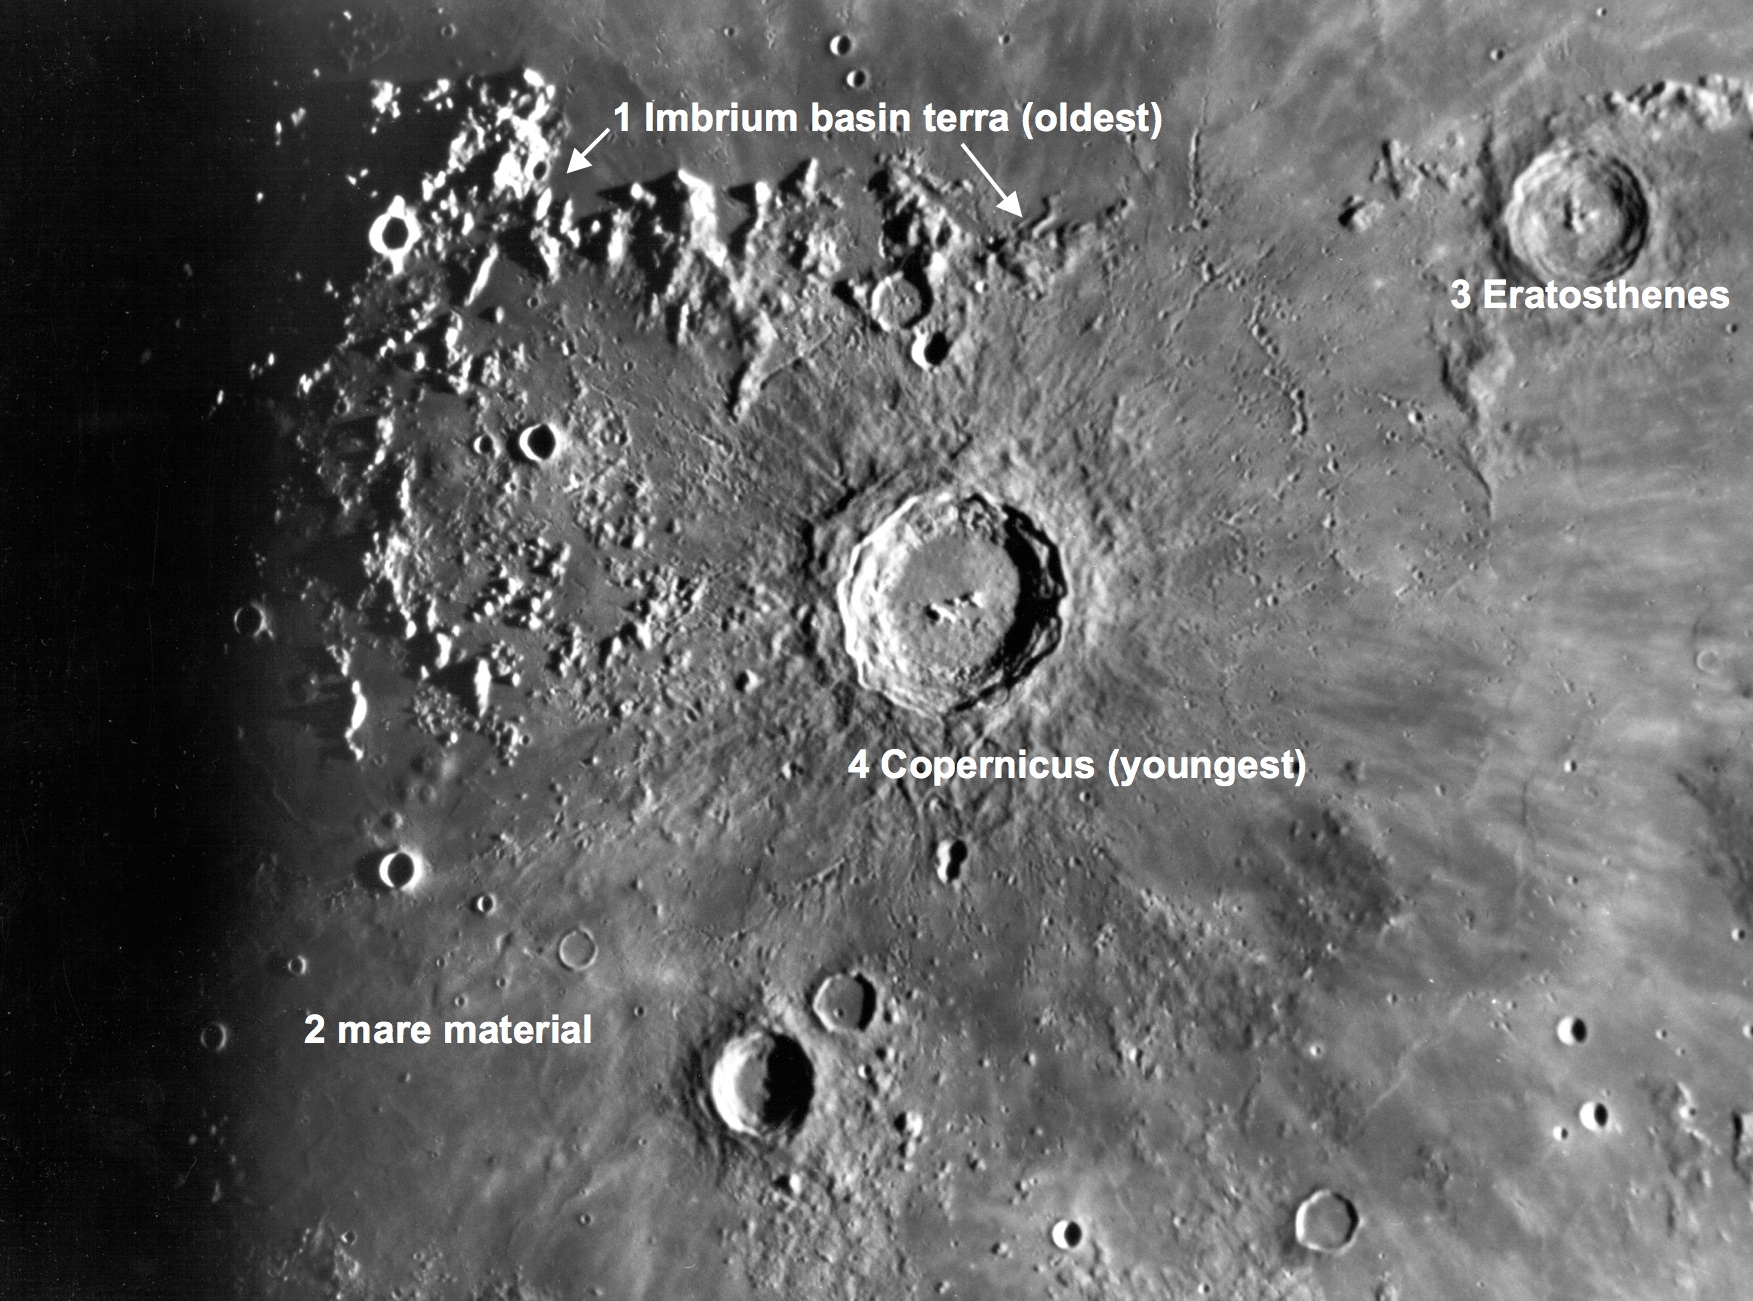 |
| From Earth, a telescopic image of Copernicus and vicinity, showing how the relative ages of geological features are determined using the principle of superposition. |
Shoemaker used these rock units to define the lunar time-stratigraphic systems: the Imbrian, Procellarian, Eratosthenian and Copernican Systems were each assigned to represent an archetypical deposition event. Rocks that existed before the formation of the Imbrium basin were assigned to an informal category, the pre-Imbrian. Thus, Shoemaker created a geologic map that not only showed the distribution of rock units and the structure of a given area, but also classified these rock types into a stratigraphic column for the Moon, one that (because of the enormous extent of the Imbrium basin) could be applied to areas across the lunar near side. With slight modification (the “Procellarian” System is no longer used and the pre-Imbrian has been subdivided into the Nectarian System and pre-Nectarian), this classification scheme subsequently has been applied to the entire Moon.
Shoemaker’s work on geologic mapping of the Moon gave us the ability to immediately put the lunar samples returned by Apollo into a regional and global context. We found that most lunar events occurred very early in its history, with intense geological activity in the first 1-2 billion years and little activity since. Thus, the Moon’s geological record perfectly complemented that of the Earth, whose traces of earliest activity have been erased over time by the active processes of erosion and plate tectonics.
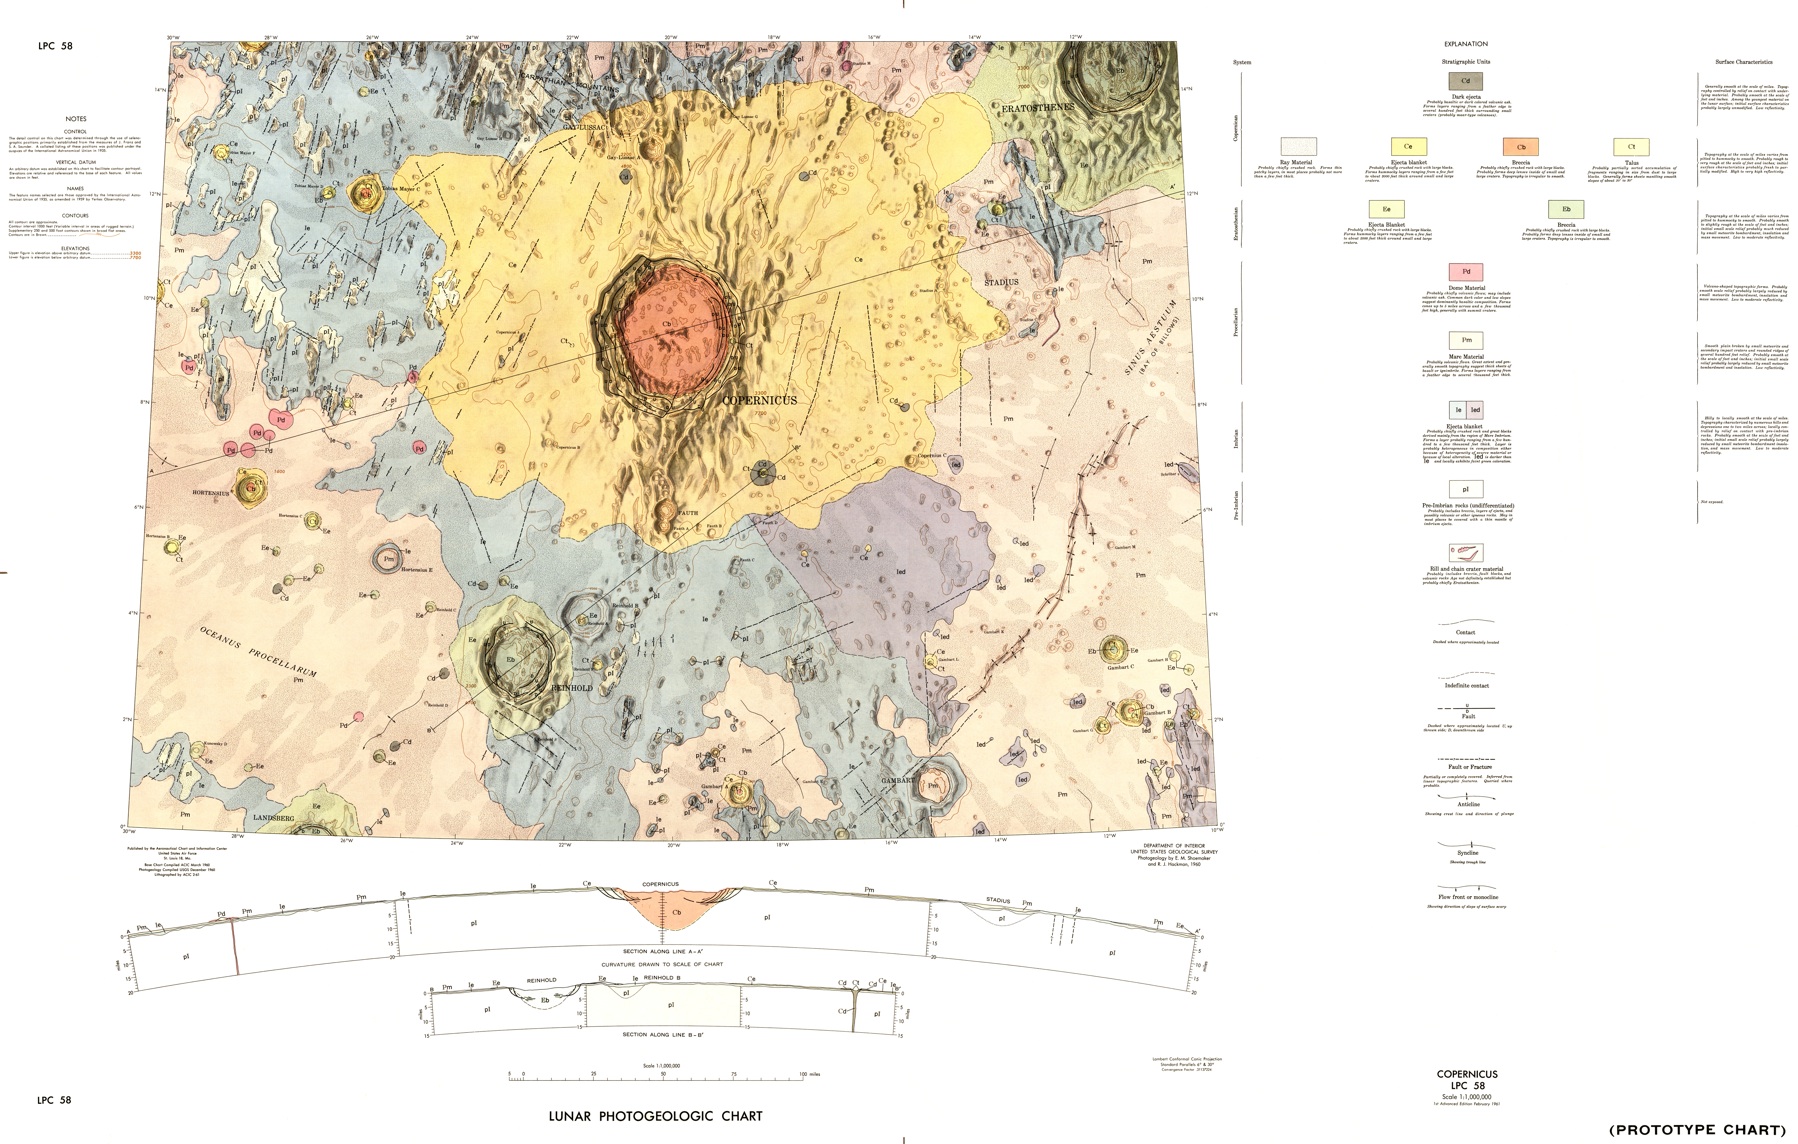 |
| The first geologic quadrangle map of the Moon, showing rock units (basin, crater and mare materials), structures and their stratigraphic arrangement. |
Click HERE to view Shoemaker’s LPC-58 geological map at full resolution.
Just published: The Clementine Atlas of the Moon, Revised Edition, an updated atlas and reference guide to lunar features, by Ben Bussey and yours truly.
Originally published at his Smithsonian Air & Space Magazine blog "The Once and Future Moon," Dr. Spudis is a senior staff scientist at the Lunar and Planetary Institute. The opinions expressed are those of the author and are better informed than average.
1 comment:
Some of the old geological colourful maps are simply beautiful, bordering on being artistic.
Here’s http://www.youtube.com/watch?v=I68zebd_Swk (YouTube platform) a small animation (~ 3 mins) done some time back combining LROC imagery with one or two of these old geological maps (regions covered: Vaporum, Langrenus, Colombo and Taruntius regions) overlaid upon.
Nostalgic meets modern, in a way.
John
Post a Comment