Showing posts with label Brett Denevi. Show all posts

Tuesday, July 30, 2013

Orientale Sculpture

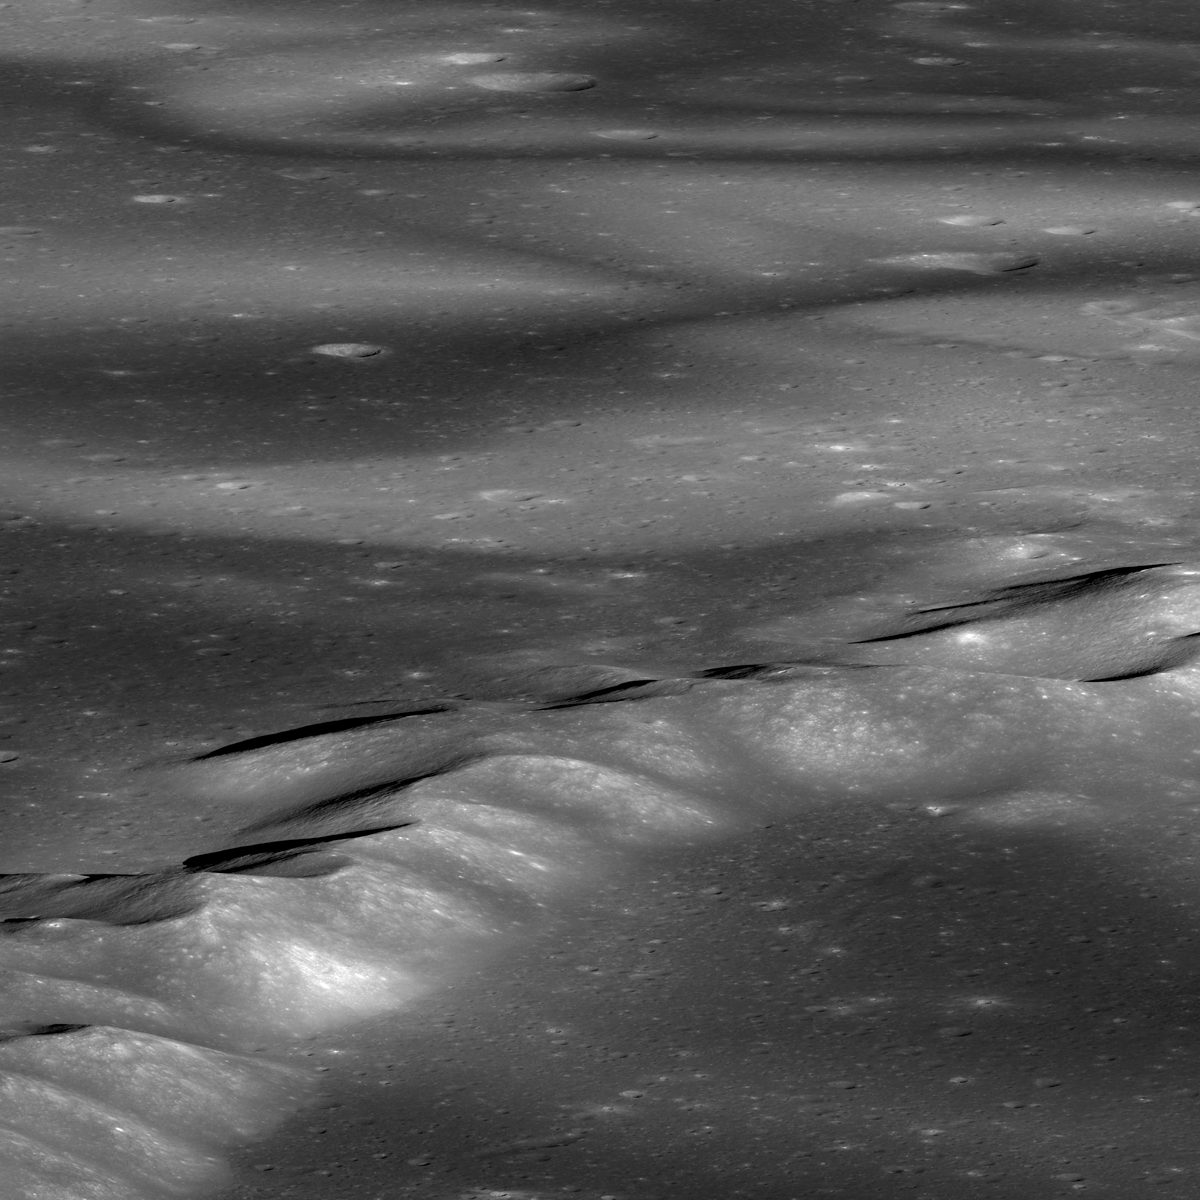
An oblique view of ejecta over 400 km south of the Orientale basin rim, a scene approximately 5 km across, centered at 51.8°S, 264.8°E, LROC Narrow Angle Camera (NAC) mosaic M1127819355LR, LRO orbit 18355, July 7, 2013; native resolution 1.9 meters per pixel [NASA/GSFC/Arizona State University].
Brett Denevi
LROC News System

Today's featured image is located near the center of the ancient 600-km Mendel-Rydberg basin. Its degraded state means Mendel-Rydberg's presence is not obvious in the WAC context image below (in fact, its existence was only confirmed with Clementine (1994) topography data), but its western rim is near the crater Mendel, and Rydberg and Guthnick craters are near the center of the basin.

However, it was not the Mendel-Rydberg impact that was responsible for the ups and downs in the hummocky deposits seen in today's Featured Image, but the Orientale impact event, hundreds of kilometers away to the north.

Ejecta from impact basins is both erosional, gouging out long valleys and leaving strings of large secondary craters (along the arrows in the image below), and depositional, blanketing even distant terrain with material excavated from the impact site. Basin ejecta plays such a large role shaping the lunar surface that these ups and downs are often referred to as "basin sculpture," and the ejecta from Orientale certainly sculpted the terrain in today's image.

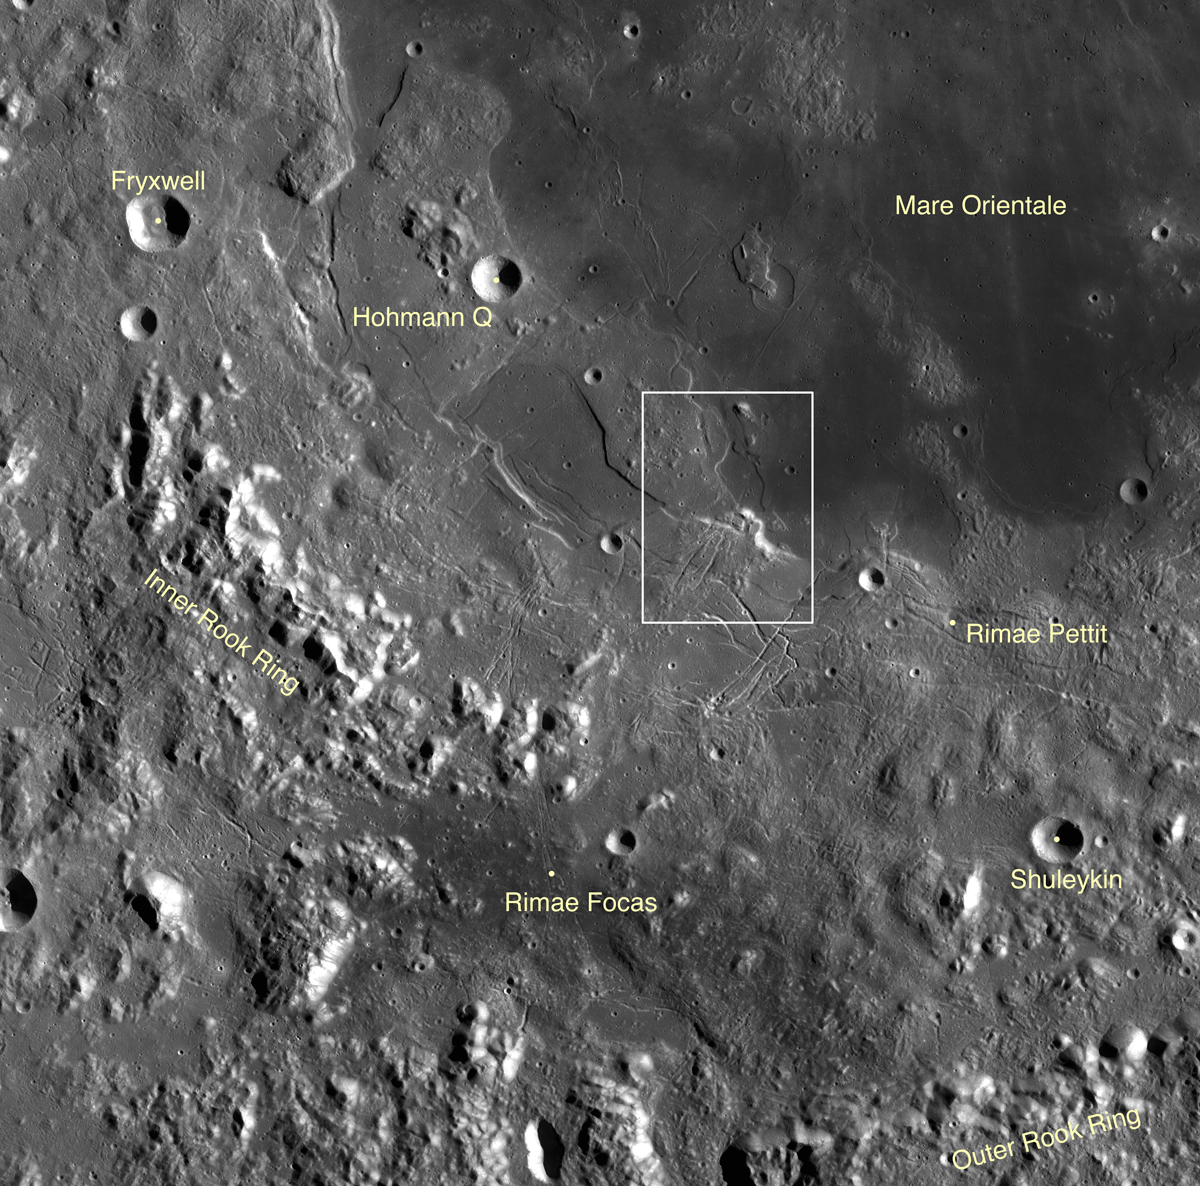
LROC Wide Angle Camera (WAC) mosaic context views of the southern Orientale region. The blue box in the image at bottom shows the field of view at top, where a yellow box shows the approximate field of view shown in the LROC Featured Image. Click to enlarge [NASA/GSFC/Arizona State University].
The hummocky deposits that cover low-lying areas in the top image, and the image below, are likely ejecta from the Orientale basin. These low-lying regions may have once been exposures of smooth mare basalt, some of which is still exposed on the surface in nearby regions, but are now hidden under a blanket of debris from Orientale. Buried volcanic deposits such as these are known as "cryptomare" and tracking down the locations of these ancient sites of volcanic activity is key for understanding the extent of early volcanism on the Moon.

A wider (and reduced-resolution) view of the LROC NAC mosaic from which the LROC Featured Image within the Mendel-Rydberg basin was cropped. LROC NAC M1127819355LR [NASA/GSFC/Arizona State University].
You may also note that the hills in the southern portion (right side) of the image above have a lumpy texture, also visible in the WAC context image. This is also likely due to Orientale's influence - the result of a massive ground hugging flow of ejecta that piled up on the sloped terrain. This oblique view of the region gives a great perspective on its complex history that would have been compelling enough with just the ancient Mendel-Rydberg basin and early lunar volcanism, but the spectacular basin ejecta flows captured here are just icing on the cake (so to speak).

Click HERE to see the full-resolution view.

Related LROC Featured Images:
Amazing Orientale Peaks and Valleys
Regolith Patterns in Mendel-Rydberg
Window to the Farside Mantle
Two-toned Impact Crater in Balmer Basin: A reflection of the Target?
Dark Craters on a Bright Ejecta Blanket

Tuesday, July 23, 2013

The View Inside a Tilted Crater

Oblique view of the chaotic interior of 30-km Wiener F crater. LROC Narrow Angle Camera (NAC) mosaic M1113262343LR; LRO orbit 16307, January 19, 2013, spacecraft and camera slewed 52° west from 160.39 km over 41.84°N, 140.28°E, subsampled from a scaled 2.78 meter per pixel resolution. Scene width approximately 13 kilometers from left to right, centered at 41.1°N, 150.0°E. [NASA/GSFC/Arizona State University].
Brett Denevi
LROC News System

Impact melt is commonly found in and around fresh lunar craters and can be spotted as ponds, flows, and ejecta.

This oblique view of the farside crater Wiener F highlights one of the more spectacular examples of what happens to the melt when a crater forms on a slope.

In the image above, you have a great perspective view of the chaotic crater interior, where material slumping into the crater interacted with the fluid melt, creating rough, hummocky mixtures in some regions and smoother pools of melt in others. But what is really interesting about this crater becomes clear when you zoom out to the full width of the image, below.

Thumbnail view of LROC NAC mosaic M1113262343LR, looking from west to east into Wiener F crater. For the full-resolution, zoomable view click HERE [NASA/GSFC/Arizona State University].
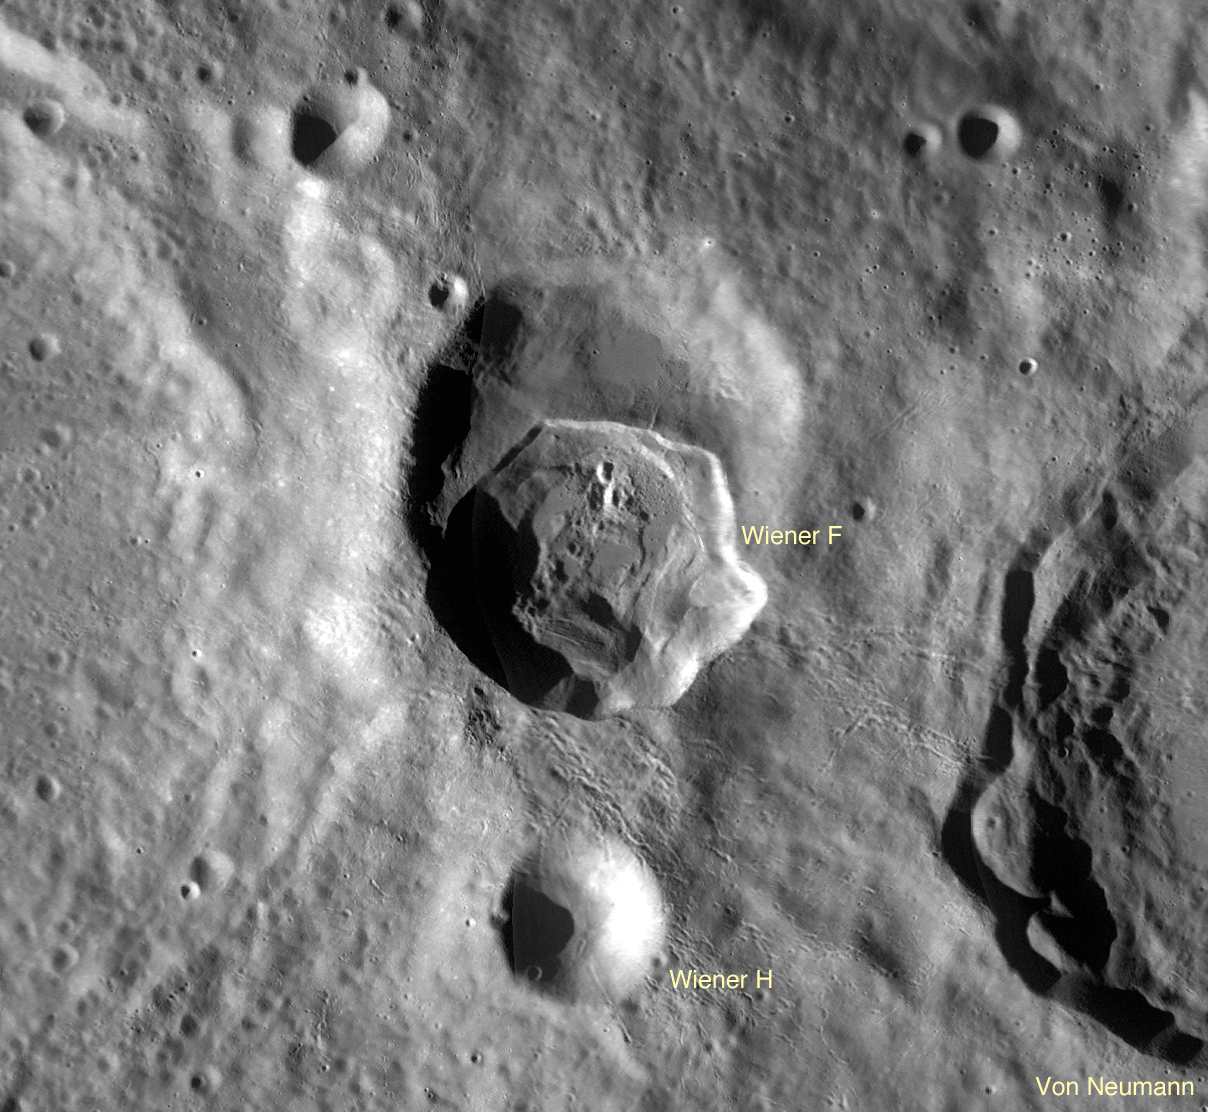
Wiener F formed atop a larger, older crater, so its northern rim, on the left in the picture above, ended up substantially lower than the southern rim. A profile across the crater, taken from the GLD100, shows the northern rim of the crater is over 2 km lower in elevation than the southern rim!

A profile from south to north across crater Wiener F, taken from LROC WAC-derived topography data [NASA/GSFC/Arizona State University].
So tilting the crater like this is like tilting a glass of water - it spills. In this case, the hot impact melt that would normally stay within the crater poured out, spilling over the northern rim and pooling outside the crater. Click on the image below to see this spectacular flood. You can find individual flows and places where the melt was still moving even as a crust of hard rock formed on top, resulting in cracks and wrinkles in the top layer.

View of the impact melt that escaped Wiener F, pooling outside the northern crater rim. Image subsampled from the original resolution [NASA/GSFC/Arizona State University].
Impact melt is a favorite target for LROC imaging because of its often complicated and bizarre features, and because of what it tells us about the impact process. The volume of melt can give clues as to how fast an impactor hit the surface (higher velocities mean higher shock pressures and more heat to melt rock), at what angle it impacted (melt is often thrown downrange of an impact), and how long ago the impact occurred (by observing how well preserved the melt morphology is, or by age-dating a sample of melt). Impact melt can also give insights into how portions of the crater moved and settled as the crater formed (for example, how did melt get up HERE?).

LROC Wide Angle Camera (WAC) contextual view of Wiener F crater, nested in the Farside Highlands [NASA/GSFC/Arizona State University].
Wiener F is another piece of that puzzle, showing what a dynamic environment an impact crater is shortly after formation. Click HERE for the full-resolution view of Wiener F.

Other Spectacular
Impact Melt Favorites:
Rumker E Impact Melt
Dynamics of Molten Rock
La Pérouse A Impact Melt
Rippled Pond
Breached Levee
Secondary Melt on the rim of Wiener F
Getting cracked in Wiener F
Giordano Bruno Whorl

Tuesday, July 16, 2013

Amazing peaks and valleys in new Orientale NAC oblique

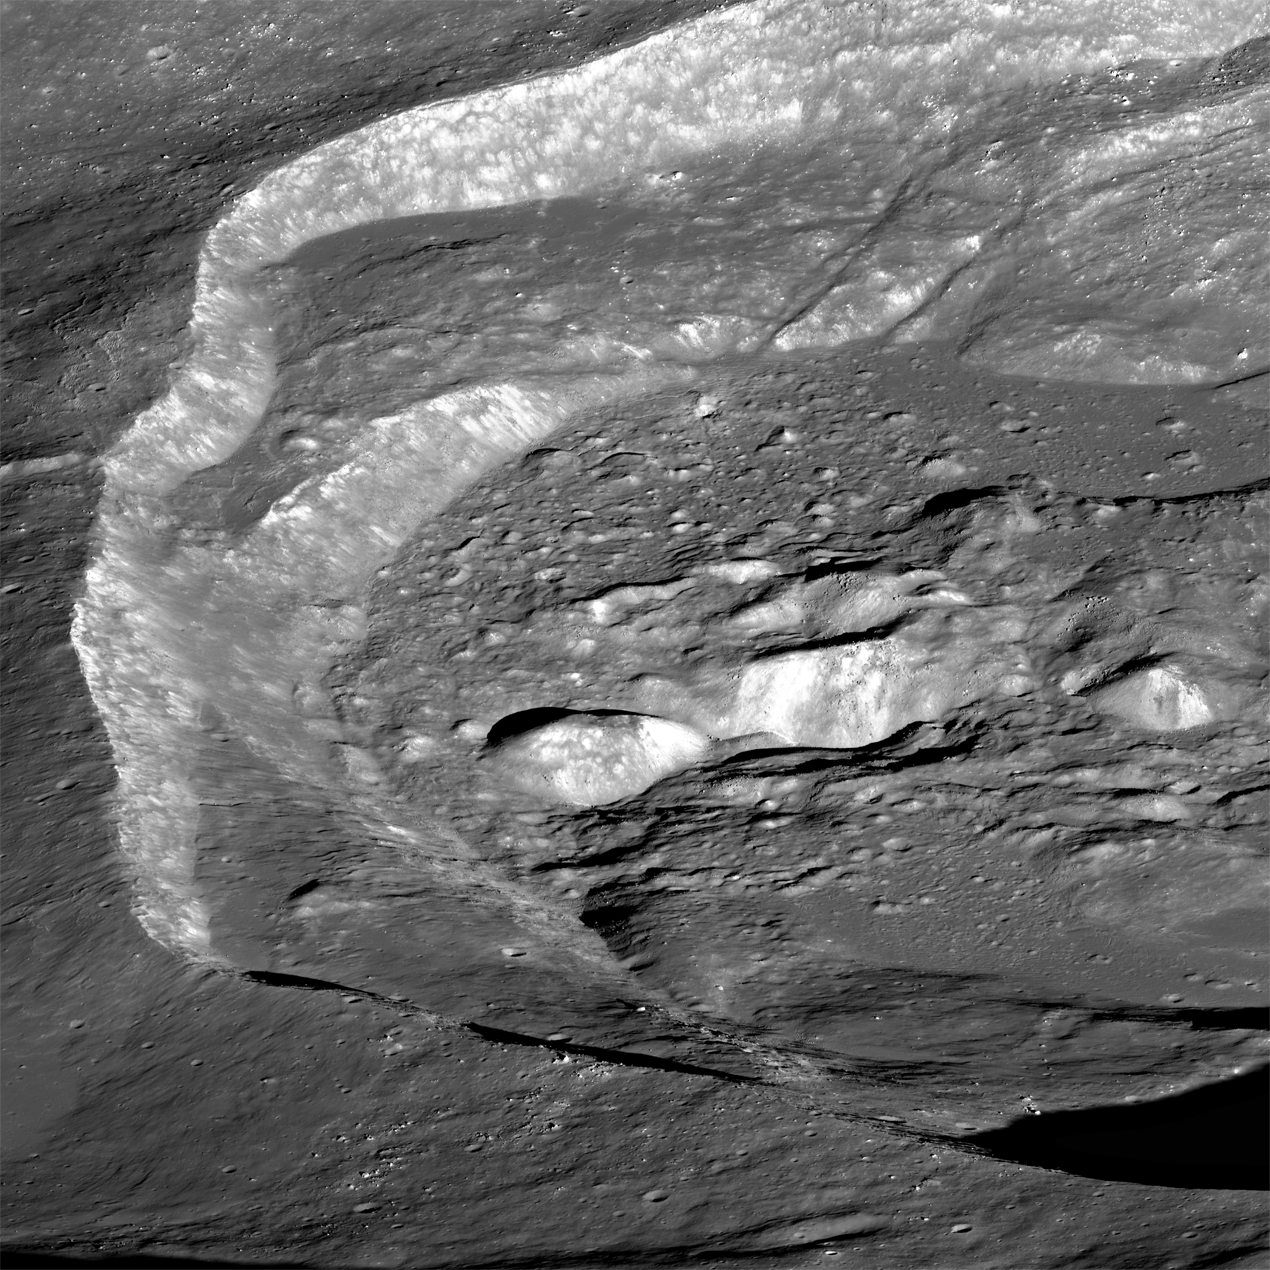
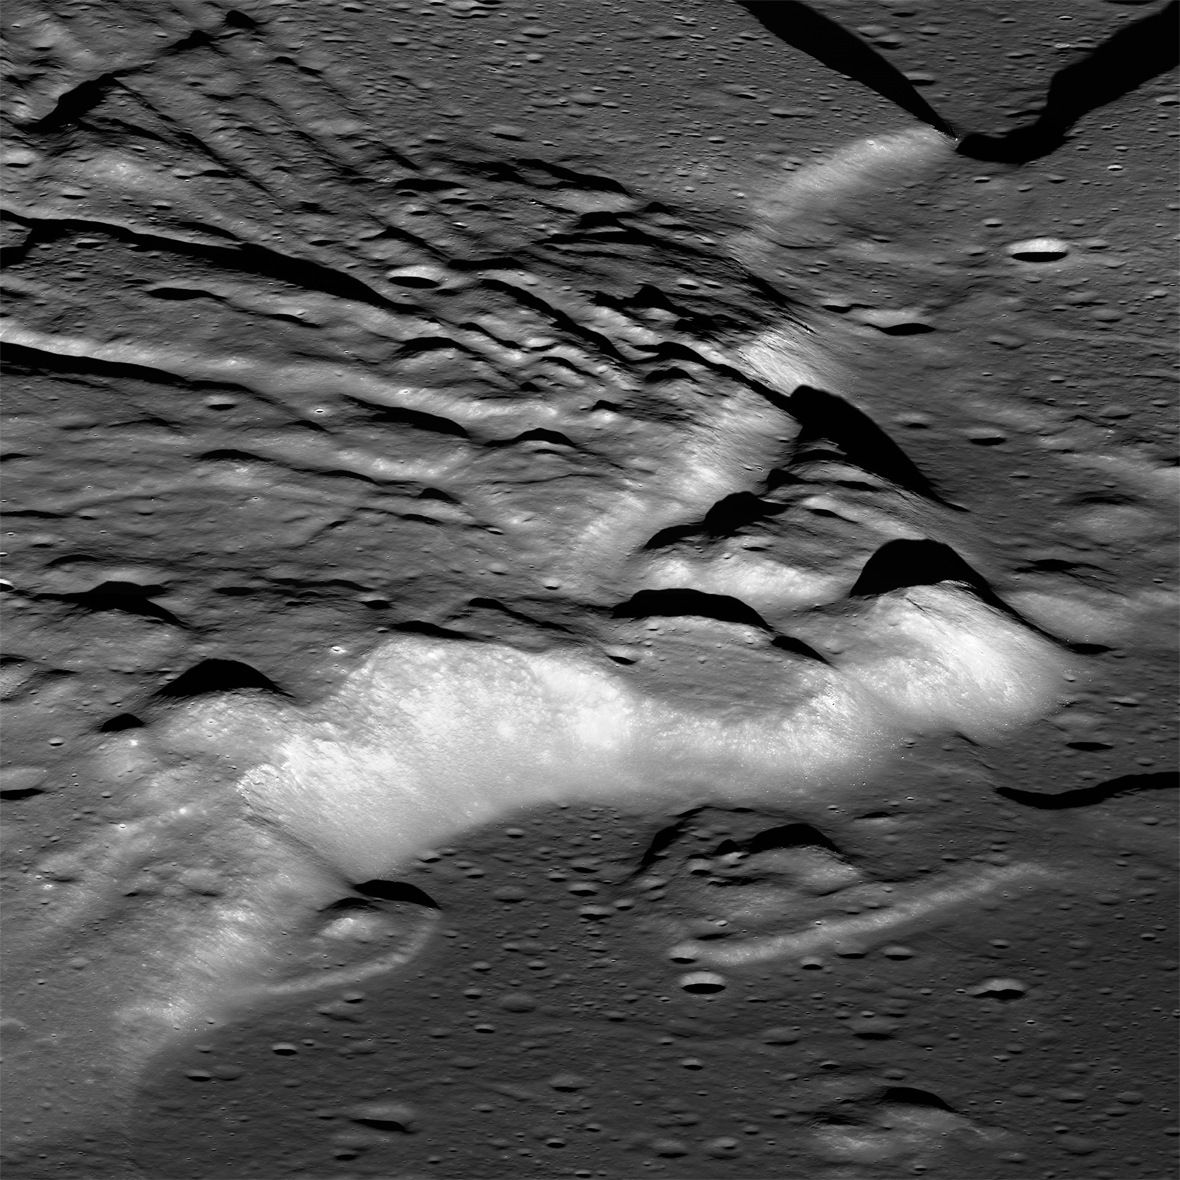
Spectacular oblique view of the interior of the Orientale basin. LROC Narrow Angle Camera (NAC) mosaic M1124173129LR, LRO orbit 17842, May 26, 2013, centered at 24.23°S, 264.30°E. The scene cropped above shows a field of view approximately 16 km across, and the cliffs at center rise almost 2 km over the southwestern interior edge of the basin floor. Native resolution 2.59 meters per pixel [NASA/GSFC/Arizona State University].
Brett Denevi
LROC News System

With an estimated age of around 3.8 billion years, and a diameter of over 900 km, the Orientale basin is the youngest of the large lunar impact basins.

Its interior is relatively well preserved and its floor has not been completely buried under mare basalts, making it one of the most studied basins on the lunar surface in the hopes of unraveling the mechanics of multi-ring basin formation and the relationships of volcanic infilling to large basins.

Today's featured image highlights some of the more bizarre and complex features inside the southwestern portion of the basin, where primary features related to the basin itself meet the later-forming mare basalts in the basin floor.

Miniature (view the 1280x720 animation HERE) composition of five frames of HDTV captured by Japan's lunar orbiter Kaguya (SELENE-1) in November 2007.  In polar orbit more than 100 km over Mare Orientale Kaguya moves north. Beginning far to the south the slideshow begins with the inner mountain ring like a wide plateau looming on the horizon and minutes later the inner basin and lava-flooded basin floor comes prominently into view, including the area shown at high resolution in the LROC NAC oblique mosaic. Afterward, the final frames linger a moment over prominent Maunder crater and the high mountainous rings and valleys of north Orientale. Widespread terrain disruption by the basin-forming impact is uninterrupted throughout the entire sequence [JAXA/NHK/SELENE].
View the Kaguya Image Gallery HERE

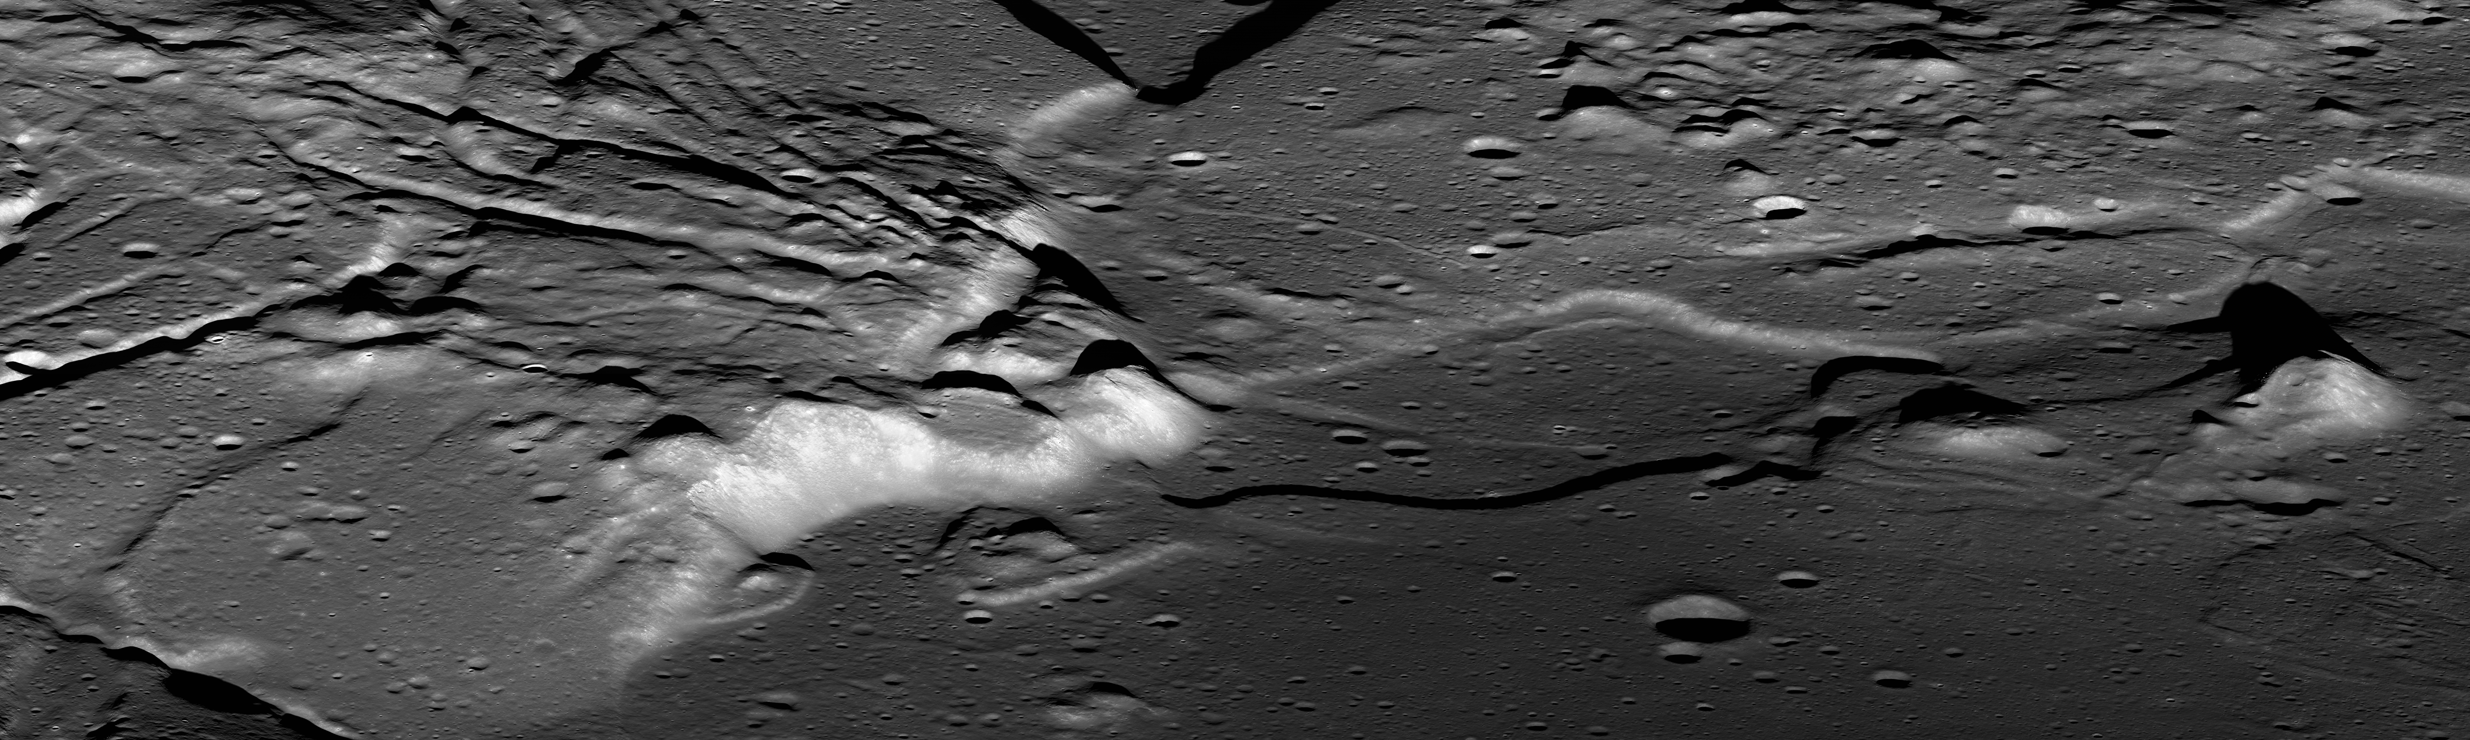
A reduced-resolution version of the oblique NAC mosaic of the Orientale interior. The thumbnail above links to a 2470 by 740 reproduction HERE, while the zoomable, full-resolution view is viewable HERE [NASA/GSFC/Arizona State University].
The striking linear features seen in the top image are portions of a series of cracks that are near-radial to the basin and are unlike typical lunar graben. This portion of the interior is thought to have a high proportion of material that was melted by the extreme shock pressures of the impact event that crated the Orientale basin, and the cracks may have formed as the hot material, draped over underlying topography, cooled and shrank. It is hard to picture the effects of an impact so large it would have obliterated the state of Texas, but here you can almost see the molten and shifting terrain settling and cracking.

LROC Wide Angle Camera (WAC) context view of a portion of southwestern Orientale basin featuring the approximate area shown in NAC mosaic (white box) M1124173129LR [NASA/GSFC/Arizona State University].
You can also get a sense of how basaltic lavas, the lower-reflectance deposits seen at bottom right, poured in later, flooding low areas, lapping up against the higher-standing terrain, and leaving kipukas of original basin material exposed in some spots. These lavas are estimated to have erupted on the order of 100 million years after the formation of the Orientale basin, but were not as voluminous as the basalts that bury all but the rims of other lunar multi-ring basins, such as Serenitatis and Imbrium. The WAC image mosaic of the region, seen below, helps put these features into context. Here you can see the Orientale mare deposits lie largely within the innermost ring of the basin, the Inner Rook mountains. (The other rings are named the Outer Rook mountains, also seen below, and the Cordillera mountains, which lie outside of the context image.)

Why did these basalts fill regions largely contained within only the innermost ring of Orientale, whereas other basins were totally flooded? Orientale may have formed in a region of thicker crust, making it harder for basalts to erupt from the mantle to the surface anywhere but the center of the basin, where the crust was thinned the most. The composition of Orientale's basalts is also known to be different from the major nearside maria, with a lower concentration of radioactive heat-producing elements (known as KREEP), so there may have been less heat available to melt the mantle to produce basalts.


GRAIL MoonKAM video stills sequenced into nadir and off-nadir low-orbit HD views of Mare Orientale (2:00). The area of interest is visible between 1:05 and 1:15 [NASA/JPL-Caltech/Sally Ride Science].

This interplay of spectacular, complex features related to basin formation and later volcanic eruptions means Orientale is a high-priority target for exploration. Samples would pin down the exact age of the basin, important for answering questions about chronology across the Solar System, as well as answer a host of other questions about basin formation and evolution. And what a beautiful view you'd have, standing at the base of Orientale's cliffs!

View the full-resolution NAC mosaic of beautiful Orientale HERE.

Related LROC Featured Images:
Sinuous Cracks
Geologically recent debris flow at Couder
Orientale Basin
A digital terrain model of the Orientale Basin
Chain of secondary craters in Mare Orientale
Dark halo crater in Orientale!

Thursday, July 11, 2013

Lunar Kipuka

A ghost crater, breached and filled with the lavas of Mare Imbrium (31.364°N, 334.217°E), the 3.2 km field of view from LROC Narrow Angle Camera (NAC) observation M193132768L, LRO orbit 13487, May 31, 2012; 74.94° angle of incidence, resolution 1.46 meters from 147.07 km [NASA/GSFC/Arizona State University].
Brett Denevi
LROC News System

The lunar maria were once "seas" of highly fluid lava, and within their margins small islands and shorelines can be found. Today's featured image highlights a classic example of a partially flooded impact crater within Mare Imbrium. The western wall of the crater, a low point in the rim, was breached by the flowing lava, and the crater was filled nearly to its rim. What remains of the rim is known as a kipuka, the Hawaiian word describing an island of older land surrounded by younger lava flows.

The shoreline can be seen within the crater as a terrace-like ring just inside the crater rim, particularly on the eastern side. This terrace is akin to the high-water mark of a flood, and marks the high-lava point along the crater wall. As the lava cooled, it contracted and subsided to a somewhat lower level. Similar features are seen in areas like Bowditch, within Lacus Solitudinis.

The kipuka of interest, out on the vast plains of Mare Imbrium, in the 48 km-wide field of view of LROC Wide Angle Camera (WAC) monochrome (643 nm) observation M177798520C, spacecraft orbit 11338, December 6, 2011; 76.25° angle of incidence, resolution 60.03 meters from 43.97 km [NASA/GSFC/Arizona State University].
The flooded crater in today's image is approximately 2.7 km in diameter, and was likely originally around 500 m deep. That gives a maximum lava thickness of a little less than 500 meters in this spot, though that does not require a single 500-meter thick flow. Lava likely pooled in the low of the crater floor from multiple individual flows, rather than one massive influx of lava. Layering exposed within sinuous rillesmare pits, and impact craters suggests individual lava flows were much thinner (on the order of 10 meters).

LROC WAC context mosaic showing the location of the flooded crater (arrow) within an outline of the footprint of NAC M193132768L [NASA/GSFC/Arizona State University
Note the small (250 meters in diameter) high reflectance crater nearly in the center of this flooded crater. An astronaut could descend its interior and inspect a cross-section of about the top 25 meters of the basalts and determine the thickness and frequency of the lava flows that filled the host crater. The rim of this impact crater is the only kipuka preserved in the area, and is the last local remnant of the surface before it was drowned in the lavas of Mare Imbrium several billion years ago.

Browse the full-resolution NAC image HERE.

Related LROC Featured Images:
The Swirls of Mare Ingenii
Remnants of the Imbrium Impact

Friday, June 22, 2012

LROC: The Swirls of Mare Ingenii

An oblique view of Mare Ingenii and the swirl that marks its floor. Scene is approximately 15 km across (subsampled from the native resolution); LROC Narrow Angle Camera (NAC) frames M191830503L & R, LRO orbit 13304, May 16, 2012; resolution 2.95 meters per pixel. See the full size LROC Featured Image HERE [NASA/GSFC/Arizona State University].

Brett Denevi
Lunar swirls are among the most beautiful and bizarre features on the Moon. Seen as bright, sinuous regions, swirls are associated with weak magnetic anomalies in the Moon's crust. Images from LROC, and the topographic information extracted from those images, have shown that swirls have no topography associated with them; they are not higher or lower than their surroundings. Instead, it is as if someone has taken a brush and laid down a beautiful swath of bright paint. In the top image is the classic omega-shaped swirl of Mare Ingenii, also seen in this past featured image. The region of higher terrain is the rim of Thompson crater.

The lavas that formed Mare Ingenii flooded Thompson, leaving only the rim as a kipuka of older highland terrain.

A wider (but very reduced-resolution) view of the Ingenii swirls. The rims of Thompson and Thompson M craters are seen in the foreground. View is from east to west, and the full scene is approximately 58 km across [NASA/GSFC/Arizona State University].
The obvious question: how did swirls, like the one shown here, form? The leading hypothesis involves two main components - solar wind and crustal magnetic anomalies. The solar wind is a stream of charged particles coming from the Sun that normally interact with the Moon's surface, darkening it as one portion of a process called space weathering. On the Earth, the magnetic field acts as a shield and usually deflects the solar wind (when it doesn't, the solar wind interacts with the atmosphere, causing the northern lights). The Moon lacks a global magnetic field, but does have small, local magnetized regions within the crust. This is where we see the swirls. So the idea is that these local magnetic fields prevent the solar wind from doing its normal job of space weathering, and the surface stays bright. The stunning swirly pattern of the bright regions is likely due to the complex pattern of the magnetic field lines, which shield some areas and not others.

LROC Wide Angle Camera (WAC) views of Mare Ingenii, for context. The box in the second image outlines the approximate footprint of the LROC Featured Image released June 21, 2012. The bottom animated gif image, generated from separate views of the 282 km wide Mare Ingenii and the 1400 square km surrounding region from the LROC QuickMap. Resolution was set at 500 meters, WAC mosaic draped over the WAC derived elevation model Researchers long suspected true lunar albedo swirls are not related to any topographic feature, including very small secondary craters. The latest high resolution images and crater count studies continue to back that conclusion.  [NASA/GSFC/Arizona State University].
The LROC team is continuing to study the lunar swirls, including their color properties as observed in LROC Wide Angle Camera data, to learn more about how swirls form, the process of space weathering, the rate at which bright, freshly exposed material is darkened by space weathering, and why crustal magnetic fields are where they are.

See the spectacular full-resolution oblique look at the Ingenii swirls HERE.

Read about the Reiner Gamma swirl, HERE.

Mare Ingenii was imaged using the HDTV camera on-board Japan's lunar orbiter Kaguya (SELENE-1) in 2008 [JAXA/NHK/SELENE].
Mare Ingenii Related Posts:
The new Kaguya Terrain Camera tours (May 5, 2012)
A Potpourri of Lunar Results (March 14, 2012)
NASA@Science: “Down the lunar rabbit hole (July 13, 2010)
Grand lunar swirls yielding to LRO Mini-RF (October 4, 2010)
Depths of Mare Ingenii (June 16, 2010)
LROC: Ingenni Swirls at Constellation ROI (May 26, 2010)
More cavern entrances discovered on the Moon (February 26, 2010)
Moon’s mini-magnetospheres are old news (November 16, 2009)

Friday, May 25, 2012

LROC captures Earth "In the Shadow of the Moon"

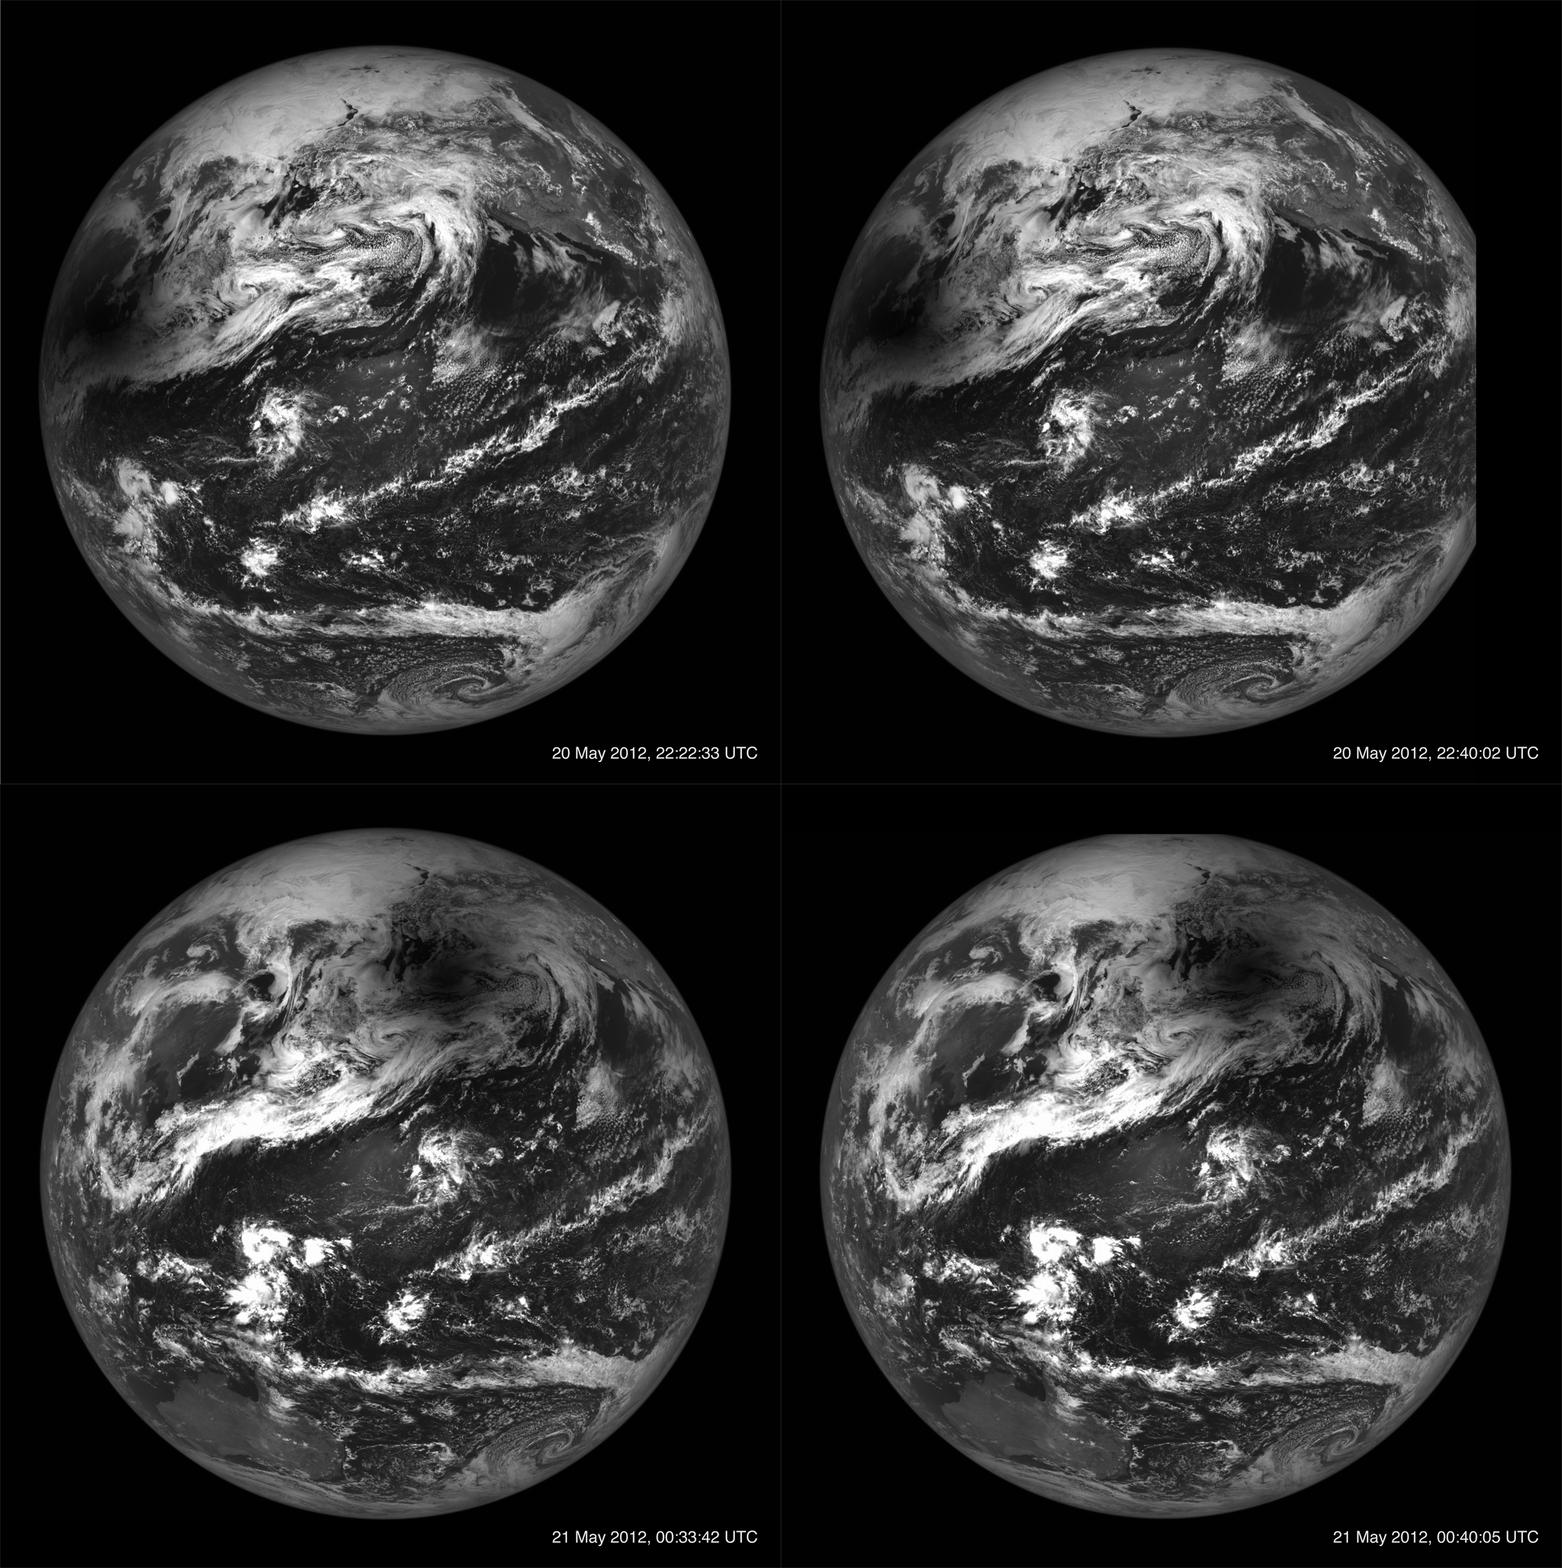
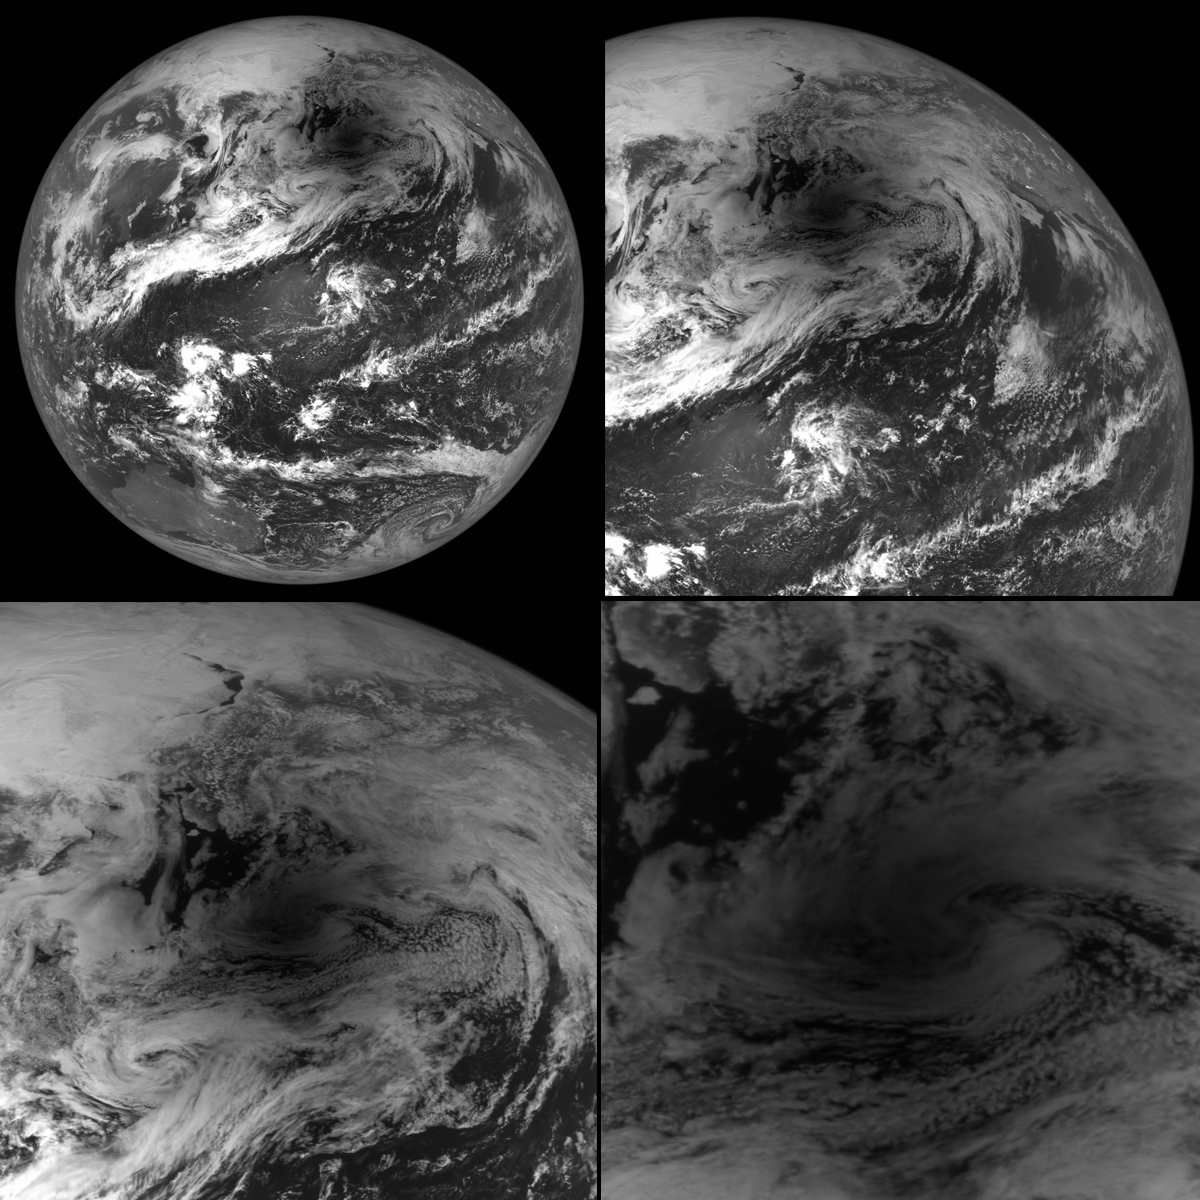
Animated compilation of the four images collected by the LROC NAC during the Annular Solar Eclipse of May 2012. Two images were collected during each of two successive orbits. (NAC images E192192490L, E192192869L, E192199689L, E192200072L) View the full size image accompanying the LROC release HERE [NASA/GSFC/Arizona State University].
Brett Denevi
LROC News System

A solar eclipse occurs, from the Earth’s perspective, when the Moon passes directly between the Earth and the Sun. This alignment results in a shadow of the Moon passing across the Earth. In a total eclipse, the Moon blocks the entire disk of the Sun, and viewers on Earth witness only the the Sun's faint corona that extends thousands of miles into space. However, in an annular (or "ring of fire") eclipse like the one that occurred on 20-21 May 2012, the apparent size of the Moon is smaller than that of the Sun, so terrestrial viewers can see a bright ring or annulus of the Sun around the Moon. Which type of eclipse you experience, total or annular, depends on where the Moon is in its orbit. The Moon's orbit isn't perfectly circular, so sometimes it is closer to the Earth, and bigger in the sky (resulting in a total eclipse), and sometimes it is farther from the Earth and smaller in the sky (an annular eclipse).

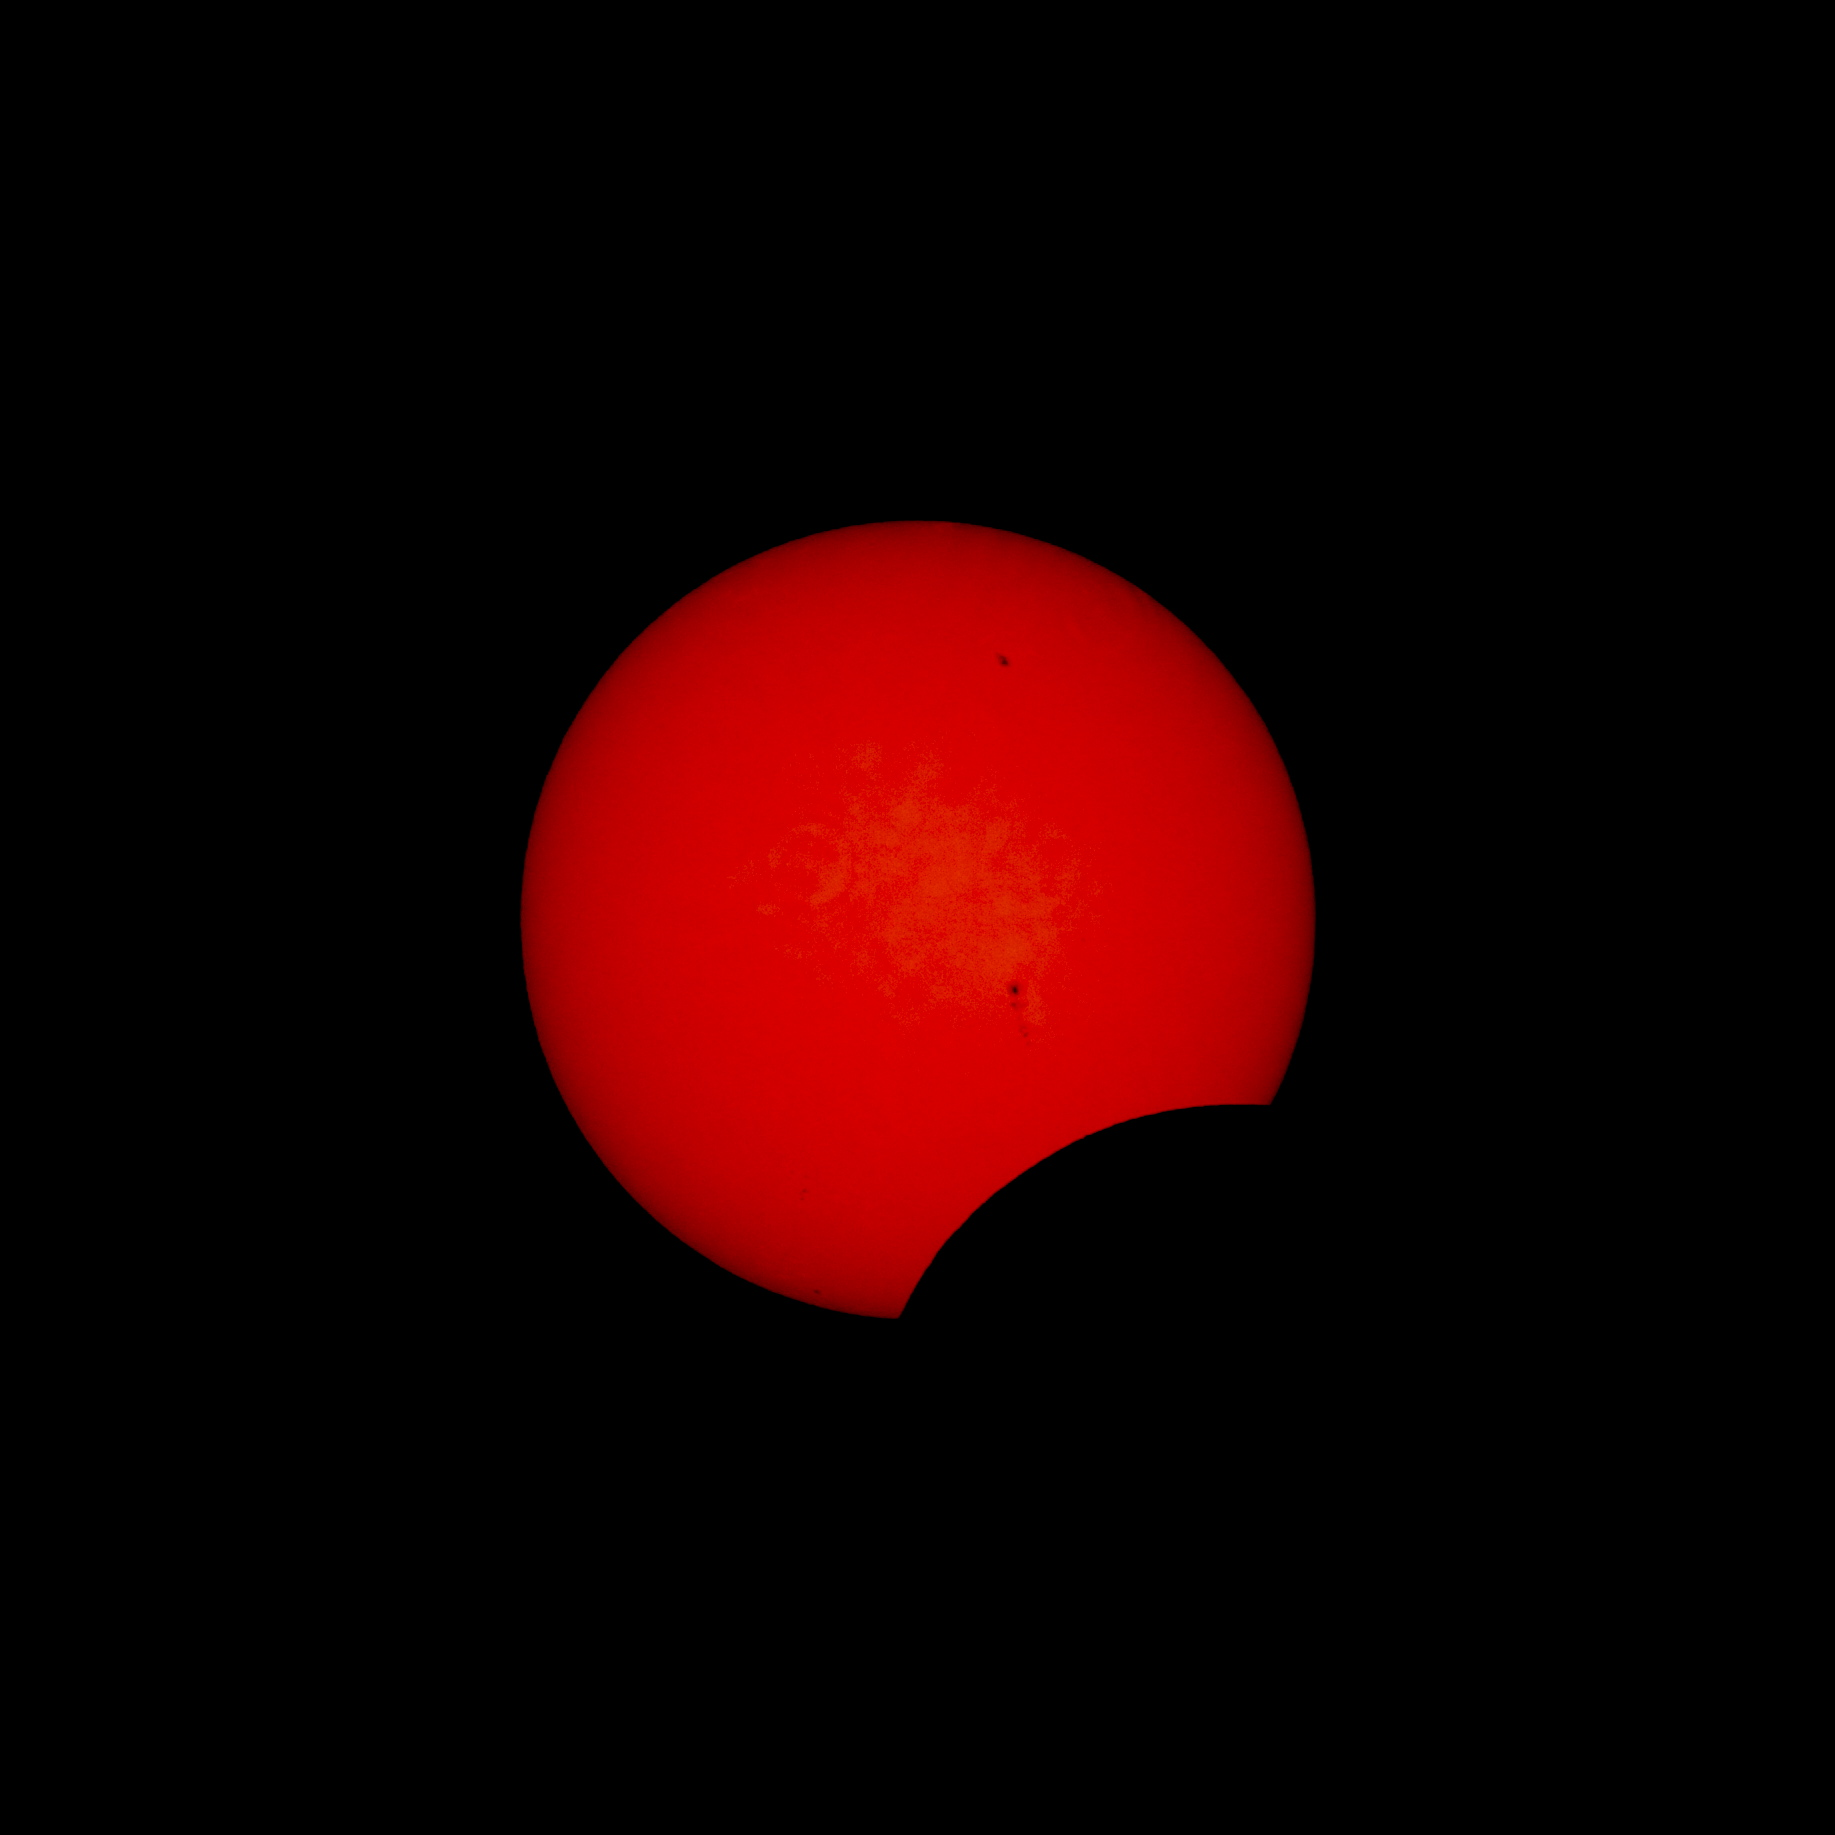
The Annular Eclipse, by E. Speyerer, from Kanarraville, Utah, May 20, 2012 (UT) View the spectacular 1667 px original accompanying the LROC image released May 25, 2012 HERE.
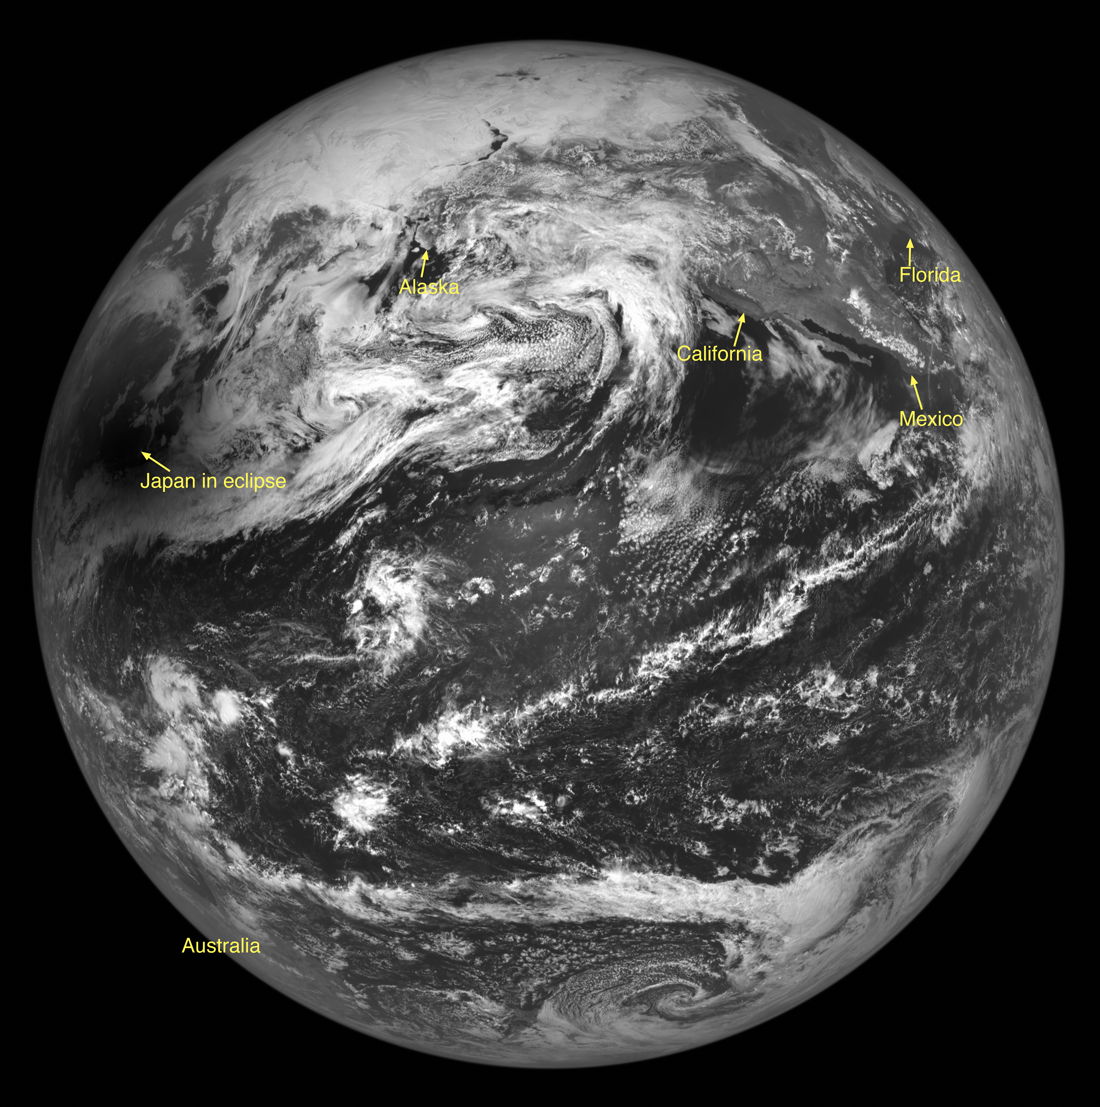
What does a solar eclipse look like from the Moon? The LROC NAC captured four images of the Earth, two on each of two successive orbits, during this solar eclipse. In these images you can see the Moon's shadow passing over the Earth over a period of about two hours. The image above shows the eclipse as it progressed over the Aleutian Islands, below you can see it a bit earlier as the Moon's shadow passed over Japan.

The first of four images captured by the LROC Narrow Angle Camera (NAC) during the Annular Eclipse of May 2012, as the Moon's shadow passed over Japan. Annotated NAC image E192192490L. View the original image accompanying the LROC release HERE [NASA/GSFC/Arizona State University].
The LROC NAC cannot easily acquire images of the Earth, and acquiring Earth views requires a significant amount of planning. The NAC is a line scanner, meaning that it has only one row of 5064 pixels per camera. Instead of snapping a single frame, an image is built up by the motion of the spacecraft in orbit about the Moon (about 1600 meters per second). To obtain an image of the Earth the spacecraft is turned 180° to face the Earth, then the spacecraft is pitched as quickly as possible (one-tenth of a degree per second), so that the image is built up line by line. You can see that two of the frames in the animated image below are slightly clipped, because LRO's timing wasn't perfect and the NAC ran out of lines before completing the scan (the NAC buffer is filled up after 52,240 lines, which is 256 Mbytes of data).

Zooming in on the Moon's shadow during the solar eclipse. NAC Image E192199689L. View the full size assembly HERE [NASA/GSFC/Arizona State University].
Because it was an annular eclipse, the shadow isn't totally dark; some sunlight still made it down to viewers of the eclipse as it passed over. The image below provides a zoomed in view of the Moon's shadow.

The eclipse was spectacular from the Moon, but it was also quite a view from within the Moon's shadow!

"Just barely," by E. Speyerer. A partial eclipse captured at the same moment as the LROC Featured Image "first of four," above (2012-142 00:33:41.036) from Kanarrville, Utah. The full eclipse had not quite reached Utah, thus the Moon is seen blocking only a small portion of the Sun. View the full size original accompanying the LROC image release HERE [E. Speyerer].
View the full resolution NAC eclipse image, HERE.

Revisit Earlier NAC images of the Earth from the Moon:

Wednesday, October 12, 2011

Moon in UV sheds light on maturation and materials

One of four "enigmatic" domes singled out in a segment of an LROC Wide Angle Camera (WAC) color mosaic released at the European Planetary Science Congress and the American Astronomical Society's Division for Planetary Sciences on October 7. Long suspected of being a separate species from more common volcanic features, like those of the Marius Hills, the Darney C 3 domes ("D" on the second image following) on the border of Mare Cognitum with Oceanus Procellarum (11.22°S, 333.5°E) may, instead, be fragments of a long obliterated lunar crust or islands, once high places now nearly buried  by the flows that created the nearside's basins. LRO orbits 4559 and 4560, June 22, 2010; from 44.9 km altitude, resolution ~ 62.5 meters per pixel [NASA/GSFC/Arizona State University].

Editors Note: Fairly reliable elemental maps of the Moon have been around since the Apollo era, becoming more detailed as planetary scientists continue to comb through data obtained by Clementine (1994) and Lunar Prospector (1998-1999) (along with those of the flotilla of probes dispatched by ESA, Japan, India and China). The highest-resolution direct observations of the Moon are still being swept up by the record-shattering Lunar Reconnaissance Orbiter, now well into a third year in low lunar orbit and only beginning to show a degree of age after the loss of Mini-RF operations and a redundant gyro this past year.

In December LRO will be raised to a more stable 100 km-high orbit to save fuel after orbiting the Moon 11,000 times since arriving in lunar orbit in June 2009, and long after becoming the longest lasting lunar mission as well, returning more data than all previous Deep Space missions put together.

LRO teams continue to use earlier abaselines to map confirm the abundance of a variety of strategic elements on the lunar surface, and in unprecedented detail.A promise made for delivering such comprehensive high-resolution color maps and elemental surveys of the Moon is being fulfilled.

What follows is "value-added" detail from a widely-circulated press release about presentations made by the Lunar Reconnaissance Orbiter Camera (LROC) investigators to a joint meeting of the European Planetary Science Congress and the American Astronomical Society's Division for Planetary Sciences on October 7. Along with the elusive original demonstration images we've added a number of mosaics of images already released to the Planetary Data System.

From a partial map of the nearside lunar surface centered on the colorful contact zone bordering Mare Serenitatis and Mare Tranquillitatis, combining observations in visible and ultraviolet wavelengths and showing a 'treasure trove' of areas rich in titanium oxide. Titanium is a valuable element, key to helping scientists unravel mysteries of the Moon's interior. LROC investigators Mark Robinson and Brett Denevi presented the results at the European Planetary Science Congress and the American Astronomical Society's Division for Planetary Sciences on October 7. The relative blue color of the Tranquillitatis mare is due to a higher abundances of the titanium-bearing mineral ilmenite. Direct study of samples gathered by Cernan and Schmitt (Taurus Littrow, Apollo 17, December 1972) aided in establishing baselines for comparable elemental signatures. Enhanced color formed as 689 nm filter image in red, 415 nm in green, and 321 nm in blue. See the full size demonstration image HERE [NASA/GSFC/Arizona State University].
Titanium relative abundance mapped
by Clementine (1994).
From: EPSC/ASA Joint Meeting 2011 Press Notice - October 7
 
Subtly Shaded Map of Moon Reveals Titanium Treasure Troves

"Looking up at the Moon, its surface appears painted with shades of grey -- at least to the human eye. But with the right instruments, the Moon can appear colorful," said Mark Robinson, of Arizona State University. "The maria appear reddish in some places and blue in others. Although subtle, these color variations tell us important things about the chemistry and evolution of the lunar surface. They indicate the titanium and iron abundance, as well as the maturity of a lunar soil."

The Lunar Reconnaissance Orbiter Camera (LROC) Wide Angle Camera (WAC) is imaging the surface in seven different wavelengths at a resolution of between 100 and 400 metres per pixel. Specific minerals reflect or absorb strongly certain parts of the electromagnetic spectrum, so the wavelengths detected by LROC WAC help scientists better understand the chemical composition of the lunar surface.

Robinson and his team previously developed a technique using Hubble Space Telescope images to map titanium abundances around a small area centred on the Apollo 17 landing site. Samples around the site spanned a broad range of titanium levels.  By comparing the Apollo data from the ground with the Hubble images, the team found that the titanium levels corresponded to the ratio of ultraviolet to visible light reflected by the lunar soils.

“Our challenge was to find out whether the technique would work across broad areas, or whether there was something special about the Apollo 17 area,” said Robinson.

Robinson’s team constructed a mosaic from around 4000 LRO WAC images collected over one month. Using the technique they had developed with the Hubble imagery, they used the WAC ratio of the brightness in the ultraviolet to visible light to deduce titanium abundance, backed up by surface samples gathered by Apollo and Luna missions.

The new map shows that in the mare titanium abundances range from about one percent to a little more than ten percent. In the highlands, everywhere TiO2 is less than one percent. The new titanium values match those measured in the ground samples to about one percent.

From a full-resolution LROC Wide Angle Camera three-color composite (566 nm filter image in red, 360 nm in green, and 321 nm in blue), "Figure 2" accompanying the October 7 press release, highlighting regions with varying mare compositions and certain of the more "enigmatic" small volcanic domes. The area shown is a familiar nearside territory, west longitude from around 340° to 320° and from the equatorial landing sites of Apollo 12 and 14 down to 21° south. View the full size image accompanying the October 7 press release HERE  [NASA/GSFC/Arizona State University].
Designated by the letter "H" in 'Figure 2' immediately above is 'the Helmet," apparently the official designation for the enigmatic dome previously known as Agatharchides 1 (and "the Fireman's Hat) for the associated crater group, may be an island of ancient crust 60 km wide floating northeast of Mare Humorum (18.2°S, 328.9°E). Mosaic of three LROC WAC observations in the 643 nm band, January 27, 2011 [NASA/GSFC/Arizona State University].

“We still don’t really understand why we find much higher abundances of titanium on the Moon compared to similar types of rocks on Earth.  What the lunar titanium-richness does tell us is that the interior of the Moon had less oxygen when it was formed, knowledge that geochemists value for understanding the evolution of the Moon,” said Robinson.

Lunar titanium is mostly found in the mineral ilmenite, a compound containing iron, titanium and oxygen. Future miners living and working on the Moon could break down ilmenite to liberate these elements.  In addition, Apollo data shows that titanium-rich minerals are more efficient at retaining particles from the solar wind, such as helium and hydrogen. These gases would also provide a vital resource for future human inhabitants of lunar colonies.

“The new map is a valuable tool for lunar exploration planning. Astronauts will want to visit places with both high scientific value and a high potential for resources that can be used to support exploration activities. Areas with high titanium provide both – a pathway to understanding the interior of the Moon and potential mining resources,” said Denevi, from John Hopkins University.

Based on it's spectacular rays and highly reflective deeper anatomy Giordano Bruno (35.9°N, 102.8°E) had once been believed the result of a very recent event, perhaps even a famous 12th century phenomena witnessed and recorded by European monks. Though that theory fell by the wayside some time ago, LROC Wide Angle Camera UV imagery has shown optical maturity by solar UV radiation occurs more rapidly than previously understood. In the LROC WAC UV mosaic below, more or less matching the area shown above of global lunar albedo mosaic from the 1994 Clementine mission, the wider area affected by the G. Bruno event is far less dramatic [NASA/DOD/VMA6].
On the other hand, in the LROC global UV mosaic (Figure 3 from the Oct. 7 press release: Color Ratio 321 nm / 415 nm), the full extent of the Goddard/Mare Marginis albedo swirl, contrasts with it's background quite well. The coincident crustal magnetic anomaly is antipodal to Mare Orientale, which, though the youngest of the classic impact basins is still estimated at over 3 billion years old. This image adds evidence to the theory that lunar swirls associated with fossil magnetic fields must result from a more dynamic phenomena than merely deflection of solar radiation by magnetic fields. Shedding and retaining charged sub-micron regolith must, in no small part, be linked with the Moon's "daily" dusty atmospheric cycles [NASA/GSFC/Arizona State University].

The new maps also shed light on how space weather changes the lunar surface. Over time, the lunar surface materials are altered by the impact of charged particles from the solar wind and high-velocity micrometeorite impacts. Together these processes work to pulverize rock into a fine powder and alter the surface’s chemical composition and hence its colour.  Recently exposed rocks, such as the rays that are thrown out around impact craters, appear bluer and have higher reflectance than more mature soil. Over time this ‘young’ material darkens and reddens, disappearing into the background after about 500 million years.

“One of the exciting discoveries we’ve made is that the effects of weathering show up much more quickly in ultraviolet than in visible or infrared wavelengths.  In the LROC ultraviolet mosaics, even craters that we thought were very young appear relatively mature. Only small, very recently formed craters show up as fresh regolith exposed on the surface,” said Robinson.

SCIENCE CONTACTS:
Mark Robinson 
Arizona State University
School of Earth and Space Exploration
E-mail: robinson@ser.asu.edu
http://ser.sese.asu.edu/
Brett Denevi

The Johns Hopkins University
Applied Physics Laboratory
Brett.Denevi@jhuapl.edu 

Figure 4 from the October 7 press release compares the familiar Reiner Gamma swirl in the visual with the UV (right), as seen in LROC WAC mosaics. Nearside swirls differ from those on the farside. They are fewer and none are linked with basin-forming impacts on the opposite side of the Moon. The beauty of the swirl at Reiner Gamma and the much more vague bright albedo of the Descartes Formation are associated with the strongest crustal magnetic anomalies yet mapped. Reiner Gamma is almost certainly linked geologically with the Marius Hills. Regardless, in ultra-violet, Reiner y seems too fresh and too superficial for an airless body whose surface is gardened every 2 million years. The Moon's dusty surface may be migrating very slowly, but it is surely on the move [NASA/GSFC/Arizona State University].
A seventy kilometer-wide field of view LROC WAC mosaic swept up during two orbital passes last May. The yellow box show the roughly 2.5 km-wide Narrow Angle Camera field of view shown in the last image, below. Something is allowing the radiation-linked maturation of lunar regolith in the dark lanes of Reiner Gamma and continually keeping the dust at the surface of its bright albedo fresh and optically (and UV) "immature." The intense crustal magnetism closely incidental with this very long but very superficial swirl anomaly may be linked to sub-surface flows of melt and remelted materials originating in the Marius Hills, where the swirl has a clear terminus, 200 kilometers to the northeast. Though the local magnetic field may be intense enough to refract solar radiation it is insufficient at repelling more energetic (or, admittedly less frequent) cosmic rays. Though less frequent, the latter would have had sufficient time to mature the brighter regions over the last 900 million years. Instead, it was proposed in 2008 by one of us (and more recently by Carle Pieters, et.al.) that a far more dynamic, seasonal and daily cycle of lunar dust formation, charging, discharging and relentless migration is being disrupted at these locations [NASA/GSFC/Arizona State University].
LROC Narrow Angle Camera (NAC) observation M114342150L, LRO orbit 1984, December 1, 2009 [NASA/GSFC/Arizona State University].
how to make gif
Juxtaposed LROC WAC mosaics of the Lassell dome formation designated with the letter "L" in the third image from the top in this posting, Figure 2 from the October 7 press release. From LRO orbital observations under different angles of incidence.  M129350040CE, orbit 4195, May 24, 2010 (phase angle 55.94°) and M147041474CE, orbit 6803, December 15, 2010 (phase angle 76.89°) [NASA/GSFC/Arizona State University].