Showing posts with label 3M Mapper. Show all posts

Tuesday, December 10, 2013

Strong hints of mixing seen in South Pole-Aitken M3 data

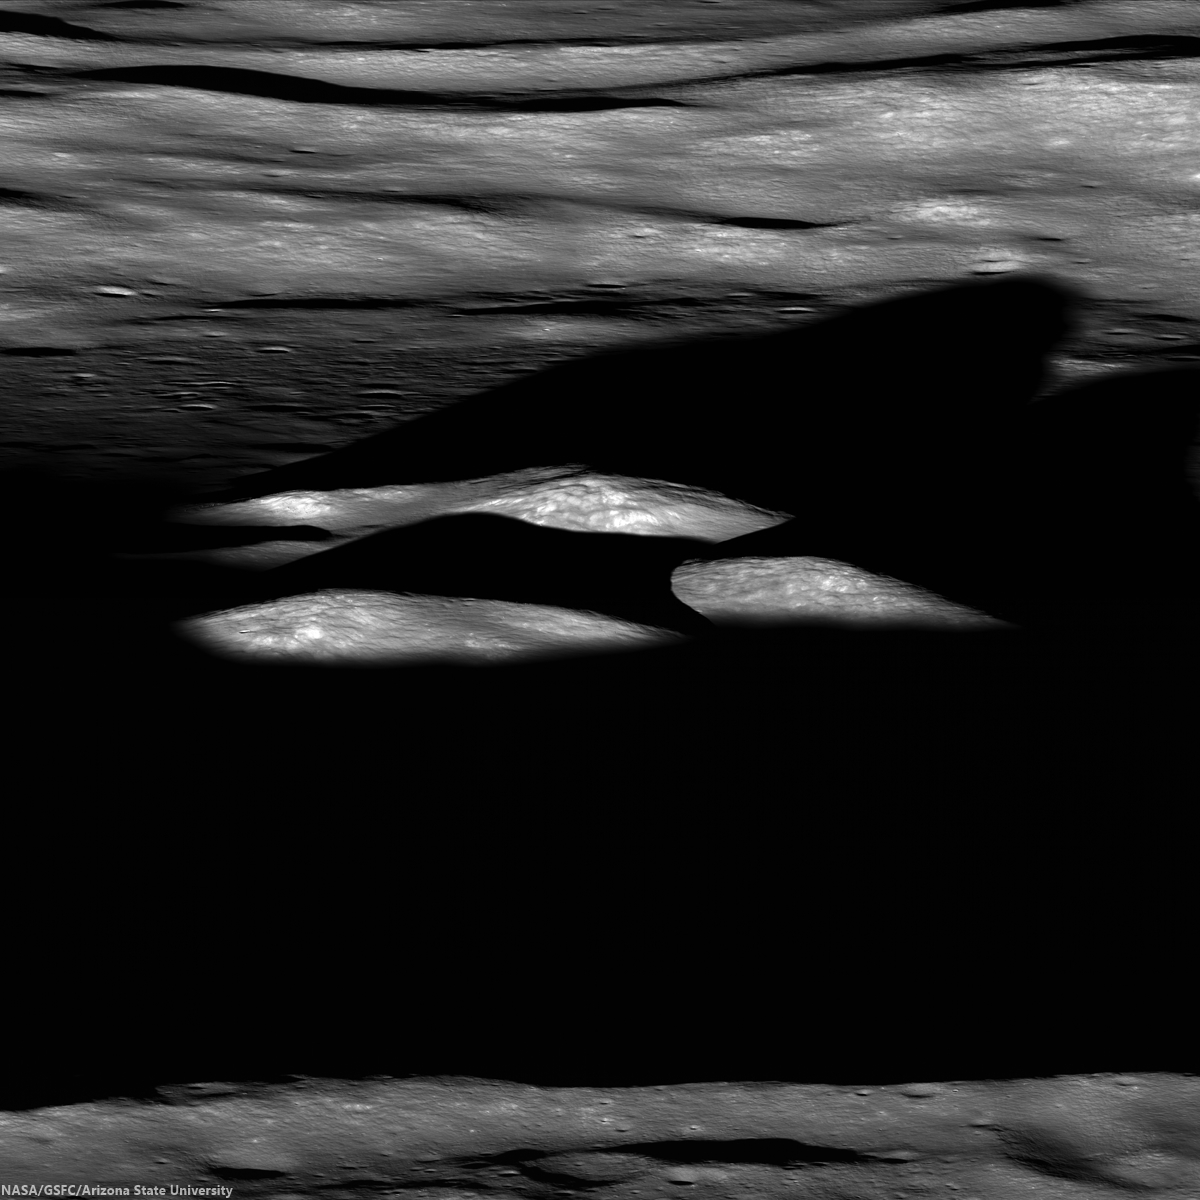
LROCNAC-bhabha_cpeak-1200
Last rays striking the central peaks of Bhabha crater, near the center of South Pole-Aitken basin, an oblique view from the west. LROC Featured Image, "Bhabha sinks into the shadows," July 21, 2010 [NASA/GSFC/Arizona State University].
PROVIDENCE, R.I. [Brown University] — Researchers from Brown University and the University of Hawaii have found some mineralogical surprises in the Moon’s largest impact crater.

Data from the Moon Mineralogy Mapper (M3) that flew aboard India’s Chandrayaan-1 lunar orbiter shows a diverse mineralogy in the subsurface of the giant South Pole Aitken basin. The differing mineral signatures could be reflective of the minerals dredged up at the time of the giant impact 4 billion years ago, the researchers say. If that’s true, then the South Pole Aitken (SPA) basin could hold important information about the Moon’s interior and the evolution of its crust and mantle.

The study, led by Brown graduate student Dan Moriarty, is published in online early view in the Journal of Geophysical Research: Planets.

At 2,500 kilometers across, the SPA is the largest impact basin on the Moon and perhaps the largest in the solar system. Impacts of this size turn tons of solid rock into molten slush. It has been assumed generally that the melting process would obliterate any distinct signatures of pre-existing mineralogical diversity through extensive mixing, but this latest research suggests that might not be the case.

LROCWACDTM-SPA-tour
South Pole-Aitken basin, with Bhabha and Leeuwenhoek craters noted, and more easily seen in the full resolution view, HERE [NASA/GSFC/SVS].
The study looked at smaller craters within the larger SPA basin made by impacts that happened millions of years after the giant impact that formed the basin. Those impacts uncovered material from deep within the basin, offering important clues about what lies beneath the surface. Specifically, the researchers looked at the central peaks of four craters within the basin. Central peaks form when material under the impact zone rebounds, forming an upraised rock formation in the middle of the crater. The tops of those peaks represent pristine material from below the impact zone.

Using Moon Mineralogy Mapper data, the researchers looked at the light reflected from each of the four central peaks. The spectra of reflected light give scientists clues about the makeup of the rocks. The spectra showed substantial differences in composition from peak to peak. Some crater peaks were richer in magnesium than others. One of the four craters, located toward the outer edge of the basin, contained several distinct mineral deposits within its own peak, possibly due to sampling a mixture of both upper and lower crust or mantle materials.

The varying mineralogy in these central peaks suggests that the SPA subsurface is much more diverse than previously thought.

“Previous studies have suggested that all the central peaks look very similar, and that was taken as evidence that everything’s the same across the basin,” Moriarty said. “We looked in a little more detail and found significant compositional differences between these central peaks. The Moon Mineralogy Mapper has very high spatial and spectral resolution. We haven’t really been able to look at the Moon in this kind of detail before.”

The next step is figuring out where that diversity comes from.
M1124763264LR-NSJ-0603-580x1200-61p-2800x5793
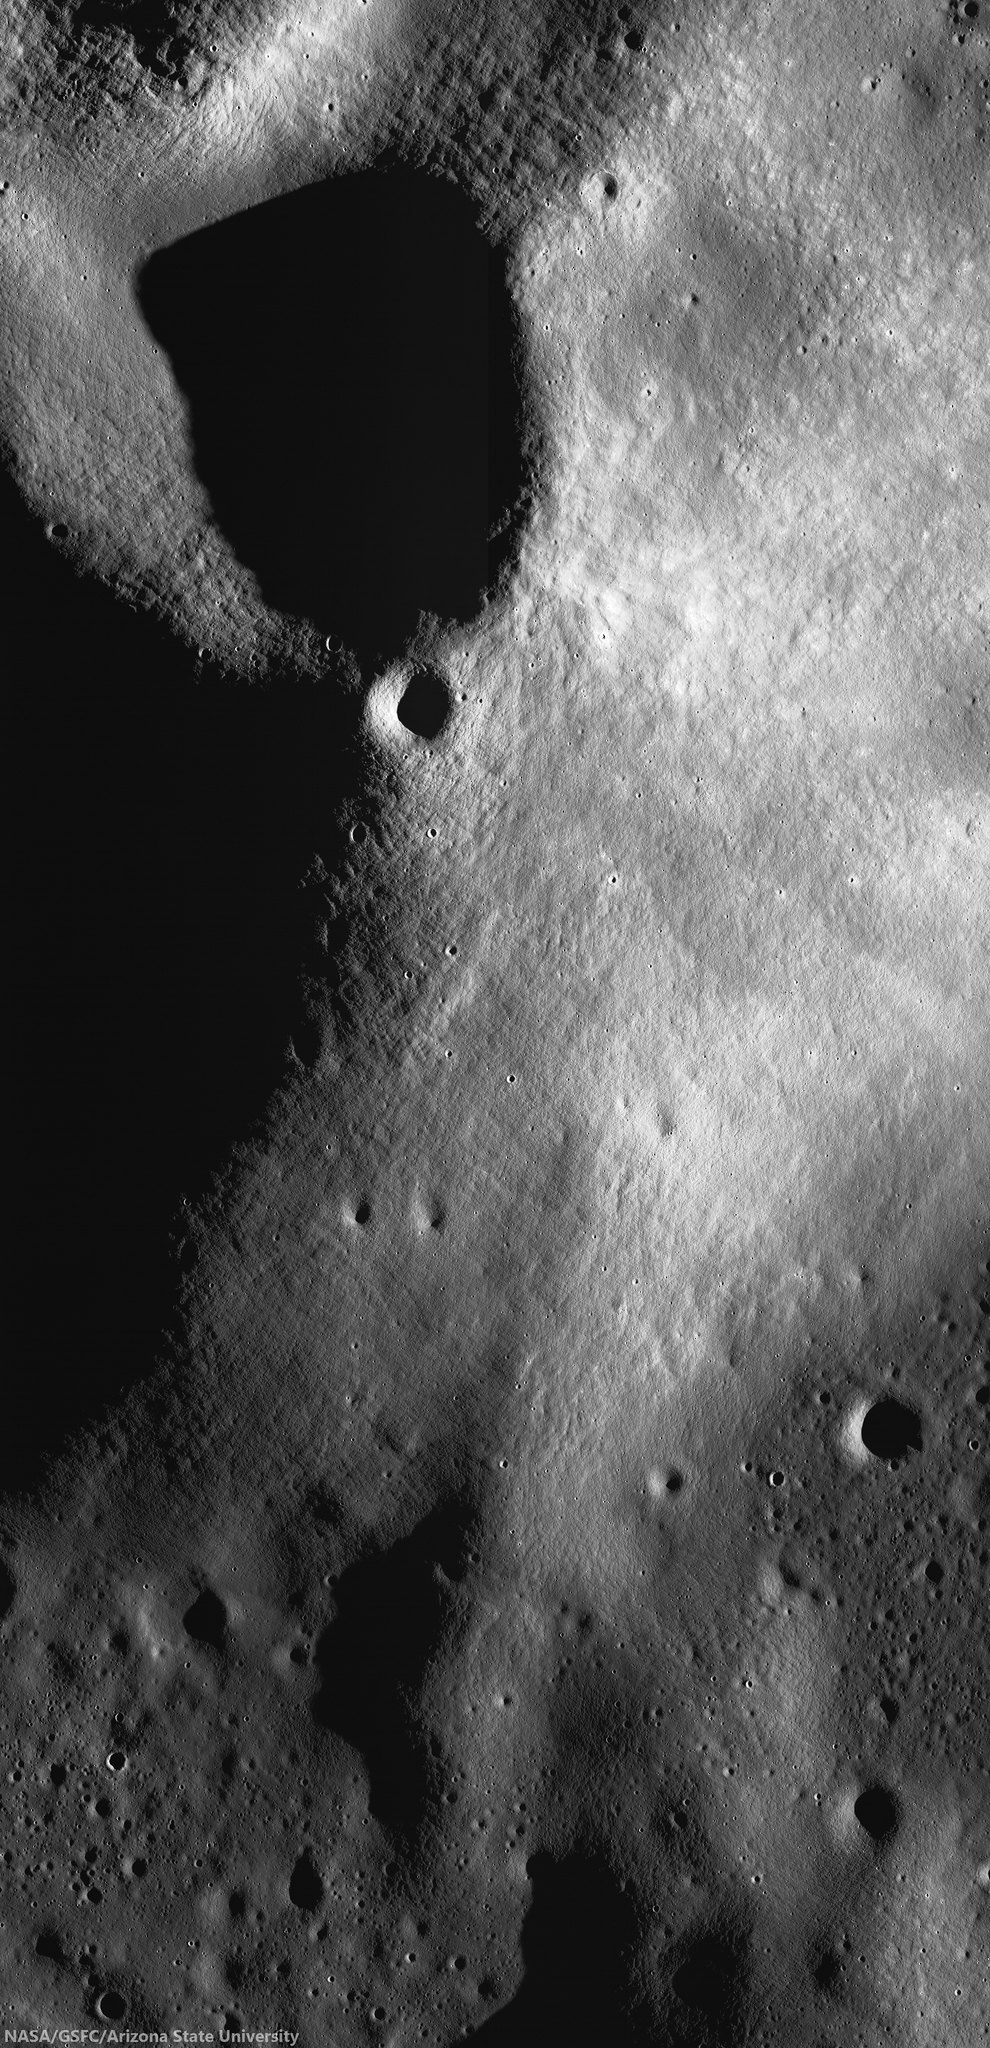
High-resolution view of small crater superpositioned on the south central peaks of Leeuwenhoek crater. Chandrayaan-1 Moon Mineralogical Mapper (3M) data studied by researchers at Brown University demonstrates evidence that lunar mantel was upthrust and exposed when Leeuwenhoek formed, perhaps close to the original transitory crater rim of 4.2 billion year old South Pole-Aitken basin. LROC NAC mosaic M1124763264RL, LRO orbit 17925, June 1, 2013; sunrise angle of incidence 83° resolution roughly 1.6 meters per pixel from 77.84 km [NASA/GSFC/Arizona State University].
It’s possible that the distinct minerals formed as the molten rock from the SPA impact cooled. Recent research from Brown and elsewhere suggests that such mineral formation in impact melt is possible. However, it’s also possible that the mineral differences reflect differences in rock types that were there before the giant SPA impact. Moriarty is currently undertaking a much larger survey of SPA craters in the hope of identifying the source of the diversity. If indeed the diversity reflects pre-existing material, the SPA could hold important clues about the composition of the Moon’s lower crust and mantle.

“If you do the impact scaling from models, [the SPA impact] should have excavated into the mantle,” Moriarty said. “We think the upper mantle is rich in a mineral called olivine, but we don’t see much olivine in the basin. That’s one of the big mysteries about the South Pole Aitken basin. So one of the things we’re trying to figure out is how deep did the impact really excavate. If it melted and excavated any material from the mantle, why aren’t we seeing it?”

If the impact did excavate mantle material, and it doesn’t contain olivine, that would have substantial implications for models of how the Moon was formed, Moriarty said.
8-SPA-meltpool-787
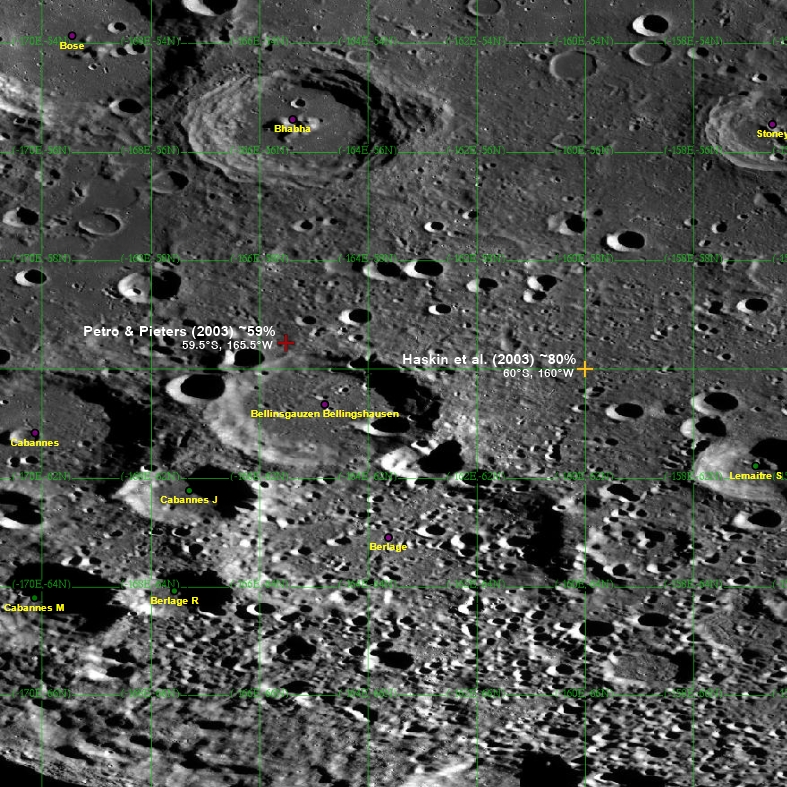
Two centers? The center of South Pole-Aitken basin is not yet agreed on, partly because it's oval shape is evidence of an oblique impact and also because of its immense age, with much of its original surface now erased. Subsequent impacts, however, has exposed deeper, perhaps the deepest and oldest materials, from the Moon's original formation [NASA/GSFC/Arizona State University].
Much more research is needed to begin to answer those larger questions. But this initial study helps raise the possibility that some of the original mantle mineralogy, if excavated, may be preserved in the Moon’s largest impact basin.

Carle Pieters, professor of geological sciences at Brown, and Peter Isaacson from the University of Hawaii were also authors on the paper. The work was supported by NASA’s Lunar Advanced Science and Exploration Research (LASER) program and the NASA Lunar Science Institute (NLSI).

Saturday, April 6, 2013

Do large impacts always erase surface mineralogy?

Our present all-encompassing view of the nearside landmark lunar crater Copernicus seems only a little different than the best photography from Earth. Only 20 degrees west and less than 10 degrees north of the 'center' of the Moon's tidally-locked hemisphere, the round rim appears only slightly oblong from angle seen from our backyards. Its general brightness, both inside and out, wash out much of the detail seen in this LROC Wide Angle Camera (WAC) monochrome (649 nm) montage made up of observations in six orbital passes in January 2010. Long recognized differences can easily be confirmed between the northwest quadrant and the remaining three-quarters of the crater floor may be more extraordinary than previously believed possible [NASA/GSFC/Arizona State University].
EDITORIAL NOTE: One of a handful of features on the Moon's nearside detectible to the naked eye, it's amazing what there is still to be learned about the majestic crater Copernicus. Not as young and bright as Tycho, with rays streaming over an entire hemisphere, it's rays are impressive enough and the larger Copernicus is distinctive enough be the namesake for an entire lunar Age, the "Copernican," the Moon's most modern period, encompassing features less than about 1.1 billion years old.

This has made the Copernican family of excavations very valuable to planetary scientists who utilize Earth's Moon as the Rosetta Stone of the Solar System (and, increasingly, our Earth - the planet with which it has shared precisely the same space in the universe for approximately 4.575 billion years.

Most likely mapped first by Galileo, the 93 kilometer impact crater has since his time been drawn and redrawn with with increasing precision and appreciation. Since the 19th century, and definitely since the latter half of the 20th century, Copernicus may be the lunar crater most individually photographed from Earth. A highly oblique orbital image captured from Lunar Orbiter 2, November 24, 1966, is one of only a handful of images popularly celebrated as a "Photograph of the Century." 

Detail (highly resampled) from Lunar Orbiter 2-162, oblique view from 26 km over the lunar surface south of Copernicus crater, November 24, 1966 [Moonviews].
That delicate telemetry was recovered and reprocessed by the phenomenal Lunar Orbiter Image Recovery Project (LOIRP) in 2009. Without question, we have learned a great deal about the Moon since 1957, but, until recently, not very much more about Copernicus crater than might have been inferred using a decent telescope here on Earth. It's complexity and subtle albedo has defied definitive understanding.

We have known for some, for example, it has at least two (or three) central peaks, and mulled over tantalizing indications of a twin set of widespread rays - hinting at a near simultaneous double impact. High-resolution analysis of its wide interior achieved greatest progress in study of the continued arrival of unambiguously remote sensing from India's Chandrayaan-1 and the U.S. Lunar Reconnaissance Orbiter (LRO) after beginning its on-going mission in close polar orbit in 2009. 

Hints that the northwest quadrant of its interior floor is very distinct from the remaining three-fourths slowly have finally come into focus, hopefully to stay.

The demarcation between the character of the western and eastern north floor of Copernicus has just become more obvious as images from LRO continued to improve. Those differences are particularly striking in spectral analysis, by the Clementine orbiter in 1994, for example. LROC WAC observation M147109260CE (643 nm), spacecraft orbit 6813, December 16, 2010; angle of incidence 77.97° at 60 meters per pixel resolution, from 43.13 km [NASA/GSFC/Arizona State University].
Now the distinguished lunar and planetary scientist Carle Pieters and a team at Brown University have added another set of clues to sharp lines from remote sensing of the northwest quarter of the floor of Copernicus that might have everyone refining or completely revising set theories about what happens in those fantastic and brief hours immediately following a highly energetic crater-forming impact.

Pre-existing mineral deposits on the Moon (sinuous melt, above) have survived impacts powerful enough to melt rock. Not detectable in the crater image (inset), deposits are visible only in light at certain wavelengths [NASA/Deepak Dhingra].
Brown University — April 2 — Despite the unimaginable energy produced during large impacts on the Moon, those impacts may not wipe the mineralogical slate clean, according to new research led by Brown University geoscientists.

The researchers have discovered a rock body with a distinct mineralogy snaking for (28.9 km) across the floor of Copernicus crater, a 60-mile-wide hole on the Moon’s near side. The sinuous feature appears to bear the mineralogical signature of rocks that were present before the impact that made the crater.

The deposit is interesting because it is part of a sheet of impact melt, the cooled remains of rocks melted during an impact. Geologists had long assumed that melt deposits would retain little pre-impact mineralogical diversity.

Large impacts produce giant cauldrons of impact melt that eventually cool and reform into solid rock. The assumption was that the impact energy would stir that cauldron thoroughly during the liquid phase, mixing all the rock types together into an indistinguishable mass. Identifying any pre-impact mineral variation would be a bit like dumping four-course meal into a blender and then trying to pick out the potatoes.

But this distinct feature found at Copernicus suggests that pre-existing mineralogy isn’t always blended away by the impact process.

“The takeaway here is that impact melt deposits aren’t bland,” said Deepak Dhingra, a Brown graduate student who led the research. “The implication is that we don’t understand the impact cratering process quite as well as we thought.”

Close up view of the feature marked with light green, designated "Surrounding Melt (Fe-Ca rich Pyroxene)" in the study illustration immediately above. LROC Narrow Angle Camera (NAC) observation M175408129R, spacecraft orbit 10984, November 8, 2011; resolution 41 cm per pixel from 26.06 kilometers [NASA/GSFC/Arizona State University].
The findings are published in online early view in the journal Geophysical Research Letters .

Copernicus is one of the best-studied craters on the Moon, yet this deposit went unnoticed for decades. It was imaging in 83 wavelengths of light in the visible and near-infrared region by the Moon Mineralogy Mapper — M3 — that made the deposit stand out like a sore thumb.

M3 orbited the Moon for 10 months during 2008-09 aboard India’s Chandrayaan-1 spacecraft and mapped nearly the whole lunar surface. Different minerals reflect light in different wavelengths at variable intensities. So by looking at the variation at those wavelengths, it’s possible to identify minerals.

In the M3 imaging of Copernicus, the new feature appeared as an area that reflects less light at wavelengths around 900 and 2,000 nanometers, an indicator of minerals rich in magnesium pyroxenes. In the rest of the crater floor, there was a dominant dip beyond 950 nm and 2400 nm, indicating minerals rich in iron and calcium pyroxenes. “That means there are at least two different mineral compositions within the impact melt, something previously not known for impact melt on the Moon,” Dhingra said.

It is not clear exactly how or why this feature formed the way it did, the researchers say. That’s an area for future study. But the fact that impact melt isn’t always homogenous changes the way geologists look at lunar impact craters.

“These features have preserved signatures of the original target material, providing ‘pointers’ that lead back to the source region inside the crater,” said James W. Head III, the Scherck Distinguished Professor of Geological Sciences and one of the authors of the study. “Deepak’s findings have provided new insight into the fundamentals of how the cratering process works. These results will now permit a more rigorous reconstruction of the cratering process to be undertaken.”

Carle Pieters, a professor of geological sciences at Brown and the principal investigator of the M3 experiment, was one of the co-authors on the paper, with Peter Isaacson of the University of Hawaii.

Monday, February 7, 2011

The Spectral Properties of Ina

Ahead of the 42nd Lunar & Planetary Science Conference, we highlighted selected presentations related to lunar science:

Ina, a unique 2.8 km-wide feature with a distinctly blue optical component originally spotted by Apollo astronauts from orbit. LROC Narrow Angle Camera observation M119815703, from 41.15 kilometers, orbit 2791, February 3, 2010; resolution 0.48 meters per pixel, incidence angle 56° [NASA/GSFC/Arizona State University].

THE SPECTRAL PROPERTIES OF INA: NEW OBSERVATIONS FROM THE MOON MINERALOGY MAPPER #2499.

Isaacson, Petro & Boardman et al
Planetary Science Institute, Brown University; NASA Goddard; AIG, LLC; U. Maryland; U. Tennessee

Introduction: The unusual morphology and appearance of Ina, originally referred to as ‘D-Caldera’ because of it’s unique shape (Figure 1), have been of interest to lunar scientists since it was first identified in Apollo images [1, 2]. Early studies of this 2.8 km wide depression interpreted it to be a lunar caldera or collapse pit, based in part on its location near the summit of a broad, low-relief dome [1-4]. The interior of Ina contains smooth mounds and small plateaus of positive relief surrounded by brighter and rougher, lower-lying floor materials [1-4]. Several lines of evidence suggest the presence of relatively fresh surfaces within the floor of the Ina depression [5,6]. These factors include the preservation state of small-scale relief, the small number of superposed craters and an apparent lack of significant space weathering associated with the bright interior regions. Based on these properties, portions of Ina’s interior have been interpreted as being less than 10 Myr old and perhaps still forming as the result of episodic outgassing from the deep interior of the Moon [6].

LPSC XLII (2011) Figure 1. Kaguya Terrain Camera morning image of Ina (light is from the east, mound features have positive relief).

Recent Narrow Angle Camera (NAC) images returned by the Lunar Reconnaissance Orbiter (LRO) are revealing the morphology of Ina at resolutions of up to 0.5 m/pixel [7]. While crater densities observed in this new data indicate an average age > 10 MY for the lower floor unit as a whole [7], the new data also show steep slopes and boulder fields down to the limit of resolution that may represent smaller areas of more recent disturbance. Reflectance data recently acquired by the Moon Mineralogy Mapper (M3) are assessed here to investigate the spectral properties and origin of these bright floor materials within Ina. M3 Data: The M3 imaging spectrometer was a guest instrument on India’s Chandrayaan-1 mission which launched on October 22, 2008 and mapped the lunar surface through August of 2009. M3 data of Ina and surrounding deposits were acquired twice in global mapping mode, which covered the wavelength range of ~430 to 3000 nm in 85 spectral bands. The first acquisition occurred in Optical Period 1b (OP 1b) at a spatial resolution of 140 m/ pixel and a phase angle of ~52 degrees. Preliminary M3 observations of Ina from this data acquisition are presented here. To provide an improved context for interpretation, M3 data have been co-aligned with Terrain Camera data from the Kaguya satellite (Figure 1) and topographic data acquired by the Lunar Orbiter Laser Altimeter (LOLA) aboard LRO.

LPSC XLII (2011) Figure 2. M3 mapper color composite (blue=460nm, green=1580nm, red=2780nm) overlaid on a Kaguya Terrain Camera image. Ina stands out from surrounding deposits due to its bright reflectance at blue wavelengths.

M3 Observations of Ina: Apollo 17 astronauts first observed the relatively blue color of the ‘rough, blocky’ floor materials in Ina that were described as having a ‘very light bluish-gray’ tint relative to surrounding materials, with raised bumps that were similar in color to surrounding terrain [8]. Figure 2 shows an M3 image of Ina in which these floor materials stand out relative to surrounding materials and the elevated interior mounds due to their bright reflectance in blue wavelengths of light (M3 460 nm band).

LPSC XLII (2011) Figure 3. Perspective view of Ina looking northwest, based on co-aligned 3M (Chandrayaan), Kaguya & LOLA (LRO) topographic data. Bright optically immature deposits on the floor of Ina appear green in this M3 color ratio composite due to a strong 1 micro-meter ferrous band relative to surrounding deposits (b=460/750nm, g=750/990, R=750/460nm) [NASA/JAXA/ISRO].

Figure 3 shows an example of a M3 ratio composite as a perspective view using LOLA topographic information. As in Figure 2, this image has been overlaid on Kaguya data to provide greater morphologic context for interpretation of the M3 reflectance data. This M3 data demonstrates that the strong ferrous absorption associated with relatively unweathered materials identified in previous studies [6] are related to bright floor materials within Ina, rather than broad topographic slopes. In contrast, the raised mounds within Ina lack a spectral signature associated with freshly exposed surfaces. Figure 4 compares floor materials within Ina displaying the strongest mafic bands to optically immature (‘fresh’) mare craters in Mare Serenitatis and Mare Tranquillitatis (low and high-titanium mare basalts, respectively). For these comparisons, the least weathered 1% of mare materials by surface area were sampled from each basalt type based models of mare maturity [9, 10]. The least-weathered floor materials within the Ina depression (average of eight 140m x140m pixels) are found to resemble very fresh materials within recent craters in Mare Tranquillitatis.

LPSC XLII (2011) Figure 4. A 3M reflectance spectrum of the brightest interior regions are compared to surrounding soils, as well as fresh mare craters in high and low titanium mare basalts.

Summary and Future Work: Preliminary examination of M3 data for the Ina structure is consistent with previous studies [6] that have identified relatively unweathered high-titanium basalts within the blocky floor materials. These results support the interpretation that floor materials within Ina have been disturbed recently enough to be spectrally similar to small, fresh mare craters within Tranquillitatis. Calibrations and analysis of the M3 Ina data are on-going and have yet to be fully corrected for thermal emission and scattered light. Future investigations will more fully explore these new data and associated lunar features for maturity and mineralogical information as well as the possible presence of volatile components. No significant signs of volatile components have been observed in preliminary analysis of these data.

References: [1] Whitaker, E. A. (1972), NASA SP-289, 25, 84-85, , [2] El-Baz, F and A. W. Warden (1972) NASA SP-289, 25, 1-25 [3] El-Baz, F. (1973) NASA SP-330, 30, 13-17. [4] Strain, P. and F. El-Baz (1980), PLPSC, 2437-2446. [5] Schultz, P.H. (1991), LPI Techn. Rept. 91-03, 37-38, [6] Schultz, P.H. et al. (2006), Nature, 444, 184-186. [7] Robinson, M. et al. (2010), LPSC 41, 2592 [8] Evans, R. E. and F. El-Baz (1972) NASA SP-289, 28,1-32. [9] Staid, M. and C. M. Pieters (2000), Icarus, 145, 122-139 [10] Wilcox et al. (2005), JGR, 110, E11001.
- 42nd Lunar and Planetary Science Conference (2011)

The LROC NAC frame at the beginning of this post superimposed on an LROC WAC monochrome mosaic that is, in turn, overlaid upon the lunar digital elevation model available to users of the Google Earth application (>v.5), looking northwest toward the eastern range of the Montes Apenninus more than 100 km away. This perspective is similar to that seen in Figure 3 -LPSC XLII (2003) #2499.

Friday, September 10, 2010

Chandrayaan-1 M3 lunar data released to Planetary Data System

Updated September 14, 2010 1336 UT

The M3 release of Optical Period 1, Level 1B data products, is now accessible via the online data volumes. Corresponding Level 0 data products are forthcoming as they are being updated by the team to ensure ease of use and compliance with PDS standards. More info can be found at the Chandrayaan-1 M3 mission page.

Note: The national treasure Charles A. Wood, curator of LUNAR PICTURE of the DAY (LPOD) posted what many will discover to be a more understandable summary of this important development HERE. - Ed.

Carle Pieters
Principal Investigator
Moon Mineralogy Mapper (M3)
Brown University

It is with great pleasure to announce that the first installment of Moon Mineralogy Mapper (M3) data has been released and is now available through PDS: http://img.pds.nasa.gov/ http://pds-imaging.jpl.nasa.gov/volumes/m3.html

M3 is an orbital imaging spectrometer that operated from 450 to 3000 nm. It was built at JPL and flown on India’s Chandrayaan-1 lunar spacecraft. Almost all data were taken in the lower resolution “Global” mode that includes 85 simultaneous co-registered spectral channels. More information about M3 can be found at the M3 website (being updated): https://m3.jpl.nasa.gov/NEWS/

This first release is Level 1B (L1B) spectral image cubes calibrated through radiance at sensor for Optical Period 1 (OP1) of Chandrayaan-1 operations, along with all their selenolocation and observation geometry back planes. No data re-sampling has been performed. L1B data for Optical Period 2 (OP2) are being processed and are expected to be released in December.

Higher-level calibrations continue, and Level 2 data (~reflectance) for both OP1 and OP2 are scheduled to be released in June 2011.

The M3 science team is planning a tutorial session to be held early in the week at Fall AGU for those who would like to learn more about how to work efficiently with M3 data. We will also schedule short presentations at the PDS exhibit during the week. The timing for both of these will be set after the AGU program is determined.

Best wishes from the M3 Team

Saturday, March 6, 2010

"Biggest, deepest crater" an excavation of the hidden, ancient Moon


Image 1. This is elevation map covering the northeastern portion of South Pole-Aitken basin, including the Apollo Basin, made using laser altimetry data from Japan’s Kaguya lunar orbiter. The false colors indicate height; red represents highlands, and blue represents the lowest areas. Dashed circles mark the location of the main and inner ring of the Apollo basin. The dashed line marks the location of the topographic profile illustrated in Image 2 below [JAXA/NASA/GSFC]. Full-resolution copy

Bill Steigerwald
NASA GSFC

Shortly after the Moon formed, an asteroid smacked into its southern hemisphere and gouged out a truly enormous crater, the South Pole-Aitken basin, almost 2400 km across and more than 8 km deep.

"This is the biggest, deepest crater on the Moon -- an abyss that could engulf the United States from the East Coast through Texas," said Noah Petro of NASA Goddard Space Flight Center. The impact punched into the layers of the lunar crust, scattering material across the Moon and out into space. The tremendous heat of the impact also melted part of the floor of the crater, turning it into a sea of molten rock.

That was just an opening shot. Asteroid bombardment over billions of years has left the lunar surface pockmarked with craters of all sizes and covered with solidified lava, rubble, and dust. Glimpses of the original surface are rare, and views into the deep crust rarer still.

Fortunately a crater on the edge of the South Pole-Aitken basin may provide just such a view. The Apollo Basin was formed by the later impact of a smaller asteroid, but still measuring a respectable 480 kilometers across.

"It’s like going into your basement and digging a deeper hole," said Petro. "We believe the central part of the Apollo Basin may expose a portion of the Moon’s lower crust. If correct, this may be one of just a few places on the Moon where we have a view into the deep lunar crust, because it’s not covered by volcanic material as many other such deep areas are. Just as geologists can reconstruct Earth’s history by analyzing a cross-section of rock layers exposed by a canyon or a road cut, we can begin to understand the early lunar history by studying what’s being revealed in Apollo."

Petro presented his results Thursday during the 41st annual Lunar and Planetary Science Conference in The Woodlands, Texas.

Petro and his team made the discovery with the Moon Mineralogy Mapper (M3), a NASA instrument on board India’s Chandrayaan-1 lunar-orbiting spacecraft. Spectral analysis of images from the experiment revealed portions of the interior of Apollo have a similar composition to the impact melt in the South Pole-Aitken (SPA) basin.

Image 2: This is a graph of the elevation (in meters) from the rim of the South Pole-Aitken basin through the Apollo basin made using data from Japan’s Kaguya spacecraft. The endpoints (A and A’) are marked in Image 1 above [JAXA/NASA/GSFC]. Full-resolution copy

As you go deeper into the Moon, the crust contains minerals have greater amounts of iron. When the Moon first formed, it was largely molten. Minerals containing heavier elements, like iron, sank down toward the core, and minerals with lighter elements, like silicon, potassium, and sodium, migrated to the top, forming the original lunar crust.

"The asteroid that created the SPA basin probably carved through the crust and perhaps into the upper mantle. The impact melt that solidified to form the central floor of SPA would have been a mixture of all those layers. We expect to see that it has slightly more iron than the bottom of Apollo since it went deeper into the crust. This is what we found with M3. However, we also see that this area in Apollo has more iron than the surrounding lunar highlands, indicating Apollo has uncovered a layer of the lunar crust between what is typically seen on the surface and that in the deepest craters like SPA," said Petro.

The lower crust exposed by Apollo survived the impact that created SPA probably because it was on the edge of SPA, several hundred miles from where the impact occurred, according to Petro.

Both SPA and Apollo are estimated to be among the oldest lunar craters based on the large number of smaller craters superimposed on over them. As time passes, old craters get covered up with new ones, so a crater count provides a relative age; a crater riddled with additional craters is likely to be older than one that appears relatively clean, with fewer craters overlying it. As craters form, they break up the crust and form regolith, an outermost layer of broken up rock gardened in to fine submicron-sized dust.

Image 3: Three views of the Apollo Basin taken with NASA’s Moon Mineralogy Mapper instrument on board India’s Chandrayaan-1 spacecraft. The false-color image on the right reveals composition; the blues indicate surfaces that don't have as much iron in them (highlands crusts which are low in iron in blue); other colors (teals, yellows, and oranges) indicate more iron-bearing minerals [NASA/ISRO]. Full-resolution copy

Although the Apollo basin is ancient and covered with regolith it still gives a useful view of the lower crust because the smaller meteorite impacts that create most of the regolith don’t scatter material very far.

"Calculations of how the regolith forms indicate that at least 50 percent of the regolith is locally derived," said Petro. "So although what we’re seeing with M3 has been ground up it still mostly represents the lower crust."

It’s likely Earth wasn’t spared the same bombardment experienced by the Moon. Giant craters on other worlds across the solar system, including Mercury and Mars, indicate bombardment was widespread. On Earth, however, the record of these events was largely eroded away long ago. Crust is recycled by plate tectonics and weathered by wind and rain, erasing ancient impact basins and obvious craters.

"The Apollo and SPA basins give us a window into the earliest history of the Moon, and the Moon gives us a window into the violent youth of Earth," said Petro.

The research was funded by NASA’s Discovery program, which conducts lower-cost, highly focused planetary science investigations designed to enhance our understanding of the solar system. M3 was managed by the NASA Jet Propulsion Laboratory in Pasadena, CA. Petro's team includes researchers from NASA Goddard, the University of Maryland, College Park, Brown University, Providence, RI, Analytical Imaging and Geophysics, LLC, Boulder, CO, the University of Tennessee at Knoxville, DARPA in Arlington, VA and the Johns Hopkins University Applied Physics Laboratory in Laurel, MD.

Thursday, October 15, 2009

Pieters-led team made historic lunar scan

Monique Vernon
The Brown Daily Herald

Water molecules have been found on the moon by a research team headed by Professor of Geology Carle Pieters (pictured, Left). But like many momentous scientific advances, the discovery was made almost by accident.

“You don’t expect any water on the moon,” Pieters said, and neither did her research team, which was studying lunar mineralogy. But when the team happened upon indications of water that at first confused them, they investigated further and discovered they were genuine.

“When our team saw a clear signature of water on the surface, we thought it was wrong,” Pieters said.

After months of probing and testing to try to resolve the disparity, the team later concluded that there are molecules of water and hydroxyl — a functional group consisting of hydrogen and oxygen — on the moon’s surface.

The team’s conclusion appeared in an issue of the journal Science alongside two other articles that concurred with Pieters’s findings. One research group’s instrument was on its way to Saturn and found similar readings using their spectrometer, while the other’s was on its way to a comet.

When the Indian Space Research Organization offered to carry foreign instruments on their Chandrayaan-1 spacecraft, Pieters and her team went to work on forming a detailed proposal to NASA to acquire funding to construct the instrument, known as the Moon Mineralogy Mapper, or M3. The project was accepted by NASA and the ISRO, and the Indian spacecraft containing the M3 launched successfully in October 2008.

With 10 months of data from the craft, the team was able to observe the water and hydroxyl molecules with a “unique detection using spectroscopy,” Pieters said.

“It is such a fantastic look at the way science works in the real world,” said Postdoctoral Research Associate in Geological Sciences Jeff Nettles. As a co-author of the Science paper, his role during the mission was to use software that processes and analyzes geospatial imagery to help analyze the surface.

Read the full article, HERE.

Friday, October 2, 2009

US 'red tape' dogged Chandrayaan - BBC

"The recent discovery of water on the Moon by India's inaugural lunar mission almost never happened because of a twin helping of good old-fashioned red tape and lingering Cold War suspicions, reports science writer Pallava Bagla."

Read the Story HERE.

Tuesday, September 29, 2009

Water, water, everywhere...

Paul Spudis
The Once and Future Moon
Smithsonian Air & Space

The extreme dryness of the Moon is established scientific dogma. The study of Apollo rock and soil samples pretty much had convinced scientists that the Moon has no water. Because its surface is in a vacuum and experiences extreme temperature swings at the equator (from -150° to 100° C), the Moon was believed to have a bone dry surface. Moreover, minerals that make up the lunar rocks not only have no water, but crystallized in a very reducing, waterless environment, indicating no significant water at depth.

Yet, some irritating facts suggested that the whole story was more complicated. Water is being added to the lunar surface. We know the Moon is bombarded with comets (mostly water ice) and meteorites rich in water-bearing minerals. Additionally, the solar wind (mostly hydrogen atoms or protons) constantly hits the surface, implanting itself into the dust grains and a possible source for the creation of water. An experiment laid out on the surface by the Apollo astronauts observed water vapor after the crew left the Moon. It was thought this vapor might be latent out-gassing from the Lunar Module descent stage, but scientists couldn’t be sure.

So what happens to all this water? Most of it is thought lost to space by a variety of processes, including dissociation by sunlight, thermal loss from the extremely high daytime temperatures, and sputtering induced by the impact of high-energy particles from space. Some areas near the poles of the Moon are permanently dark and cold, so if any of this stray water happened into them, they would be “trapped” forever in the dark areas. And although an extremely slow process, over millions of years a considerable amount of water ice might accumulate. But we don’t know how much water is made and how much might be present on the Moon.

Just published results from spectral mapping instruments on three different spacecraft indicate the presence of large amounts of either water or the OH molecule in the soils of the Moon. This water is present at high latitudes at both poles and occurs in sunlit areas (these instruments rely on reflected sunlight). Although the authors of these new results don’t understand the source of this water, they favor the creation of water by the interaction of solar wind with surface minerals. Solar wind protons reduce metal oxides in the soil, creating free metal (usually pure iron, Fe0) and water. The M3 Team suggested that this water might act as a source for the water believed to be trapped in the dark polar cold traps.

What’s surprising about this new data is not the presence of water, but its pervasiveness. The published image (below) shows this water to be present from the poles down to about 60° latitude. This area subtends over 10 million square kilometers, or about one-third the surface area of the entire Moon! Although the water appears to be present only in the upper few millimeters of the surface, its total mass could be enormous, greatly exceeding the several hundred million tones estimated to be present as ice in the dark areas of the poles.

As always with good science, the new results raise many more questions than they answer. In part, this is a “chicken or egg” issue – do the newly discovered deposits result from surface alteration by water derived from the polar ice, or do they serve as a source for such deposits? How does water form, move, get destroyed or get cold-trapped on the Moon? What are rates of water deposition and removal? What and where are the ice deposits and how pure might they be? Right now we can only dimly perceive the beginnings of a whole new sub-discipline of lunar studies: polar geoscience.

This exciting story isn’t over. More developments in this field are on the horizon. Results from other experiments carried aboard the Chandrayaan-1 spacecraft, including my own Mini-SAR imaging radar, have yet to be fully reported. The American Lunar Reconnaissance Orbiter (LRO) mission is settled into its mapping orbit and will be examining the Moon in detail over the next couple of years. Every time we get new data from the Moon or examine and map it with some new technique, we learn new and surprising facts.

In a future post, I’ll examine the implications of large amounts of lunar water for human return to the Moon and the possibilities for a permanent sustainable presence on our nearest planetary neighbor.

Stay tuned – things are getting very interesting.

Monday, September 28, 2009

Failure of Chandrayaan lost opportunity for high-res data on lunar water

Heads-Up to Doug Messier at Parabolic Arc. "Scientists would have gathered higher quality data about lunar water if India’s Chandrayaan-1 had fulfilled its full mission at the moon, Aviation Week reports:

"M3 managed to map 90 percent of the lunar surface at low resolution before Chandrayaan-1 stopped transmitting signals from lunar orbit on Aug. 29, having completed 10 months of a planned two-year mission."

"Had the mission continued, M3 would now be gathering high-resolution data."

The Indian Space Research Organisation (ISRO) experienced thermal issues almost from the time Chandrayaan arrived in lunar orbit, in late 2008, after weeks of successful, precision maneuvers.

It is thought mission planners may have underestimated the thermal environment in lunar orbit.

Early in the low-orbiting science phase of the mission, Chandrayaan nearly reached it's thermal tolerance while orbiting over the day-lit side of the Moon's surface. The Moon has a noted low thermal conductivity, meaning that much of the heat radiation from the Sun is immediately reflected from its surface.

Flight managers reportedly compensated for this exposure of the most sensitive components of the vehicle through carefully planned maneuvers, finally raising the mission's orbit to 200 kilometers just weeks before suddenly losing all contact with Chandrayaan hours after a joint survey of a permanently shadowed crater in the Moon's northern hemisphere with the newly-arrived American probe LRO, last Summer.

ESA: Novel Textile Antenna

Textile antenna Through the ESA Advanced Research in Telecommunications Systems (ARTES) 5 project 'Textile Antennas', the Finnish Patria Aviation Oy company has demonstrated that an antenna can be built using textiles that can be worn and used for personal satellite communication. The antenna is here seen attached to the sleeve of a jacket. [Patria Aviation Oy-ESA]

Friday, September 25, 2009

How to find water on the Moon


Graphs showing detailed measurements of light as a function of color or wavelength. The data, called spectra, are used to identify minerals and molecules. On the left spectra of lunar rocks, minerals and regolith returned to Earth by Apollo in visible to shorter-wavelengths IR range. The blue bar shows where a dip in the light is expected due to the presence of water and hydroxyl molecules. To the right are model spectra for pure water (H2O) and hydroxyl (OH-). [ISRO/NASA/JPL-Caltech/Brown]


These images from NASA's Moon Mineralogy Mapper (3M or '3-Qubed') on board the Indian Space Research Organisation (ISRO) Chandrayaan lunar orbiter show data for the near side. The image above shows albedo, or sunlight reflected sunlight from the lunar surface. The image below shows where infrared light is absorbed in a manner characteristic of the presence of water and hydroxyl molecules, most strongly at the cool, higher latitudes near the poles. The blue arrow indicates Goldschmidt crater, a large and feldspar-rich region with a bright water and hydroxyl signature. [ISRO/NASA/JPL-Caltech/Brown Univ.]


Goldschmidt crater, in the far northern hemisphere of the Moon as that region would be seen from Earth on the evening of this posting (Virtual Moon Atlas v.4) if it were possible to peer into the Moon's shadow, ahead of First Quarter when the sunrise terminator relief makes that region most conspicuous. The 127 km wide crater at 73° north is older than most similar features visible on the moon and dates from the pre-Nectarian, between the Moon's birth ~4.575 billion years and 3.9 billion years old.

Thursday, September 24, 2009

Spectral Cubes from '3-Qubed '


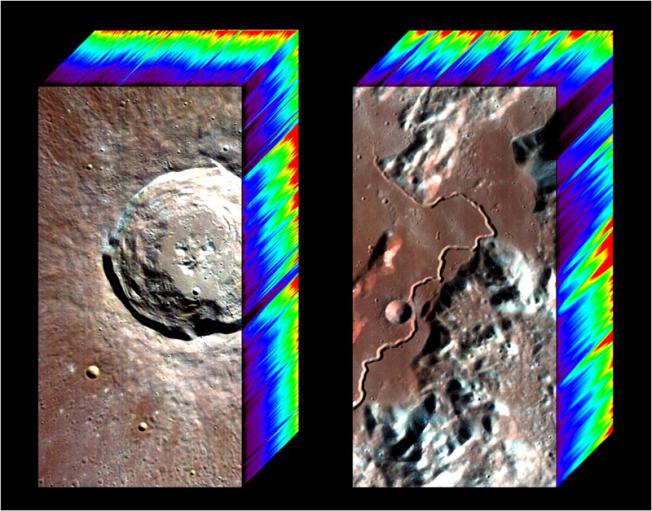
An image cube, demonstrating measurements by NASA's Moon Mineralogy Mapper (3M, or '3-Qubed') on the Indian Space Research Organisation (ISRO) Chandrayaan lunar orbiter. The rainbow-colored panels to the top and right represent the different reflected light, or spectral, signatures that underlie every point in the image. These signatures allow determination of the surface composition. This particular image cube was measured on Feb. 5, 2009 and includes the Apollo 15 landing site adjacent to Rima Hadley. [ISRO/NASA/JPL-Caltech/Brown]

Mineral Mapping the Moon

Early mineral map derived from the different spectral, signatures measured by NASA's Moon Mineralogy Mapper (3M) on board the Indian Space Research Organisation's Chandrayaan, before India's first lunar orbiter failed last month. The green, purple and blue areas are covered with iron-rich lava flows, similar to those of Hawai'i. The red and pink regions contain the mineral plagioclase, among the minerals found in granite on Earth. Measurements of iron (Fe) on the Moon is an important marker of the likely presence of the important compounds with which it is known to bond on the Moon, like titanium, and oxygen. From similar mineralogical maps derived from remote sensing from Clementine (1994) the presense of Helium-3, a possible fuel for advanced, clean nuclear fusion on Earth beyond 2050. [ISRO/NASA/JPL-Caltech/Brown]

'M-Qubed' dataset outlasts Chandrayaan

Clementine dataset (1994) finally begins an upgrade - Data from NASA's Moon Mineralogy Mapper instrument on the Indian Space Research Organisation (ISRO) Chandrayaan lunar orbiter reveals subtle, previously unknown diversity and features of lunar morphology, including water content. In a Quicktime movie, images taken at different wavelengths are assigned false colors, revealing the invisible make-up of the moon. Visible optical wavelengths run from ~0.4 to 0.75 mm while the Moon Mineralogy Mapper (3M) measured energy from the Moon from 0.45 through 3 mm, well into the infrared. The instrument had a spectrometer range divided into 86 bands in one mode and 260 in a higher-resolution mode. The animation takes a "random walk "through the data, with various combinations of images assigned colors of red, green and blue. Different color show various minerals and water on the surface of the Moon. This sampling is of just some of the data -- more information remains yet to be pulled out, still contained in the 1,000 Gigabyte 3M dataset. [ISRO/NASA/JPL-Caltech/Brown Univ./Analytical Imaging and Geophysics, LLC]

Cassini and Chandrayaan agree

This graph compares detailed spectra from the moon taken by the Visual and Infrared Mapping Spectrometer (VIMS) on Cassini spacecraft and NASA's Moon Mineralogy Mapper (3M) on the Indian Space Research Organisation (ISRO) Chandrayaan. The agreement between the two spacecraft is an excellent confirmation of the existence of water and hydroxyl (gray regions on the graph where wavelengths of infrared light range from 2.7 to 3.2 micrometers). The red dashed lines show thermal emission data which must be removed to better see the signature of water. The solid lines are the spectra after this thermal emission was removed. [NASA/ISRO/JPL-Caltech/USGS/Brown]

NASA instruments reveal water molecules in lunar surface

Minerally-bound water in the ejecta blanket of a fresh crater (less than 100 million years old) as detected in 1,000 gigabytes of data collected by NASA's 3M spectrograph as it flew aboard the Indian Space Research Organisation (ISRO) lunar orbiter Chandrayaan-1. A simular image was built showing hydroxels that was not spread from the point of impact in all direction, as is the water-bearing materials, showing that the hydroxel-bearing minerals were likely to have been excavated from some depth.

"The moon continues to surprise us," said Dr. Carle Peiters, principle investigator for the American-made 3M experiment on-board India's Chandrayaan lunar orbier. "Widespread water has been detected on the surface of the Moon."

Instruments aboard three spacecraft reveal water molecules in amounts greater than predicted.
Hydroxyl (OH) - molecules consisting of one oxygen and one hydrogen atom was also was found in the lunar soil, in greater abundance. The findings were published in Thursday's edition of the journal Science.

NASA's Moon Mineralogy Mapper, or "M3," instrument reported the observations. M3 was carried into space on Oct. 22, 2008 aboard the Indian Space Research Organization (ISRO) Chandrayaan-1 lunar orbiter. A more robust but very similar instrument, the Mini-RF mapper, is now operating on NASA's Lunar Reconnaissance Orbiter (LRO).

Data from the Visual and Infrared Mapping Spectrometer (VIMS) on Cassini spacecraft and the High-Resolution Infrared Imaging Spectrometer on NASA's EPOXI (AKA "Deep Impact") contributed to confirmation of the findings.

"Water ice on the moon has been something of a holy grail for lunar scientists for a very long time," said Jim Green, director of the Planetary Science Division at NASA Headquarters in Washington.

From lunar orbit M3's state-of-the-art spectrometer measured light reflecting off the moon's surface at IR wavelengths and revealed "a new level of detail in surface composition," according to NASA.

"When the M3 science team analyzed data from the instrument, they found the wavelengths of light being absorbed were consistent with the absorption patterns for water molecules and hydroxyl.

"For silicate bodies, such features are typically attributed to water and hydroxyl-bearing materials," said Carle Pieters, M3's principal investigator from Brown University. "When we say 'water on the moon,' we mean molecules of water and hydroxyl that interact with molecules of rock and dust specifically in the top couple of millimeters of the moon's surface. "

Whether this water is a result of solar wind interaction, out-gassing, cometary impacts, a combination of all of these and other lunar exospheric dynamics is not yet understood.

The M3 team found water molecules and hydroxyl at diverse areas of the sunlit region of the moon's surface, but the water signature appeared stronger at the moon's higher latitudes. Water molecules and hydroxyl previously were suspected in data from a Cassini flyby of the moon in 1999, but the findings were not published until now.

Roger Clark of the USGS, and a member also of the Cassini and 3M teams said the finding was not detected previously because removal of spurious detections of water is very much a part of the calibration process. Cassini was switched on during its fly-by of the Moon in November 1999 as calibration began and was immediately switched off until the vehicle approached Saturn. in 2004. Detection of a lunar water signature in the Cassini data was not apparent until 2008, after four years in Saturnian orbit.

"The data from Cassini's VIMS instrument and M3 closely agree," said Clark. "We see both water and hydroxyl." While the abundances and ratios are not precisely known, as much as 1,000 parts per million could be in the lunar soil. "To put that into perspective, if you harvested one ton of the top layer of the moon's surface, you could get as much as 32 ounces of water."

For additional confirmation, scientists turned to the "EPOXI" mission (AKA 'Deep Impact") and calibration data collected while it flew as close as 8 million kms from the moon in 2008 and June 2009 (on its way to a November 2010 encounter with comet Hartley 2).

That spacecraft confirmed the VIMS and M3 findings and expanded on them. "With our extended spectral range and views over the north pole, we were able to explore the distribution of both water and hydroxyl as a function of temperature, latitude, composition, and time of day," said Jessica Sunshine of the University of Maryland.

Sunshine is EPOXI's deputy principal investigator and also a scientist on the M3 team. "Our analysis unequivocally confirms the presence of these molecules on the moon's surface and reveals that the entire surface appears to be hydrated during at least some portion of the lunar day."

Because the EPOXI data in June 2008 were collected on two occassions, several days apart, Sunshine said, it was possible to see a stronger water signature at sunrise that dissipated at Noon and reaccumulated in the afternoon, before local sunset.

Meanwhile, ahead of the LCROSS impact on October 9, NASA is excited by the possibility of understanding lunar hydrology as a function of depth, as the impactor excavates as much as a meter deep into Cabeus A.

Wednesday, September 23, 2009

Strong hints of lunar H2O stirs excitement

This Mini-RF image from NASA's powerful Lunar Reconnaissance Orbiter shows radar imagery of the lunar south pole, a potential reservoir for hidden water ice, in new images released Sept. 17, 2009. [NASA/APL/LPSI]

Leonard David
Space.com

Earth's aged, crater-pocked and seemingly bone-dry moon may well sport a wet look.

That outlook is gaining momentum via a wealth of new scientific measurements gleaned by an international armada of moon-orbiting scientific scouts, including a report last week that craters near the lunar poles, always in shadow, may harbor water ice.

Such a prospect could fuel those eager to send human explorers back to the moon, to establish a base camp there, and to hone talent and hardware for jumping off to other destinations.

Locating, mining and processing polar deposits of water ice on the moon, it is reasoned, would add up to a useful resource for future lunar inhabitants.

The idea of ice in the floors of sunlight-shy polar lunar craters was first aired in 1961 by Caltech researchers Kenneth Watson, Bruce Murray and Harrison Brown. In the late 1970s, James Arnold of the University of California, San Diego, suggested that comets and water-rich asteroids crashing into the moon could deposit water to the lunar surface.

Still, is the chatter about new lines of evidence supportive of water ice at the lunar poles a slam-dunk situation?

"If ice is found we have to further explore it with landers, rovers, coring drills to assess its distribution and composition," explained Bernard Foing, project scientist for the European Space Agency's now-defunct SMART-1 lunar orbiter. Foing is also the director of the International Lunar Exploration Working Group.

After such an assessment is made, the next task would be to figure out how ice could be partly exploited on the spot in some areas to ease the next steps of human exploration toward an international lunar base, Foing said.

Read the Article HERE.

Chandrayaan-1 3M team: Abundant lunar H2O

NASA will hold a media briefing at 2 p.m. EDT on Thursday, Sept. 24, to discuss data from the moon collected by the twin to the Mini-RF radar mapper on board India's Chandrayaan-1.

NASA Television will provide live coverage of the briefing from NASA Headquarters, in Washington. Participants include:

* Jim Green, director, Planetary Science Division, Science Mission Directorate at NASA Headquarters in Washington
* Carle Pieters (pictured), principal investigator, Moon Mineralogy Mapper, Brown University
* Rob Green, project instrument scientist, Moon Mineralogy Mapper, NASA’s Jet Propulsion Laboratory in Pasadena.
* Roger Clark, team member, Cassini spacecraft Visual and Infrared Mapping Spectrometer and co-investigator, Moon Mineralogy Mapper, U.S. Geological Survey in Denver
* Jessica Sunshine, deputy principal investigator for NASA’s Deep Impact extended mission and co-investigator for Moon Mineralogy Mapper, Department of Astronomy, University of Maryland.
NASA

Wednesday, September 2, 2009

Chandrayaan's orientation problematic during joint Mini-SAR survey of Erlanger with LRO


Chandrayaan-1 initial Mini-SAR portrait of a permanently shadowed portion of south pole crater Haworth, as released by NASA in January.

In the week prior to the August 28 premature shut-down of IRSO's Chandrayaan-1 it's NASA-built Mini-SAR side-glancing radar mapper continued to frustrate scientists correcting for earlier problems with India's first lunar orbiter.

Chandrayaan remained improperly aligned with its Mini-RF counterpart on-board NASA's Lunar Reconnaissance Orbiter (LRO).

On August 20 researchers worked to retrieve data from Chandrayaan-1 Mini-SAR using the LRO still undergoing commissioning, as its own near twin Mini-RF radar simultaneously gathered similar data from a slighly different angle of the same target, the permanently shadowed floor of 10 km Erlanger crater, near the Moon's north pole.

The maneuver brought Chandrayaan-1 and it's more recently arrived companion for the United State, LRO, "within kilometers" of one another in polar orbit of the Moon.

New Scientist reports "each spacecraft made it to its planned position, but programming problems on the US-built Mini-SAR instrument aboard Chandrayaan prevented the device from sending a radio pulse," according to NASA's Jason Crusan in Washington.

"Later analysis showed that even if Mini-SAR had released the pulse, the signal would not have reached its target because Chandrayaan-1's orientation was drifting more rapidly than anticipated," Crusan said.

Chandrayaan-1 has been orienting itself using spinning gyroscopes and the sun since its star-tracking system failed earlier this year.

To correct for the problem of the failed star-tracker, "the team found a way to correct Mini-SAR's programming and better estimate Chandrayaan-1's drift. Then ground controllers abruptly lost radio contact with Chandrayaan-1 on 28 August – a death knell for the mission."

"We were actually in the middle of planning to conduct the experiment at a future time," Crusan told New Scientist.

"Obviously with the termination of the Chandrayaan mission, that will not happen."

Stewart Nozette of the Lunar and Planetary Science Institute in Houston, who lead work on Mini-SAR's sister-instrument on LRO, called Mini-RF, said the joint experiment would have produced a very clear signal of water ice if it were present," a strategic goal of most of the recent series of lunar orbiters, and a top priority for NASA, beginning with LRO together with the LCROSS mission, still set for a shepherded kinetic explosion within one of six shadowed craters near the Moon's south pole on October 9.

"I think that it would have been the icing on the cake if we had been able to do that," Nozette told New Scientist. "It would have been the best thing you can do from the remote sensing perspective."

Even so, radar collected by LRO and Chandrayaan-1 individually could still reveal water ice – though not as clearly, Nozette said. Water ice, it is believed, should appear brighter at RF frequencies than rock viewed from above with star-lit equipment.

If such a signal appears only in areas that are permanently shaded – where free volatiles should stay protected from solar energy, it could suggest the presence of water.

It may not be long before new information on the ice question is revealed. Chandrayaan-1 flew over "a lot of little craters that looked like they had ice" and mapped 95 per cent of the polar regions before its mission ended," Nozette said.

The radar results are currently in review.

Tuesday, September 1, 2009

Doomed Chandrayaan-1 yielding useful data on Moon’s mineralogy

24/7 Breaking News

The Indian Space Research Organization (ISRO) might have been compelled toprematurely terminate India’s first moon exploration mission, after it lost radio contact with Chandrayaan-1 over the weekend, but the probe is already said to have yielded a treasure trove of useful data.

Dr. Carle Pieters, planetary geologist at Brown University and principal investigator of the Moon Mineralogy Mapper (M3), built by NASA instrument on Chandrayaan-1, said, "Part of the M3 mission was to determine the distribution of elements and minerals on the moon’s surface, data that NASA had hoped would be useful for future manned missions to the moon or other planets."

Pieters says that before the probe prematurely ended, the M3 instrument had successfully completed a cursory global survey of mineralogy on the moon.

This first step set the stage for higher-resolution mapping of the lunar surface.

“(But) even with the low-resolution data we have from the first phase, we have several new and completely unexpected discoveries,” National Geographic News quoted her as saying.

She did not give any information as to what those discoveries might be. Other scientists are still reviewing the data.

Expressing “enormous disappointment” at the early loss of Chandrayaan-1, she revealed she and her colleagues were looking into a future flight of a duplicate M3 instrument.

“When you see fantastic results and taste success, it’s almost criminal not to plan for the future,” she said. (ANI)