Showing posts with label Spectrometry. Show all posts

Wednesday, January 1, 2014

Chang'e-3 APXS delivers its first surface analysis

Chang'e-3 Active X-ray Spectrometer (APXS)
Active Particle-induced X-ray Spectrometer (APXS) components on the Chang'e-3 "Yutu" lunar rover [Xinhua/CNSA/CLEP/IHEP/CAS].
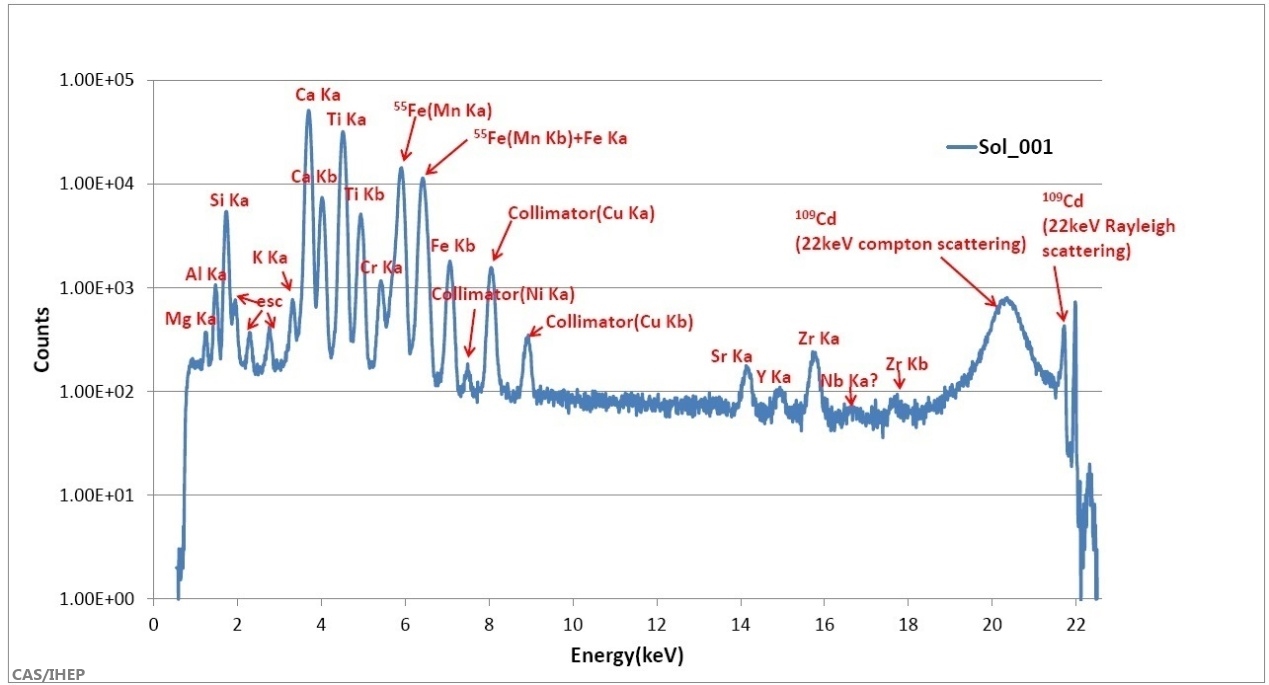
The Active Particle-induced X-ray Spectrometer (APXS), on the Yutu rover delivered to the lunar surface by the Chang’e-3 lunar lander, on December 25 sent back its first X-ray fluorescence spectrum of the lunar regolith around the landing site in northwest Mare Imbrium.

The announcement was made by the Institute of High Energy Physics (IHEP) of the Chinese Academy of Sciences (CAS), December 30.

Initial analysis indicates a marked presence of eight major rock-forming elements: magnesium, aluminum, silicon, potassium, calcium, titanium, chromium and iron (Mg, Al, Si, K, Ca, Ti, Cr and Fe) and at least three minor elements, strontium, yttrium and zirconium (Sr, Y and Zr) identified in this spectrum. 

Chang'e-1 (Yutu) APXS - Sol 1
First X-ray florescent spectrum of the lunar surface at the Chang'e-3 Mare Imbrium landing site (click to enlarge) [IHEP/CAS].
The energy resolution of APXS is estimated at roughly 135 at 5.9keV (thousand electron volts), demonstrating the small instrument is among the best X-ray spectrometers yet deployed in direct planetary exploration.

APXS was initially powered up on December 23, and in-flight calibration, establishing a baseline by analyzing a common basalt rock sample of known composition mounted on the rover, was completed over five minutes, preparing a stable performance on the lunar surface. After two terrestrial days APXS was successfully deployed to within two to three centimeters over the regolith of Mare Imbrium on the robotic arm of Yutu and began its designed operation. 

Complimenting its X-ray spectrometry, the APXS instrument measured returned X-ray count rate at various distances.

Yutu APXS components
APXS components (sensor head, radioactive heat unit (RHU) and inflight baseline calibration target [IHEP/CAS].
China's Institute of High Energy Physics (IHEP) developed APXS in collaboration with the China Academy of Science Purple Mountain Observatory (PMO). Before the on-going Chang'e-3 mission two X-ray Spectrometers developed by IHEP, flown on Chang’e-1 (2007) and Chang’e-2 (2010).

Saturday, May 5, 2012

Hubble: using moonlight to study Venus transit

A reduced resolution sample of an image from the Hubble Space Telescope, trained upon bright 109 million year old Tycho , with its hemisphere-wide ray system visible to the naked eye from Earth. A rare time when Hubble and human sight overlap. When Venus transits across the disk of the Sun a month from now, a rare event which will not occur again until 2117, Hubble will be trained on the Moon, using very subtle variations in the reflected sunlight to analyze Venus and its atmosphere [NASA/ESA/D. Ehrenbach (IPAG)].
This mottled landscape showing the impact crater Tycho is among the most violent-looking places on our Moon. Astronomers didn't aim NASA's Hubble Space Telescope to study Tycho, however. The image was taken in preparation to observe the transit of Venus across the Sun's face on June 5-6.

Hubble cannot look at the Sun directly, so astronomers are planning to point the telescope at the Earth's moon, using it as a mirror to capture reflected sunlight and isolate the small fraction of the light that passes through Venus's atmosphere. Imprinted on that small amount of light are the fingerprints of the planet's atmospheric makeup.

These observations will mimic a technique that is already being used to sample the atmospheres of giant planets outside our solar system passing in front of their stars. In the case of the Venus transit observations, astronomers already know the chemical makeup of Venus's atmosphere, and that it does not show signs of life on the planet. But the Venus transit will be used to test whether this technique will have a chance of detecting the very faint fingerprints of an Earth-like planet, even one that might be habitable for life, outside our solar system that similarly transits its own star. Venus is an excellent proxy because it is similar in size and mass to our planet.

The astronomers will use an arsenal of Hubble instruments, the Advanced Camera for Surveys, Wide Field Camera 3, and Space Telescope Imaging Spectrograph, to view the transit in a range of wavelengths, from ultraviolet to near-infrared light. During the transit, Hubble will snap images and perform spectroscopy, dividing the sunlight into its constituent colors, which could yield information about the makeup of Venus's atmosphere.

Hubble will observe the Moon for seven hours, before, during, and after the transit so the astronomers can compare the data. Astronomers need the long observation because they are looking for extremely faint spectral signatures. Only 1/100,000th of the sunlight will filter through Venus's atmosphere and be reflected off the Moon.

This image, taken with Hubble's Advanced Camera for Surveys, reveals lunar features as small as roughly 560 feet (170 meters) across. The large "bulls-eye" near the top of the picture is the impact crater, caused by an asteroid strike about 100 million years ago. The bright trails radiating from the crater were formed by material ejected from the impact area during the asteroid collision. Tycho is about 50 miles (80 kilometers) wide and is circled by a rim of material rising almost 3 miles (5 kilometers) above the crater floor. The image measures 430 miles (700 kilometers) across, which is slightly larger than New Mexico.

Because the astronomers only have one shot at observing the transit, they had to carefully plan how the study would be carried out. Part of their planning included the test observations of the Moon, made on Jan. 11, 2012, as shown in the release image.

Hubble will need to be locked onto the same location on the Moon for more than seven hours, the transit's duration. For roughly 40 minutes of each 96-minute orbit of Hubble around the Earth, the Earth occults Hubble's view of the Moon. So, during the test observations, the astronomers wanted to make sure they could point Hubble to precisely the same target area.

This is the last time this century sky watchers can view Venus passing in front of the Sun. The next transit won't happen until 2117. Venus transits occur in pairs, separated by eight years. The last event was witnessed in 2004. [NASA/ESA/Ehrenreich,  IPAG/CNRS/Université Joseph Fourie].

Monday, February 7, 2011

The Spectral Properties of Ina

Ahead of the 42nd Lunar & Planetary Science Conference, we highlighted selected presentations related to lunar science:

Ina, a unique 2.8 km-wide feature with a distinctly blue optical component originally spotted by Apollo astronauts from orbit. LROC Narrow Angle Camera observation M119815703, from 41.15 kilometers, orbit 2791, February 3, 2010; resolution 0.48 meters per pixel, incidence angle 56° [NASA/GSFC/Arizona State University].

THE SPECTRAL PROPERTIES OF INA: NEW OBSERVATIONS FROM THE MOON MINERALOGY MAPPER #2499.

Isaacson, Petro & Boardman et al
Planetary Science Institute, Brown University; NASA Goddard; AIG, LLC; U. Maryland; U. Tennessee

Introduction: The unusual morphology and appearance of Ina, originally referred to as ‘D-Caldera’ because of it’s unique shape (Figure 1), have been of interest to lunar scientists since it was first identified in Apollo images [1, 2]. Early studies of this 2.8 km wide depression interpreted it to be a lunar caldera or collapse pit, based in part on its location near the summit of a broad, low-relief dome [1-4]. The interior of Ina contains smooth mounds and small plateaus of positive relief surrounded by brighter and rougher, lower-lying floor materials [1-4]. Several lines of evidence suggest the presence of relatively fresh surfaces within the floor of the Ina depression [5,6]. These factors include the preservation state of small-scale relief, the small number of superposed craters and an apparent lack of significant space weathering associated with the bright interior regions. Based on these properties, portions of Ina’s interior have been interpreted as being less than 10 Myr old and perhaps still forming as the result of episodic outgassing from the deep interior of the Moon [6].

LPSC XLII (2011) Figure 1. Kaguya Terrain Camera morning image of Ina (light is from the east, mound features have positive relief).

Recent Narrow Angle Camera (NAC) images returned by the Lunar Reconnaissance Orbiter (LRO) are revealing the morphology of Ina at resolutions of up to 0.5 m/pixel [7]. While crater densities observed in this new data indicate an average age > 10 MY for the lower floor unit as a whole [7], the new data also show steep slopes and boulder fields down to the limit of resolution that may represent smaller areas of more recent disturbance. Reflectance data recently acquired by the Moon Mineralogy Mapper (M3) are assessed here to investigate the spectral properties and origin of these bright floor materials within Ina. M3 Data: The M3 imaging spectrometer was a guest instrument on India’s Chandrayaan-1 mission which launched on October 22, 2008 and mapped the lunar surface through August of 2009. M3 data of Ina and surrounding deposits were acquired twice in global mapping mode, which covered the wavelength range of ~430 to 3000 nm in 85 spectral bands. The first acquisition occurred in Optical Period 1b (OP 1b) at a spatial resolution of 140 m/ pixel and a phase angle of ~52 degrees. Preliminary M3 observations of Ina from this data acquisition are presented here. To provide an improved context for interpretation, M3 data have been co-aligned with Terrain Camera data from the Kaguya satellite (Figure 1) and topographic data acquired by the Lunar Orbiter Laser Altimeter (LOLA) aboard LRO.

LPSC XLII (2011) Figure 2. M3 mapper color composite (blue=460nm, green=1580nm, red=2780nm) overlaid on a Kaguya Terrain Camera image. Ina stands out from surrounding deposits due to its bright reflectance at blue wavelengths.

M3 Observations of Ina: Apollo 17 astronauts first observed the relatively blue color of the ‘rough, blocky’ floor materials in Ina that were described as having a ‘very light bluish-gray’ tint relative to surrounding materials, with raised bumps that were similar in color to surrounding terrain [8]. Figure 2 shows an M3 image of Ina in which these floor materials stand out relative to surrounding materials and the elevated interior mounds due to their bright reflectance in blue wavelengths of light (M3 460 nm band).

LPSC XLII (2011) Figure 3. Perspective view of Ina looking northwest, based on co-aligned 3M (Chandrayaan), Kaguya & LOLA (LRO) topographic data. Bright optically immature deposits on the floor of Ina appear green in this M3 color ratio composite due to a strong 1 micro-meter ferrous band relative to surrounding deposits (b=460/750nm, g=750/990, R=750/460nm) [NASA/JAXA/ISRO].

Figure 3 shows an example of a M3 ratio composite as a perspective view using LOLA topographic information. As in Figure 2, this image has been overlaid on Kaguya data to provide greater morphologic context for interpretation of the M3 reflectance data. This M3 data demonstrates that the strong ferrous absorption associated with relatively unweathered materials identified in previous studies [6] are related to bright floor materials within Ina, rather than broad topographic slopes. In contrast, the raised mounds within Ina lack a spectral signature associated with freshly exposed surfaces. Figure 4 compares floor materials within Ina displaying the strongest mafic bands to optically immature (‘fresh’) mare craters in Mare Serenitatis and Mare Tranquillitatis (low and high-titanium mare basalts, respectively). For these comparisons, the least weathered 1% of mare materials by surface area were sampled from each basalt type based models of mare maturity [9, 10]. The least-weathered floor materials within the Ina depression (average of eight 140m x140m pixels) are found to resemble very fresh materials within recent craters in Mare Tranquillitatis.

LPSC XLII (2011) Figure 4. A 3M reflectance spectrum of the brightest interior regions are compared to surrounding soils, as well as fresh mare craters in high and low titanium mare basalts.

Summary and Future Work: Preliminary examination of M3 data for the Ina structure is consistent with previous studies [6] that have identified relatively unweathered high-titanium basalts within the blocky floor materials. These results support the interpretation that floor materials within Ina have been disturbed recently enough to be spectrally similar to small, fresh mare craters within Tranquillitatis. Calibrations and analysis of the M3 Ina data are on-going and have yet to be fully corrected for thermal emission and scattered light. Future investigations will more fully explore these new data and associated lunar features for maturity and mineralogical information as well as the possible presence of volatile components. No significant signs of volatile components have been observed in preliminary analysis of these data.

References: [1] Whitaker, E. A. (1972), NASA SP-289, 25, 84-85, , [2] El-Baz, F and A. W. Warden (1972) NASA SP-289, 25, 1-25 [3] El-Baz, F. (1973) NASA SP-330, 30, 13-17. [4] Strain, P. and F. El-Baz (1980), PLPSC, 2437-2446. [5] Schultz, P.H. (1991), LPI Techn. Rept. 91-03, 37-38, [6] Schultz, P.H. et al. (2006), Nature, 444, 184-186. [7] Robinson, M. et al. (2010), LPSC 41, 2592 [8] Evans, R. E. and F. El-Baz (1972) NASA SP-289, 28,1-32. [9] Staid, M. and C. M. Pieters (2000), Icarus, 145, 122-139 [10] Wilcox et al. (2005), JGR, 110, E11001.
- 42nd Lunar and Planetary Science Conference (2011)

The LROC NAC frame at the beginning of this post superimposed on an LROC WAC monochrome mosaic that is, in turn, overlaid upon the lunar digital elevation model available to users of the Google Earth application (>v.5), looking northwest toward the eastern range of the Montes Apenninus more than 100 km away. This perspective is similar to that seen in Figure 3 -LPSC XLII (2003) #2499.

Wednesday, April 7, 2010

A New Lunar Globe as seen by Chandrayaan Moon Mineralogy Mapper: Image Coverage, Spectral Dimensionality and Statistical Anomalies


The composition of the Moon's surface, as mapped in unprecedented detail by the NASA-built Moon Mineralogy Mapper (M3), flown by the Indian Space Research Organisation (ISRO) Chandrayaan-1 lunar orbiter (2008-2009) [NASA].

Boardman and Pieters, et.al
AIG, LLC & Brown University; NASA JPL, USGS, University of Maryland, The Bear Flight Center, ACT, NASA GSFC & University of Tennessee

The Moon Mineralogy Mapper (M3), a NASA Discovery Mission of Opportunity, was launched October 22, 2008 from Shriharikota in India on board the Indian ISRO Chandrayaan-1 spacecraft for a nominal two-year mission in a 100-km polar lunar orbit. M3 was a high-fidelity imaging spectrometer with 260 spectral bands in Target Mode and 85 spectral bands in a reduced-resolution Global Mode. Target Mode pixel sizes are nominally 70 meters and Global pixels (binned 2 by 2) are 140 meters, from the planned 100-km orbit. The mission was cut short, just before halfway, in August, 2009 when the spacecraft ceased operations.

Despite the abbreviated mission and numerous technical and scientific challenges during the flight, M3 was able to cover more than 95% of the Moon in Global Mode. These data, presented and analyzed here as a global whole, are revolutionizing our understanding of the Moon. Already, numerous discoveries relating to volatiles and unexpected mineralogy have been published [1], [2], [3]. The rich spectral and spatial information content of the M3 data indicates that many more discoveries and an improved understanding of the mineralogy, geology, photometry, thermal regime and volatile status of our nearest neighbor are forthcoming from these data. Sadly, only minimal high-resolution Target Mode images were acquired, as these were to be the focus of the second half of the mission.

This abstract gives the reader a global overview of all the M3 data that were collected and an introduction to their rich spectral character and complexity. We employ a Principal Components statistical method to assess the underlying dimensionality of the Moon as a whole, as seen by M3, and to identify numerous areas that are low-probability targets and thus of potential interest to selenologists.

M3 Lunar Coverage Overview: M3 covered nearly the full Moon in Global Mode, but only collected a very small number of Target Mode images, due to the early demise of the spacecraft. There were a number of technical challenges during the mission that have complicated the data processing and calibration. These include thermal issues, loss of the star trackers and a raising of the orbit to 200-km in May of 2009. M3 was designed to operate over four three-month Optical Periods (solar beta angles 30 degrees or less).

Thermal issues caused us to also operate well outside these high-sun periods. M3 was able to complete two Optical Periods (OPs), each broken into sub-OPs based on instrument or spacecraft events and status. Figure 1 shows the M3 coverage during the five sub-OPs along with a cumulative coverage index of the gaps, the nearly full Global coverage and the limited Target images.


Figure 1: M3 coverages by five sub-Optical Periods (OP1a, OP1b, OP2a, OP2b, OP2c) and a cumulative coverage index (black/gray/white = gaps/global/target).

Spectral Dimensionality: Principal Components analysis is a simple, yet powerful, tool to begin to explore the M3 data dimensionality, its spanning spectral subspace and to quickly indentify lunar areas that are low-probability or anomalous. Figure 2 shows the eigenvalues on a log scale, for the entire Global dataset.


Figure 2: M3 full-mission Principal Component eigenvalues, plotted on a natural log scale with arrows delineating prominent breaks in signal-to-noise slope.

The M3 data set, treated as a global whole, has more than twelve distinct dimensions above the start of the noise floor. Indications of more subtle spectral signatures continue out to nearly dimension 60. As the calibration improves we expect the noise/artifact floor to lower and the signal space to increase in dimensionality. Figure 3 shows eigenvectors 1 through 12.


Figure 3: M3 full-mission Principal Component eigenvectors one through twelve.

The interplay of the spatial and spectral information is illustrated in Figure 4. It shows the PC images 1-10 for OP1b. While PC1 captures the familiar Moon, the RGB composites of PCs 2-10 begin to demonstrate the rich spectral diversity of the M3 Global data set.


Figure 4: M3 Principal Component images (nearside hemispheric view of OP1b data): PC 1 (as grayscale); PCs 2, 3, 4; PCs 5, 6, 7; PCs 8, 9, 10 (as RGB).

Statistical Anomalies: The Principal Components describe and orient the data-spanning spectral subspace, through the eigenvectors and eigenvalues of the covariance matrix. They also define the complementary null space. A measurement of the power of each spectrum in the null space is a simple yet robust anomaly detection method. Figure 5 shows a reference image for OP1b data over a color-coded anomaly detection image. While some instrument and data artifacts are obviously exposed, many of the small contiguous areas represent local regions of low-probability spectral signatures and bear further investigation.


Figure 5: OP1b reference image over color-coded anomaly detection result using PC null space power.

Summary and Conclusions: M3 covered nearly the full Moon in high-fidelity, 85-band Global Mode imaging spectrometry data. The data are informationrich, both spectrally and spatially, and are just beginning to help us build a new, hyperdimensional global view of the Moon.

References: [1] Pieters, C. M. et al. (2009) Science, 326, 568–572. [2] Pieters, C. M. et al. (2010) LPS XLI, this volume. [3] Sunshine, J. et al. (2010) LPS XLI, this volume.

Acknowledgments: We gratefully acknowledge support from the NASA Discovery Mission Program Office and profoundly thank our Indian launch and spacecraft hosts ISRO and their remarkable Chandrayaan-1 Mission Ops team.

KAGUYA/Chandrayaan-1 Cross-Calibration Meeting Ahmedabad 8-9 Feb. 2010

Thursday, September 24, 2009

Spectral Cubes from '3-Qubed '


An image cube, demonstrating measurements by NASA's Moon Mineralogy Mapper (3M, or '3-Qubed') on the Indian Space Research Organisation (ISRO) Chandrayaan lunar orbiter. The rainbow-colored panels to the top and right represent the different reflected light, or spectral, signatures that underlie every point in the image. These signatures allow determination of the surface composition. This particular image cube was measured on Feb. 5, 2009 and includes the Apollo 15 landing site adjacent to Rima Hadley. [ISRO/NASA/JPL-Caltech/Brown]

Monday, September 21, 2009

Successful Chandrayaan-1 X-ray Spectrometer

Science Daily

Although contact was lost with Chandrayaan-1 last month, the enhanced performance of the C1XS instrument, which exceeded its design specification, means that the science team will be able to determine the geochemistry of new areas of the lunar surface, adding some vital pieces to the jigsaw of the mineralogy of the lunar surface.

Read the article HERE.