Showing posts with label Eratosthenian. Show all posts

Tuesday, March 20, 2012

LROC: Absolute Time

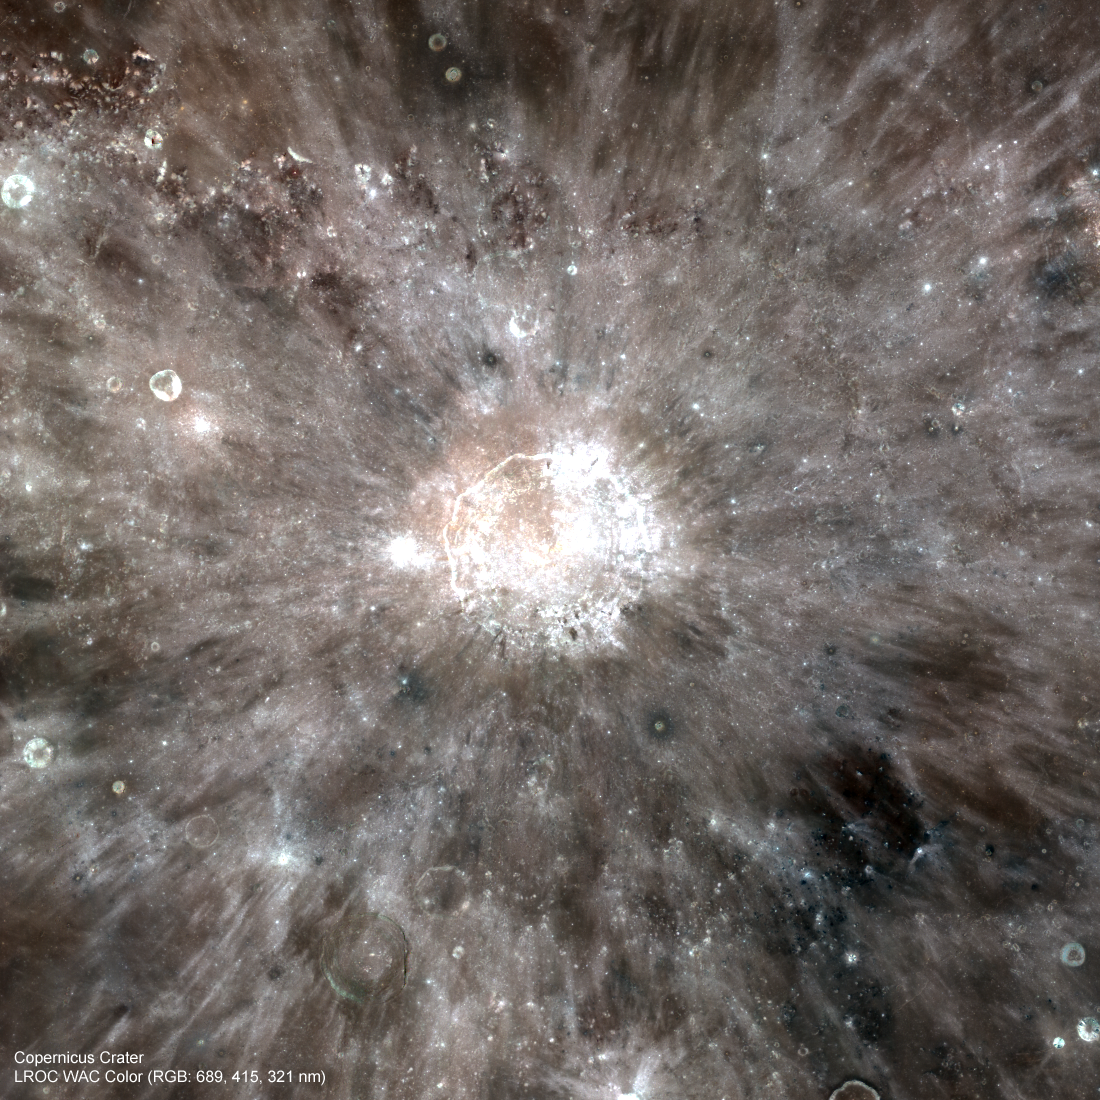
LROC Wide Angle Camera (WAC) visible to ultraviolet portrait of Copernicus crater, field of view 458 km. View the full size LROC Featured Image HERE [NASA/GSFC/Arizona State University].
Mark Robinson
Principal Investigator
Lunar Reconnaissance Orbiter Camera (LROC)
Arizona State University

Understanding how scientists determine the relative age of geologic units on the Moon is straightforward, most of the time. One simply follows the law of superposition; what is on top is younger, what is below is older. In some cases superposition relations are not clear, so scientists then compare crater densities. That is the number of impact craters on a common size of ground. Since impacts occur randomly both in time and on the Moon's surface, any piece of ground has an equal chance of being hit. Over time the number craters in a given area increases. Simply stated, the older an area the more craters you will find.

How do scientists determine the absolute age of a geologic unit? Somehow the crater counts (# of craters per area) have to be "connected" to absolute age dates. The rocks brought back by the Apollo astronauts provide that connection. For example, radiometric age dates of Apollo 11 and 17 basalts are 3.6 to 3.8 billion years (by) old, while those collected at the Apollo 12 are "only" 3.2 by old. Crater counts were taken of these three areas allowing absolute ages to be estimated for other places on the Moon that have crater densities between those of Apollo 12 and Apollo 11. What about absolute age dates for the other Apollo sites and the three Soviet Luna robotic samples? Can the range of time be extended beyond the range 3.2 by and 3.8 by? Unfortunately none of the young large mare basalts were sampled by any of these other missions. Look at the absolute age plot (below).

Newly modified (red points) lunar absolute age plot, from Hiesinger et al (2012). The blowup shows how the point for Copernicus now fits the curve after improved crater counts from new images. The y-axis is the count of the cumulative number of craters larger than 1 km in diameter per a surface area of 1 square km. The x-axis is the age of the surface in billions of years.
There is a very large gap in time (x-axis on the plot) for units less than 3.2 by old! Both the Copernicus and Tycho age dates are inferred. That is, scientists hypothesized that the Apollo 12 astronauts sampled part of a ray of Copernicus and Apollo 17 astronauts collected pieces of Tycho ejecta (from a distance of >1000 km from the crater itself). For thirty years the Copernicus date did not quite fit the chronology curve defined by all of the other samples. Perhaps the absolute age curve was in error, or perhaps Copernicus ray material was not actually sampled at the Apollo 12 landing site? Or perhaps the crater density value for Copernicus was not as accurate as it could be? New crater counts acquired from LROC WAC and NAC images and Kaguya images reveal a different crater density for Copernicus!

HDTV still of Copernicus from Japan's lunar orbiter SELENE-1 (Kaguya), released in 2009. View enlarged HERE [JAXA/NHK/SELENE].
Mystery solved, well perhaps. Scientists still have to live with the sparsity of absolute age points that define the chronology curve, for now. To really nail down the connection between crater density counts and absolute ages we need samples of middle aged and young mare (3 by to 1.5 by years). And samples are needed for very young impact materials (<100 million years), such as the craters Tycho, Aristarchus, and Giordano Bruno. Such samples will not only help scientists better define absolute ages all around the Moon, but also for Mercury, Mars and asteroids.

Explore one of the LROC NAC images used to improve the crater density statistics at Copernicus. The full story on improvements to the absolute lunar chronology can be found in:

"How old are young lunar craters?" Hiesinger, H., C. H. van der Bogert, J. H. Pasckert, L. Funcke, L. Giacomini, L. R. Ostrach, and M. S. Robinson; Journal of Geophysical Research, 117, E00H10, doi:10.1029/2011JE003935


Related LROC Featured Image Posts:
Copernicus Crater and the Lunar Timescale
Eratosthenes Crater and the Lunar Timescale

Tuesday, January 31, 2012

LROC: On the Floor of Thales

Full resolution detail from the LROC Featured Image, released January 31, 2012, showing contact between channelized impact melt and fractured melt on the floor of Thales crater. LROC Narrow Angle Camera (NAC) observation M170218508L, orbit 10219, September 9, 2011; incidence angle 64.16° with a resolution of 0.47 meters per pixel from 39.12 km. Image field of view 290 meters. See the 700 meter field of view HERE [NASA/GSFC/Arizona State University].
Lillian Ostrach
LROC News System

Many Copernican- and Eratosthenian-aged craters have substantial impact melt deposits within and surrounding them. Like so many other craters on the Moon, Thales crater (61.732°N, 50.284°E, ~31 km diameter) is remarkable in the diversity of geologic features observed in LROC NAC and WAC images. In the opening image, channelized impact melt flowed toward the crater floor from high up on the crater wall. The contact at which crater floor and wall meet is less distinct, but the change from channelized impact melt to fractured impact melt is representative of this boundary. 

Tomorrow's Featured Image will explore why impact melt may fracture a specific way, but suffice to say, the morphology of the impact melt in today's Featured Image is spectacular!

LROC WAC monochrome (604 nm) mosaic of Thales (61.732°N, 50.284°E) swept up at the same time as the NAC frame source of the Featured Image, September 9, 2011; resolution roughly 55.6 meters per pixel. .Yellow rectangle notes location of the LROC Featured Image, at the contact between crater wall and floor [NASA/GSFC/Arizona State University].
It is likely that impact melt channels formed in the crater walls as hot impact melt flowed from higher elevation toward the crater floor, using pre-existing weaknesses and cracks in the target rocks created by the violent impact event. As more impact melt flowed downhill, these channels may have grown larger. On average, these channels are between ~25 - 40 m across. Some channels appear shallower than others, which may suggest that more melt flowed down the deeper channels, carving more material from them. Or, perhaps the impact melt cooled and solidified in the shallower channels prior to reaching the crater floor, thus explaining the apparent channel depth differences across this small region of the crater wall. Comparatively, the fractures in the impact melt on the crater floor represent the relief of stress during cooling as the melt solidified near the crater floor-crater wall contact. These fractures may have been caused by the impact melt "sticking" to the lowermost portion of the crater wall as it cooled, similar to a mixture of cornstarch and water drying out.

Why don't you go for an adventure on the floor of Thales crater and discover the amazing impact melt morphologies visible in the full LROC NAC frame?

Related Posts:
Channelized impact melt
Fractured impact melt

Wednesday, October 12, 2011

LROC: Perched Boulders

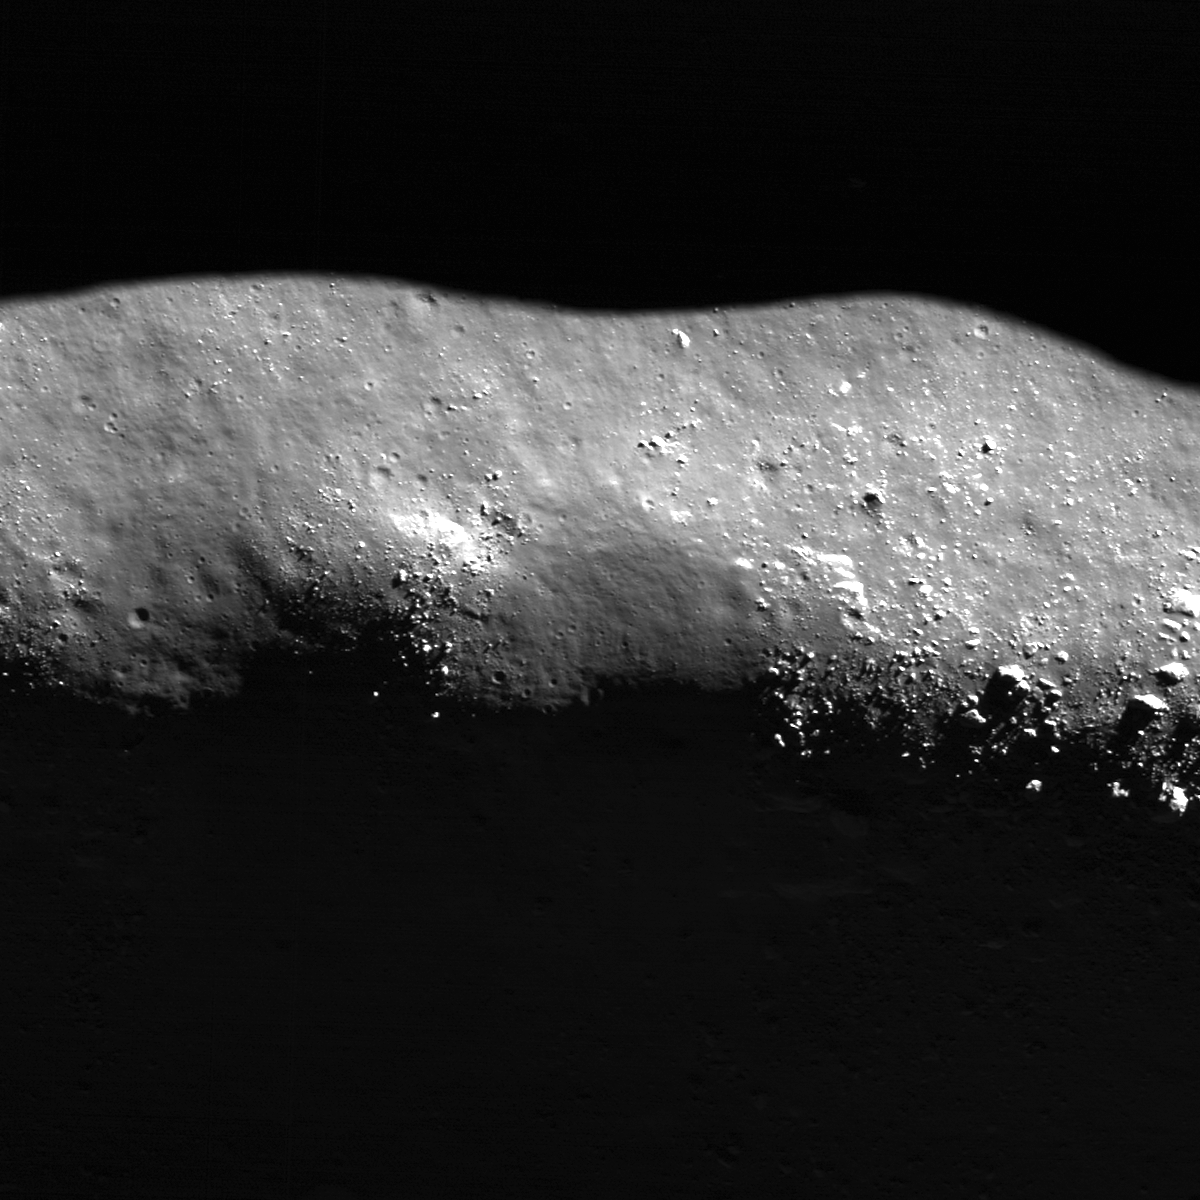
The crest of a linear floor fracture wall is intermittently covered by boulders and smoothed terrain. The largest boulders (lower part of image) are around 30 meters across. LROC Narrow Angle Camera (NAC) M159065590R, LRO orbit 8575, May 3, 2011; from top to bottom (north is to the right) field of view is 960 meters. See the full size LROC Featured Image HERE [NASA/GSFC/Arizona State University].

Lillian Ostrach
LROC News System

Boulders are found nearly everywhere on the Moon, and LROC NAC images allow scientists to study boulder populations. Why would anyone want to spend their time looking for boulders? Boulders represent erosional products on the Moon and can be used to help interpret geologic features and derive a geologic history for a region. Presently, erosion on the Moon largely occurs as a result of micrometeorite bombardment (for a short discussion, check out the Relative Age Relationships Featured Image). For example, the presence of boulders surrounding a 100 meter diameter crater in the mare suggests that when the crater formed, the impactor punched through the layer of regolith and excavated bedrock. Similarly, the boulders perched on wrinkle ridge crests and on the walls of sinuous rilles represent bedrock that is eroding out of these features over time. Perhaps the density or frequency of boulders on wrinkle ridge crests may be used to determine relative ages between features within a region. However, because erosion can be controlled by rock type and how fractured or deformed the rocks are, scientists need to carefully interpret their observations of boulder populations.

Today's Featured Image highlights boulders perched on the crest of a linear floor fracture wall within the central peak ring of Schrödinger basin (73.22°S, 133.82°E).Many of the boulders are around 5 to 10 meters across (although some are smaller), but near the lower edge of the image above the boulders are much larger, around 20to- 30 meters across. There are also more large boulders exposed downslope of the 20 - 30 m boulders compared to other boulder clusters. Why is there an apparent discrepancy?

To answer, we should consider several things. First, we must determine whether the boulders originate from the crest (in-situ) or are impact-derived (that is, they deposited by a nearby impact). Taking a look in the full Narrow Angle Camera frame, there is an approximately 7 kilometer in diameter Eratosthenian-Age crater about 30 kilometers north of the fractures. However, while there are boulders around 30 meters in size located in clusters surrounding the crater the continuous ejecta blanket (for a crater generally) is confined to one crater diameter. Since the fractures are much farther than 7 km from the crater the boulders on the fracture wall crest are probably not derived from that crater.

What about other nearby craters? While there are several craters nearby (check out the LROC WAC context below), none of them are particularly fresh nor bouldery. Based on these observations, the boulders probably orignated in-situ as a result of erosion. Thus, the apparent discrepancy in boulder sizes along the crest may be related to the deformation of the rock during fracture formation and mare flooding of Schrödinger. Right now, though, we do not have a definitive answer; however, to examine this topic further, we would need to complete a survey of boulder sizes and distributions along the length of the fractures. Even then, we may not be able to explain why some boulder groupings contain larger sized boulders.

LROC Wide Angle Camera (WAC) monochrome mosaic showing and area located slightly north of the center of Schrödinger basin with the northern portion of the central peak ring near the top of the image. (Asterisk notes the location of today's Featured Image image.) View the full size LROC WAC context mosaic showing the deep interior of Schrödinger basin HERE [NASA/GSFC/Arizona State University].
Now that we found evidence to suggest that the boulders are probably related to the erosion of the crest of the fracture wall we need to try to explain the smoothed portions of the crest.

In the opening image, there are boulder clusters separated by smoothed areas. What is this smooth stuff? Regolith, the lunar soil, is generated by impacts - big and small - and over time accumulates on the lunar surface. When a surface is covered entirely by regolith, it looks smooth and sometimes has a textured appearance. So, these smooth regions are accumulations of regolith on the wall crest and also along the fracture walls. But then why isn't the crest all smooth, or all bouldery? The illumination and where the shadows lie across the ridge crest may be a clue; these smooth areas have shadows that are not in-line with the bouldery portions of the crest and look like they may be lower topographically than the bouldery parts or may be less steeply sloped than the parts of the crest where boulders are. Again, taking a look at the full NAC frame may help, too, because in the full image there are other smooth regions that are associated with obvious changes in topography and slope along the crest. If we then assume that the smoother regions have a shallower slope at the crest, we may have an answer: boulders are more likely to form along steep slopes of crests where the slope break is steepest (here along the fracture wall crest, or along wrinkle ridges). This is only one explanation based on visual explanation, but we really should take some time to measure slopes in a NAC-derived Digital Terrain Model (DTM) to be certain that we are on the right track.