|
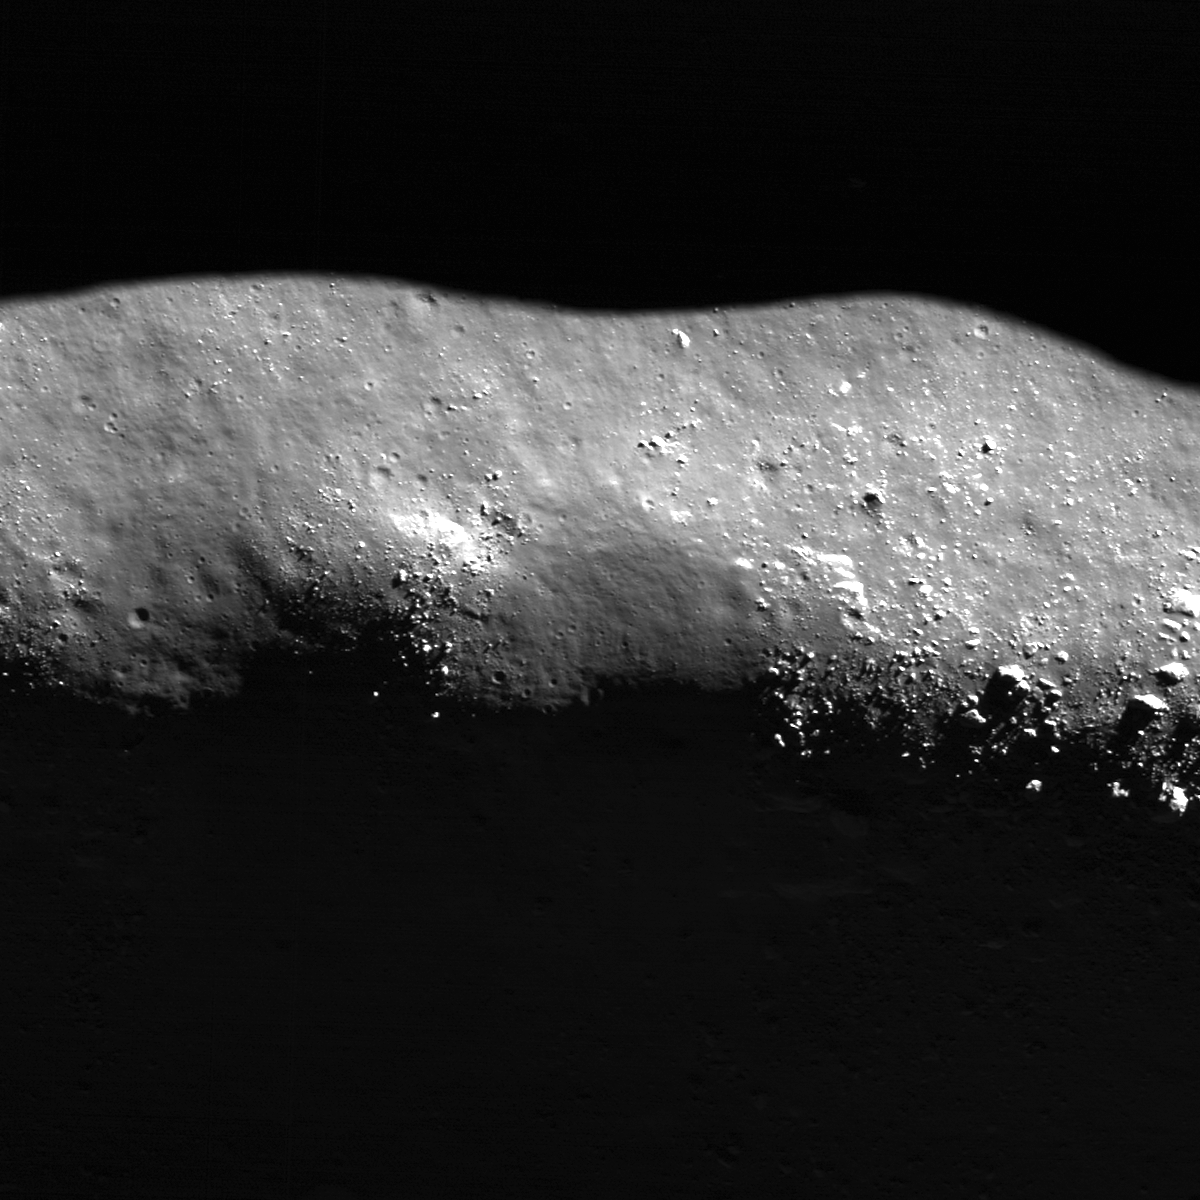
| The crest of a linear floor fracture wall is intermittently covered by
boulders and smoothed terrain. The largest boulders (lower part of
image) are around 30 meters across. LROC Narrow Angle Camera (NAC) M159065590R, LRO orbit 8575, May 3, 2011; from top to bottom (north is to the right) field of view is 960 meters. See the full size LROC Featured Image HERE
[NASA/GSFC/Arizona State University]. |
Lillian Ostrach
LROC News System
Boulders are found nearly everywhere on the Moon, and LROC NAC images allow scientists to study boulder populations. Why would anyone want to spend their time looking for boulders? Boulders represent erosional products on the Moon and can be used to help interpret geologic features and derive a geologic history for a region. Presently, erosion on the Moon largely occurs as a result of micrometeorite bombardment (for a short discussion, check out the
Relative Age Relationships Featured Image). For example, the presence of boulders surrounding a 100 meter diameter crater in the mare suggests that when the crater formed, the impactor punched through the layer of regolith and
excavated bedrock. Similarly, the boulders perched on
wrinkle ridge crests and on the walls of
sinuous rilles represent bedrock that is eroding out of these features over time. Perhaps the density or frequency of boulders on wrinkle ridge crests may be used to determine relative ages between features within a region. However, because erosion can be controlled by rock type and how fractured or deformed the rocks are, scientists need to carefully interpret their observations of boulder populations.
Today's Featured Image highlights boulders perched on the crest of a linear floor fracture wall within the central peak ring of Schrödinger basin (73.22°S, 133.82°E).Many of the boulders are around 5 to 10 meters across (although some are smaller), but near the lower edge of the image above the boulders are much larger, around 20to- 30 meters across. There are also more large boulders exposed downslope of the 20 - 30 m boulders compared to other boulder clusters. Why is there an apparent discrepancy?
To answer, we should consider several things. First, we must determine whether the boulders originate from the crest (
in-situ) or are impact-derived (that is, they deposited by a nearby impact). Taking a look in
the full Narrow Angle Camera frame, there is an approximately 7 kilometer in diameter Eratosthenian-Age crater about 30 kilometers north of the fractures. However, while there are boulders around 30 meters in size located in clusters surrounding the crater the continuous ejecta blanket (for a crater generally) is confined to one crater diameter. Since the fractures are much farther than 7 km from the crater the boulders on the fracture wall crest are probably not derived from that crater.
What about other nearby craters? While there are several craters nearby (check out
the LROC WAC context below), none of them are particularly fresh nor bouldery. Based on these observations, the boulders probably orignated in-situ as a result of erosion. Thus, the apparent discrepancy in boulder sizes along the crest may be related to the deformation of the rock during fracture formation and mare flooding of Schrödinger. Right now, though, we do not have a definitive answer; however, to examine this topic further, we would need to complete a survey of boulder sizes and distributions along the length of the fractures. Even then, we may not be able to explain why some boulder groupings contain larger sized boulders.
 |
| LROC Wide Angle Camera (WAC) monochrome mosaic showing and area located slightly north of the center of
Schrödinger basin with the northern portion of the central peak ring
near the top of the image. (Asterisk notes the location of today's Featured Image image.)
View the full size LROC WAC context mosaic showing the deep interior of
Schrödinger basin HERE [NASA/GSFC/Arizona State University]. |
Now that we found evidence to suggest that the boulders are probably related to the erosion of the crest of the fracture wall we need to try to explain the smoothed portions of the crest.
In the opening image, there are boulder clusters separated by smoothed areas. What is this smooth stuff? Regolith, the lunar soil, is generated by impacts - big and small - and over time accumulates on the lunar surface. When a surface is covered entirely by regolith, it looks smooth and sometimes has a textured appearance. So, these smooth regions are accumulations of regolith on the wall crest and also along the fracture walls. But then why isn't the crest all smooth, or all bouldery? The illumination and where the shadows lie across the ridge crest may be a clue; these smooth areas have shadows that are not in-line with the bouldery portions of the crest and look like they may be lower topographically than the bouldery parts or may be less steeply sloped than the parts of the crest where boulders are. Again, taking a look at the full NAC frame may help, too, because in the full image there are other smooth regions that are associated with obvious changes in topography and slope along the crest. If we then assume that the smoother regions have a shallower slope at the crest, we may have an answer: boulders are more likely to form along steep slopes of crests where the slope break is steepest (here along the fracture wall crest, or along wrinkle ridges). This is only one explanation based on visual explanation, but we really should take some time to measure slopes in
a NAC-derived Digital Terrain Model (DTM) to be certain that we are on the right track.