
 |
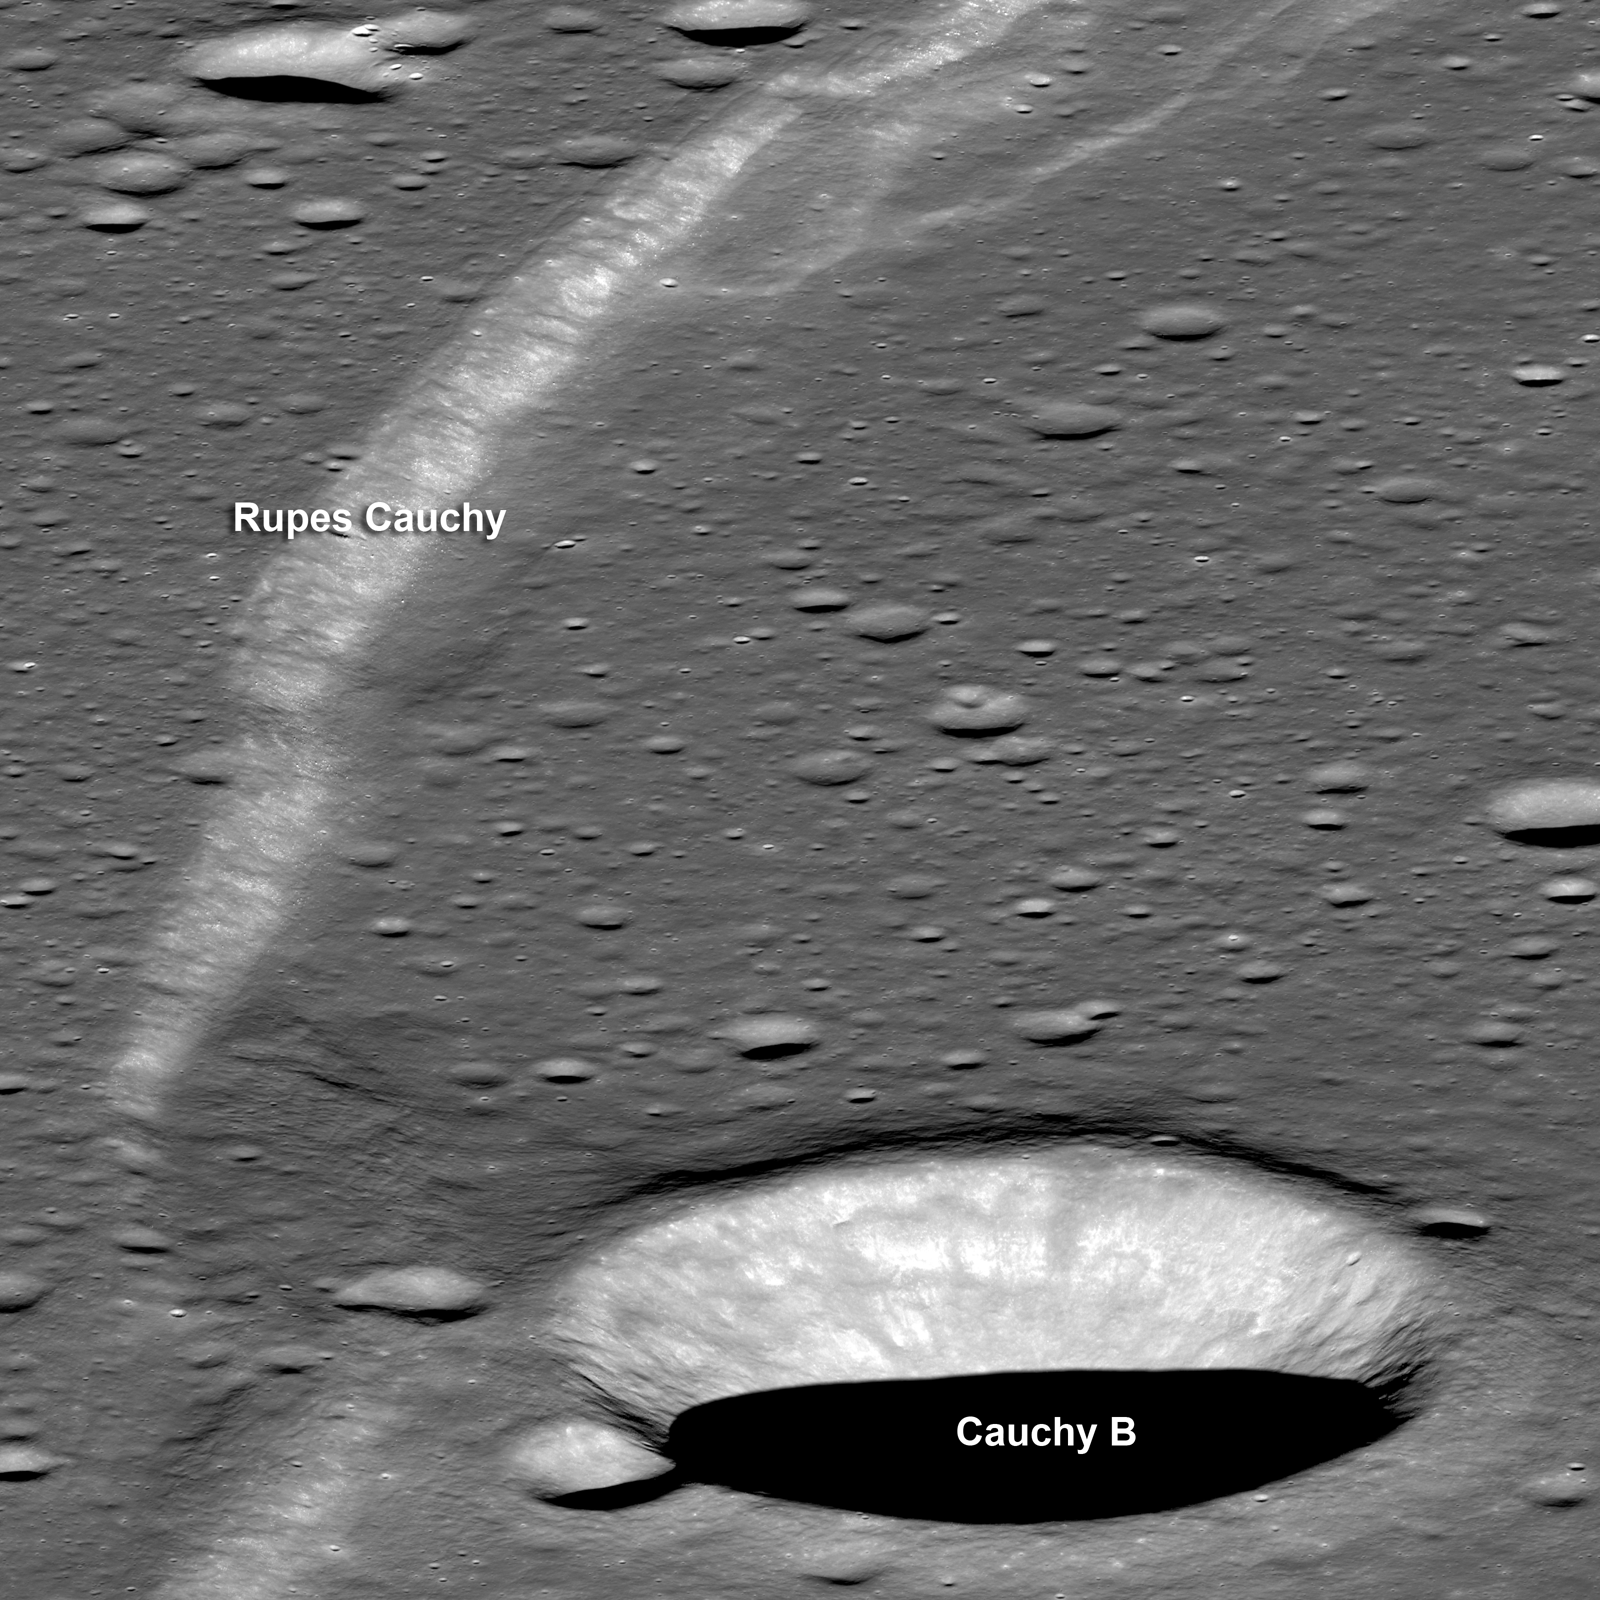
| Above and below, LROC Narrow Angle Camera oblique observations M196308138 L & R, looking east over a small part of the long Rupes Cauchy scarp, slicing through 200 km of Mare Tranquillitatis. The scarp is 300 meters high. Cauchy B crater (6 km) becomes visible in the context of the wider field in the next image. [NASA/GSFC/Arizona State University]. |
 |
| From LROC Narrow Angle Camera (NAC) observations M196308138L & R, LRO orbit 13931, July 7, 2012, native resolution approximately 5 meters. The yellow rectangle matches the field shown in the first image. View a much larger (1600 x 1600 px) version of this image HERE [NASA/GSFC/Arizona State University]. |

LROC News System
There are many tectonic features on the Moon, although most are wrinkle ridges (thrust faults). Normal faults, where one block drops down against another, are relatively rare on the Moon (but are common on the Earth).
However, there are a couple of spectacular examples of giant normal fault scarps cutting across the mare; Rupes Cauchy is one, Rupes Recta is another.
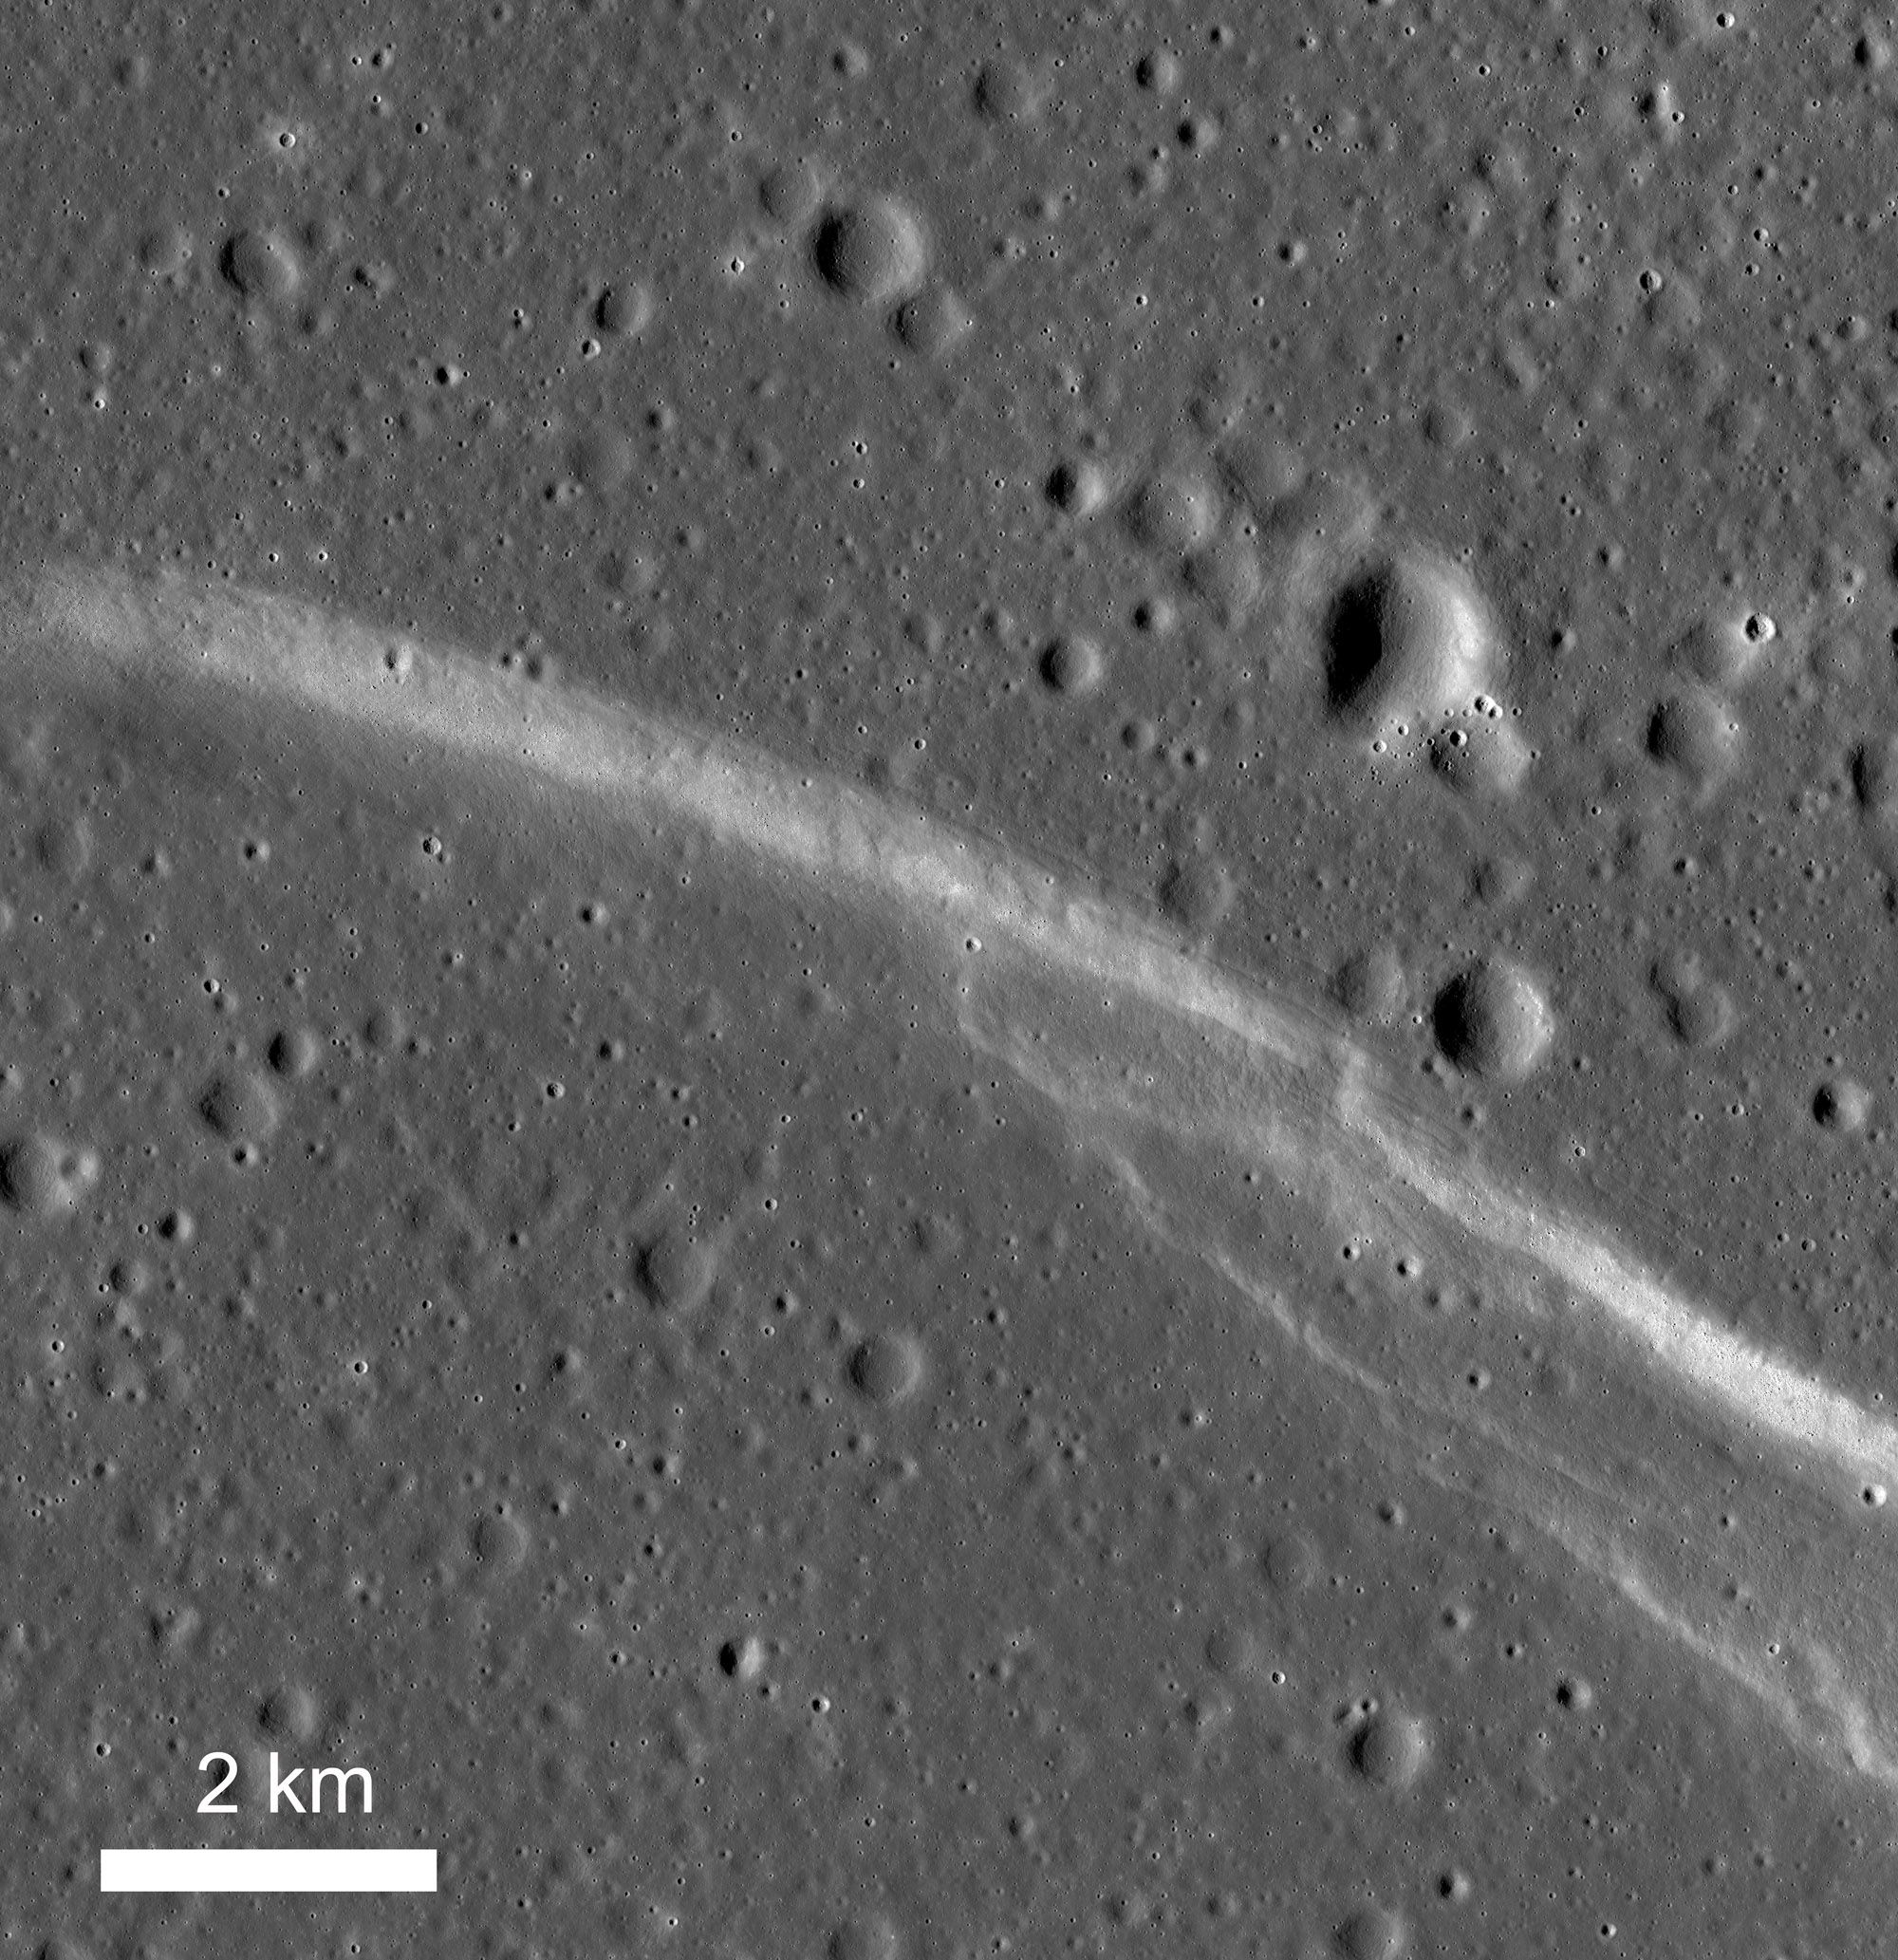
Boulders scattered along the slope (Figure 1) are eroding ancient mare lava rocks that form the local bedrock.
 |
| Figure 1. Vertical view of a small section of Rupes Cauchy (broad brighter band from upper left to lower right), note the boulders and generally worn down craters. The scarp metes out a 300 meter change in elevation; the field of view is 1500 x 1500 meters. LROC NAC observation M180930426L, orbit 11780, June 22, 2012. The inset shows a 3D representation of the topography derived from Wide Angle Camera interferometry. Explore the full 1.19 meter resolution observation HERE [NASA/GSFC/Arizona State University]. |
 |
| Figure 2. Wider range field of view from LROC NAC mosaic M180930426LR (showing the area within figure 1 in the 1.5 meter wide square outline) features the varying morphology of Rupes Cauchy along its long length. View the much enlarged original context image, HERE ( NAC M180930429LR )[NASA/GSFC/Arizona State University]. |
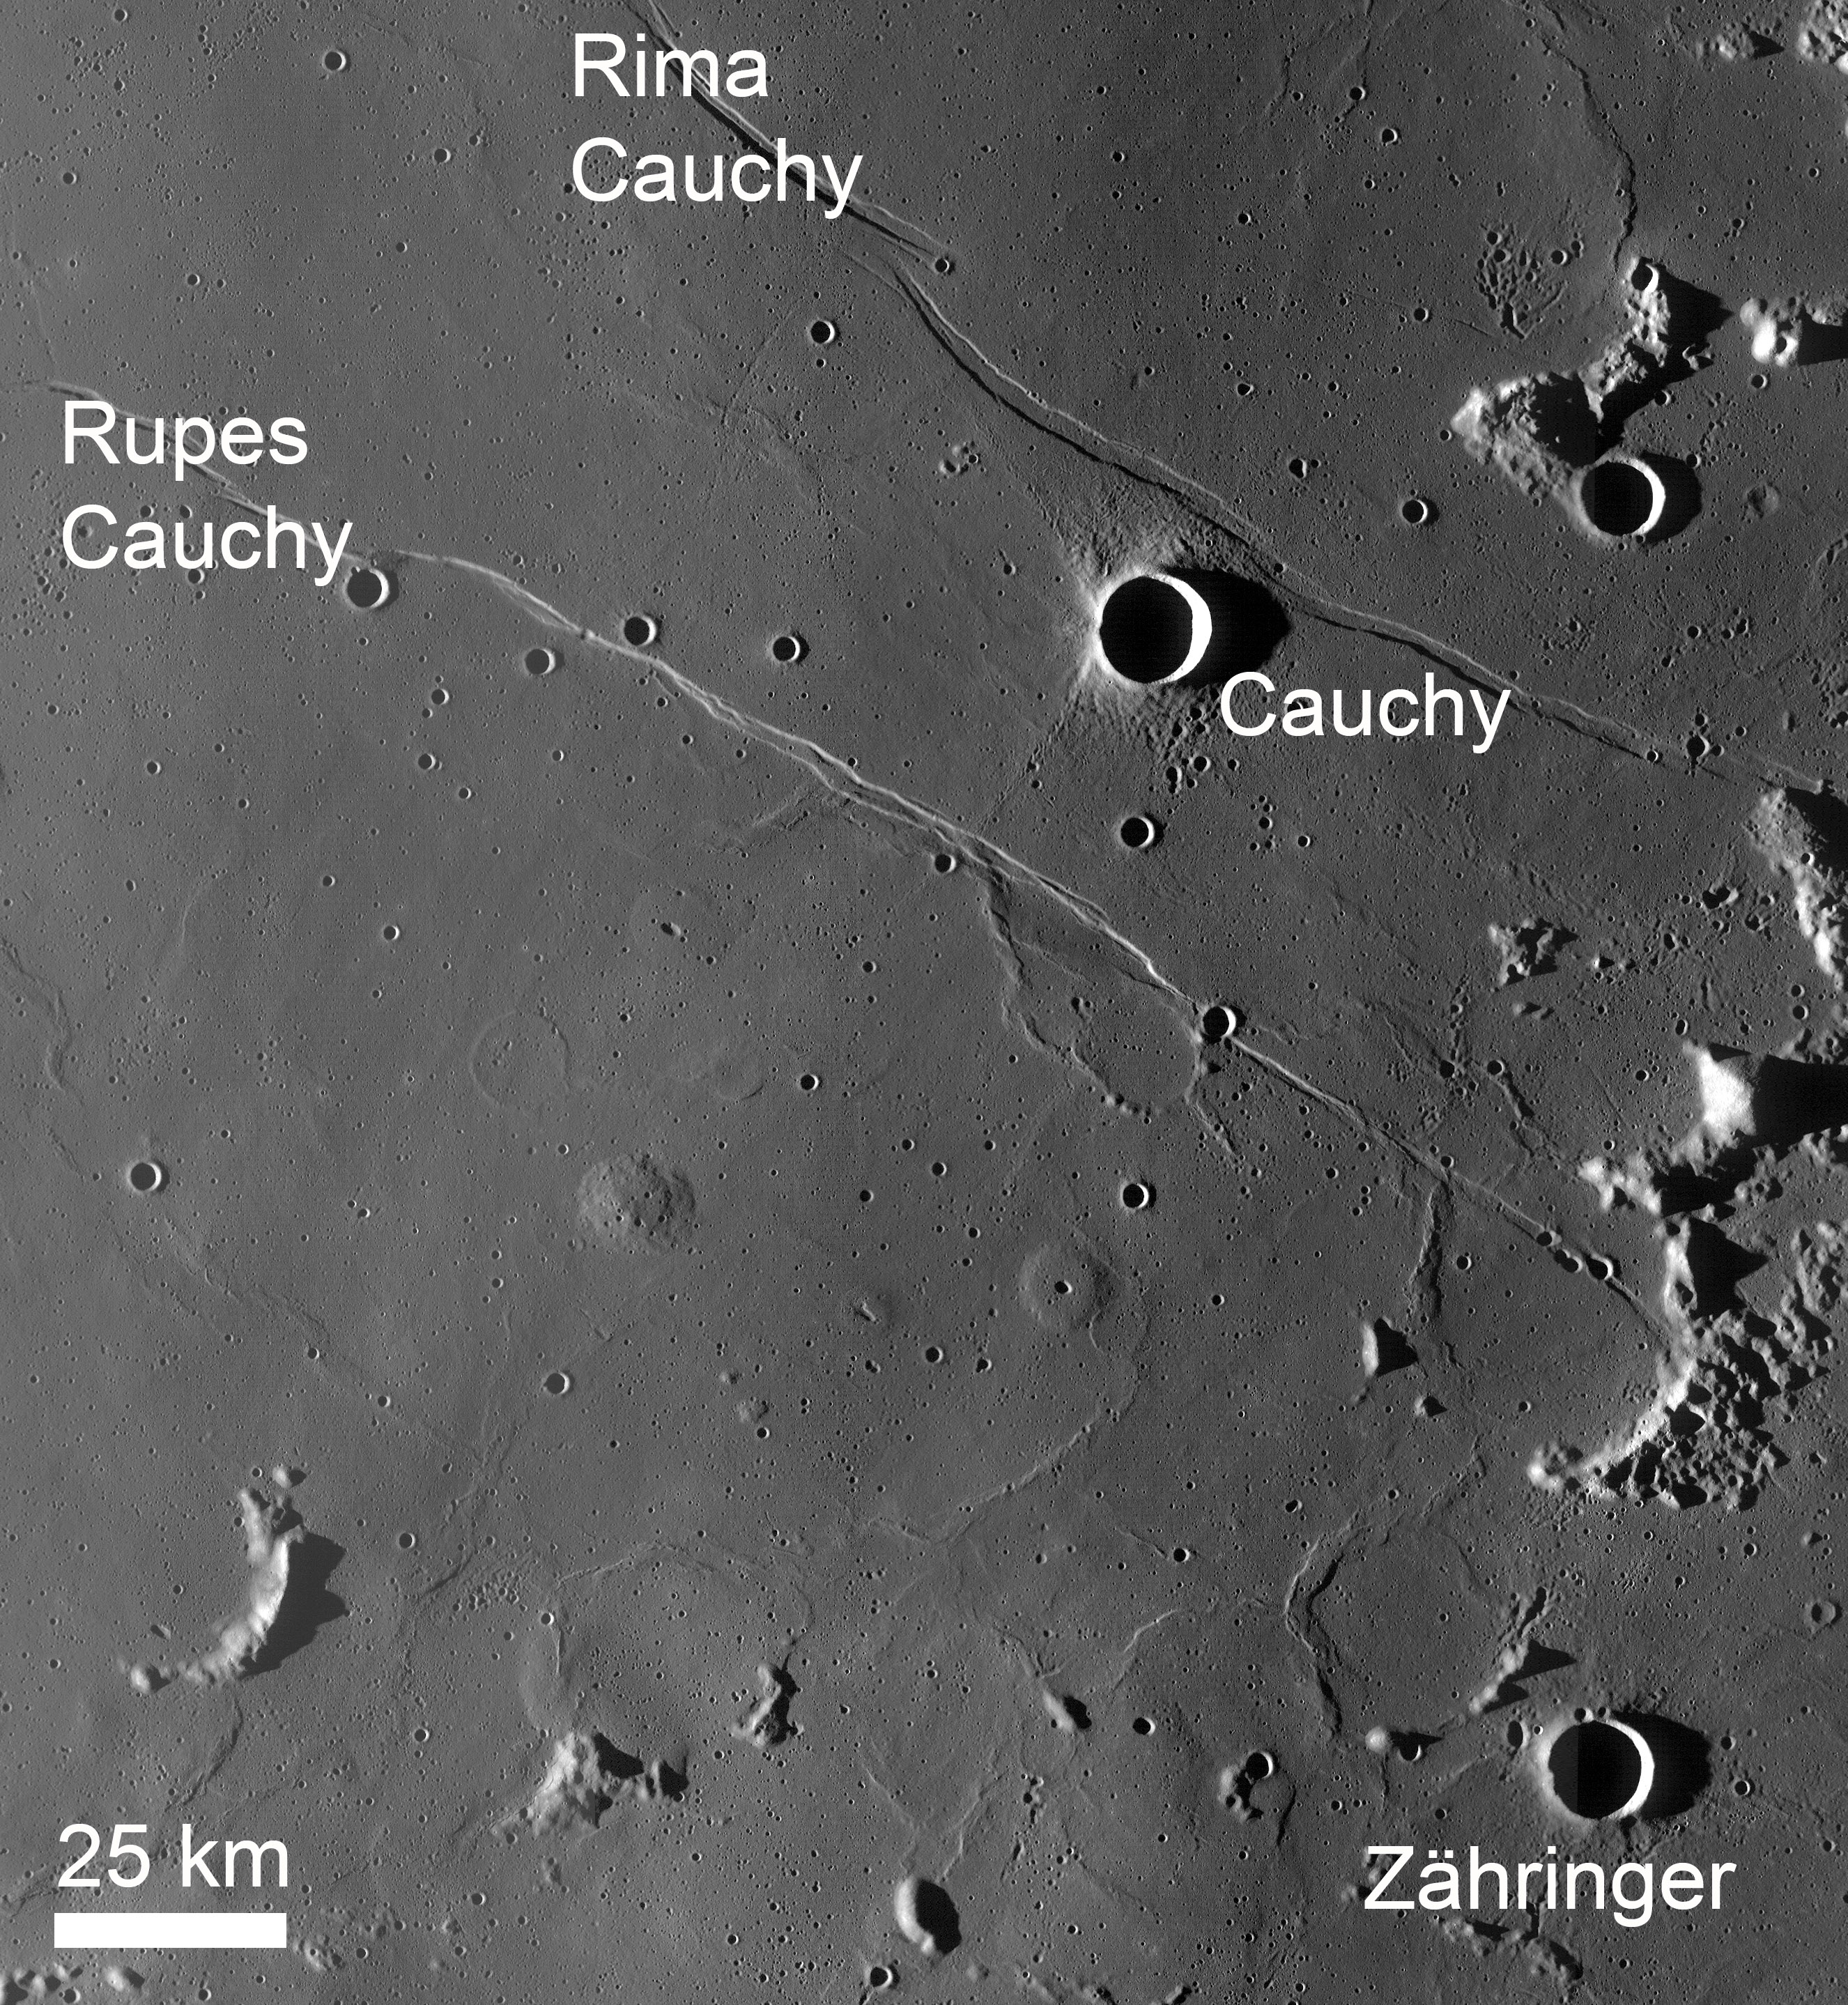
A second tectonic feature parallels the Rupes, about 40-50 km to the northeast. This feature, Rima Cauchy, is an en echelon graben (i.e., a graben system that is formed by individual segments that are offset from one another). Both Rupes Cauchy and Rima Cauchy are the result of tensional / extensional stresses. In the case of Rupes Cauchy, a single giant fault formed; in the case of Rima Cauchy, two faults (facing each other) formed and dropped a narrow block between them.
 |
| Figure 3. LROC Wide Angle Camera monochrome (689nm) mosaic the Cauchy region within Mare Tranquillitatis stitched together from seven sequential opportunities January 4, 2010. View the much larger and more detailed WAC mosaic originally accompanying the LROC Featured Image release, July 24, 2012, HERE [NASA/GSFC/Arizona State University]. |
 |
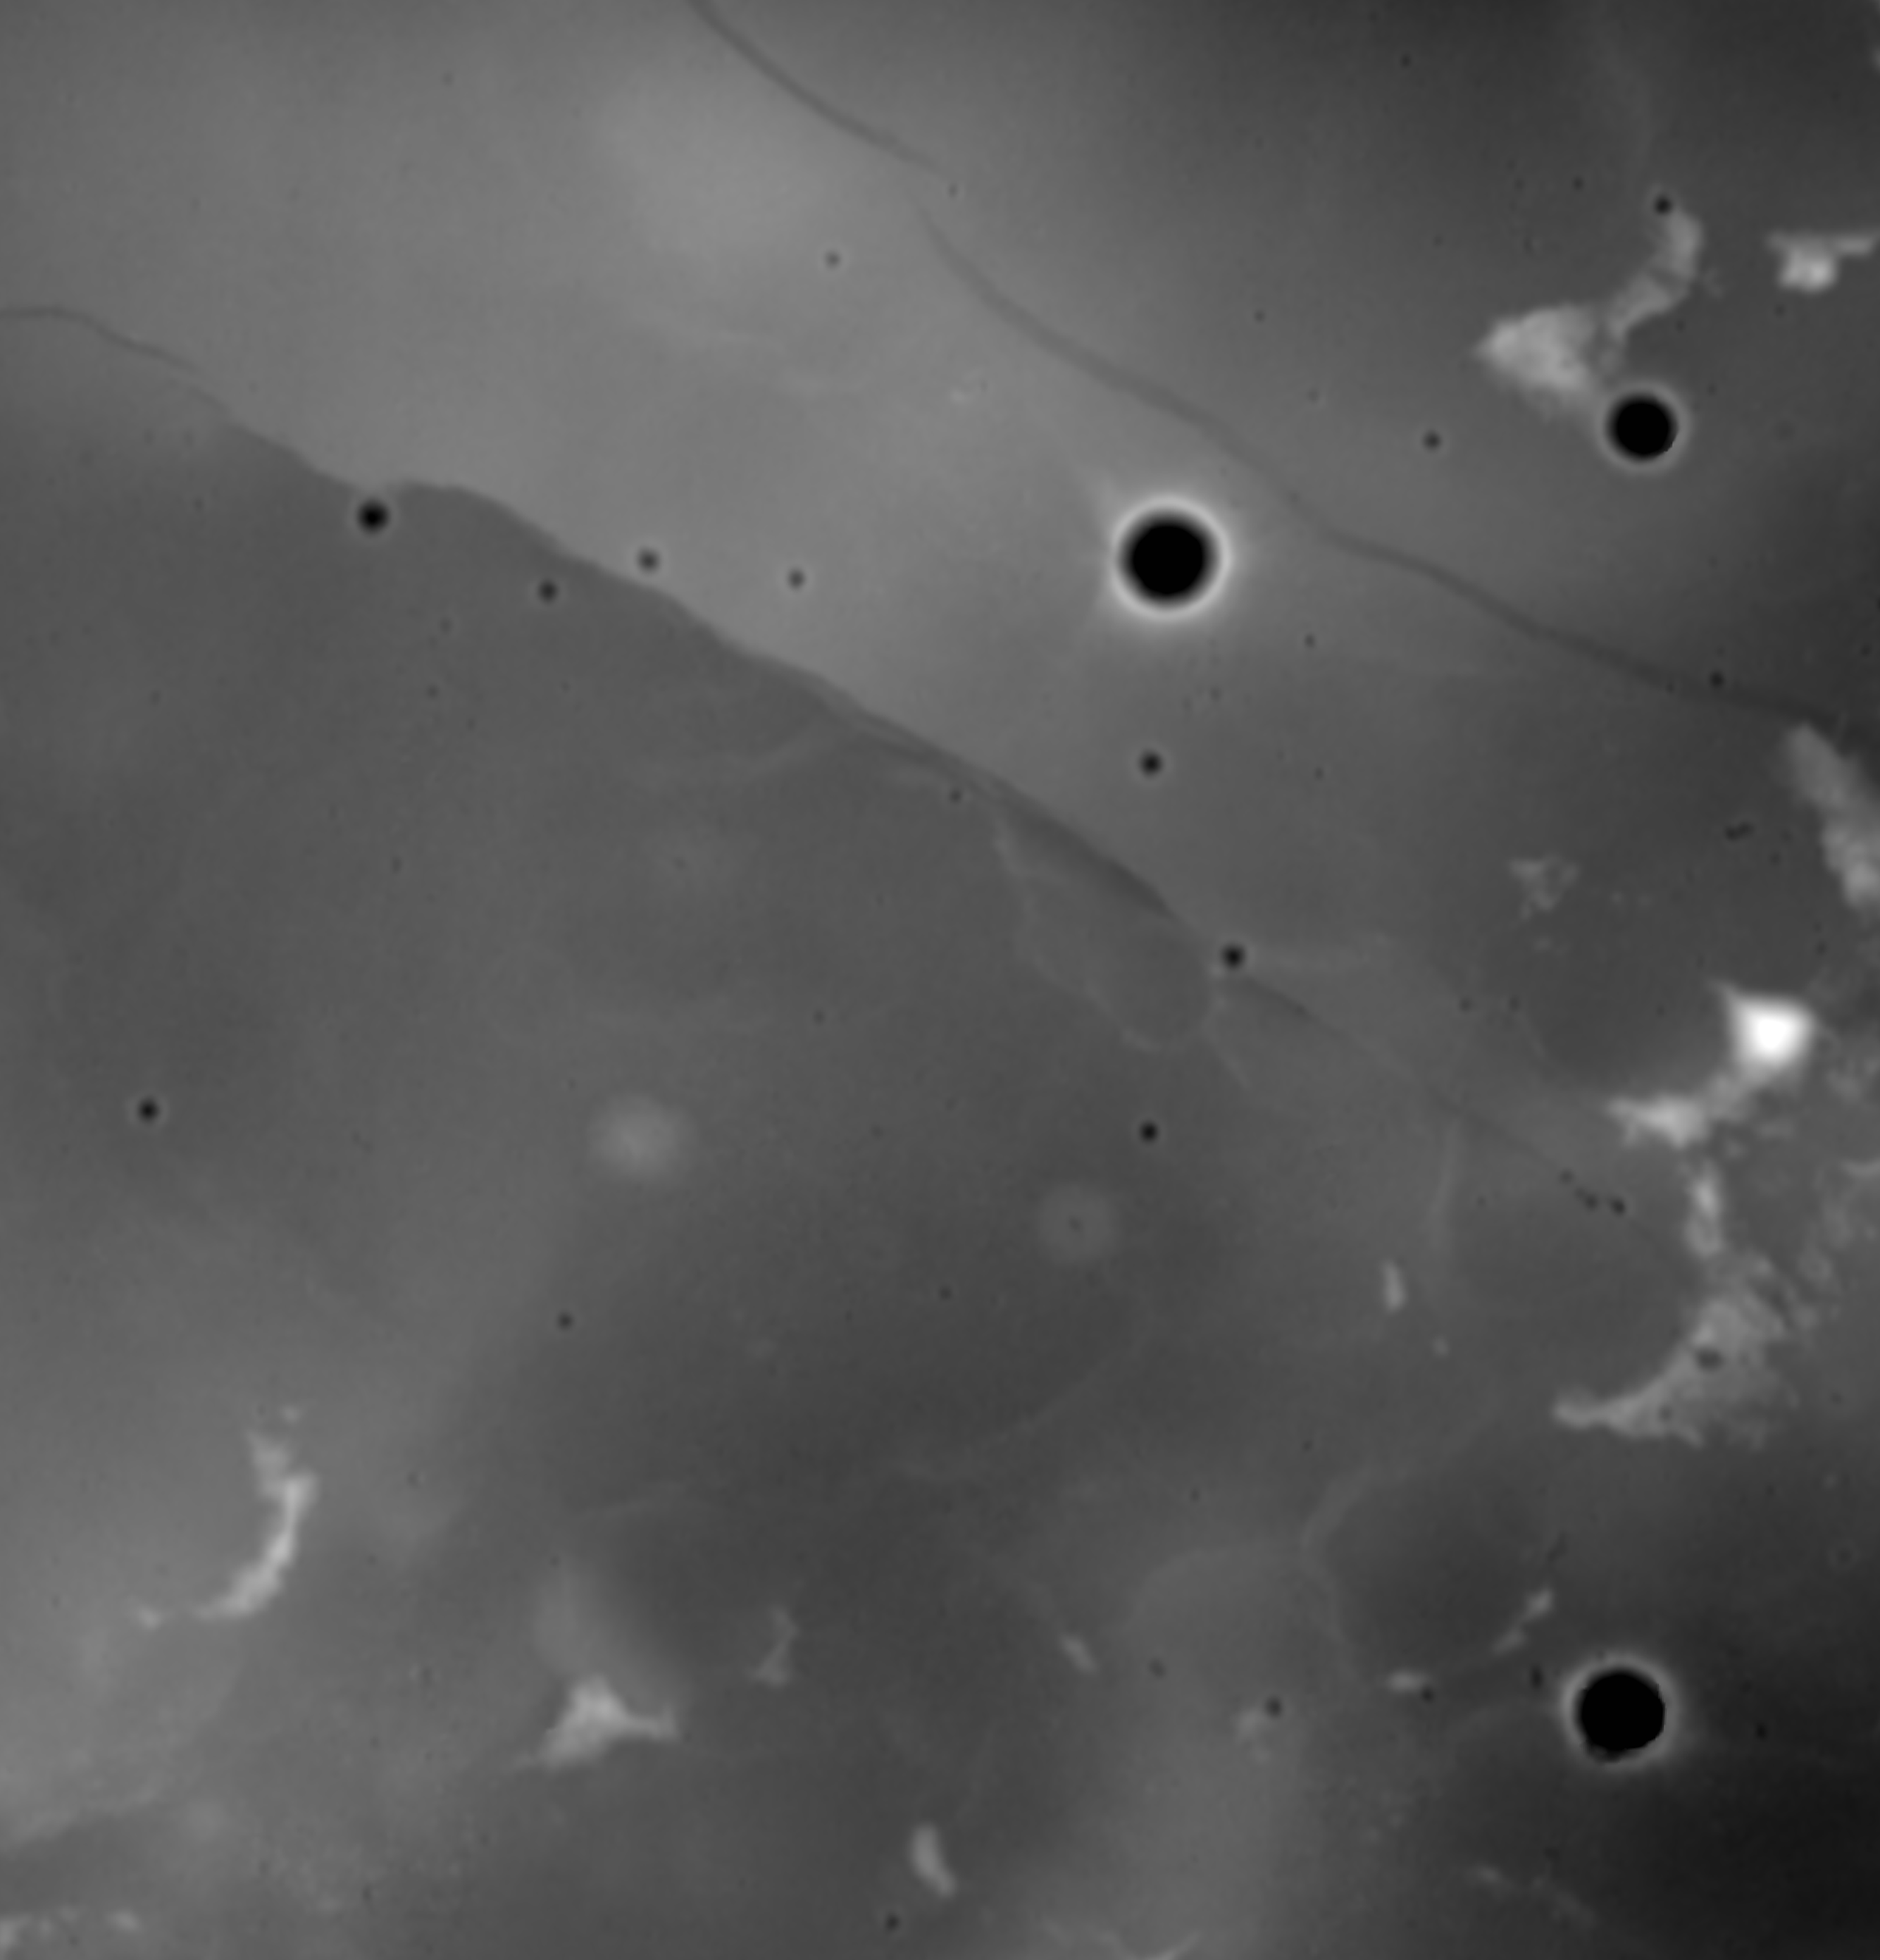
| Figure 4. DEM of the Rupes Cauchy produced from LRO WAC stereo images. Shades of grey represent elevation: dark regions are low and bright regions are high. View the much larger original demonstration, HERE [NASA/GSFC/Arizona State University]. |
Inspect the LROC NAC oblique view of Rupes Cauchy HERE, and the vertical view NAC HERE.
Related Posts:
Rupes Recta
Linear Graben (Apollo Metric)
No comments:
Post a Comment