Showing posts with label Raffaello Lena. Show all posts

Monday, March 16, 2015

Mare Nubium impact with plume captured and analyzed


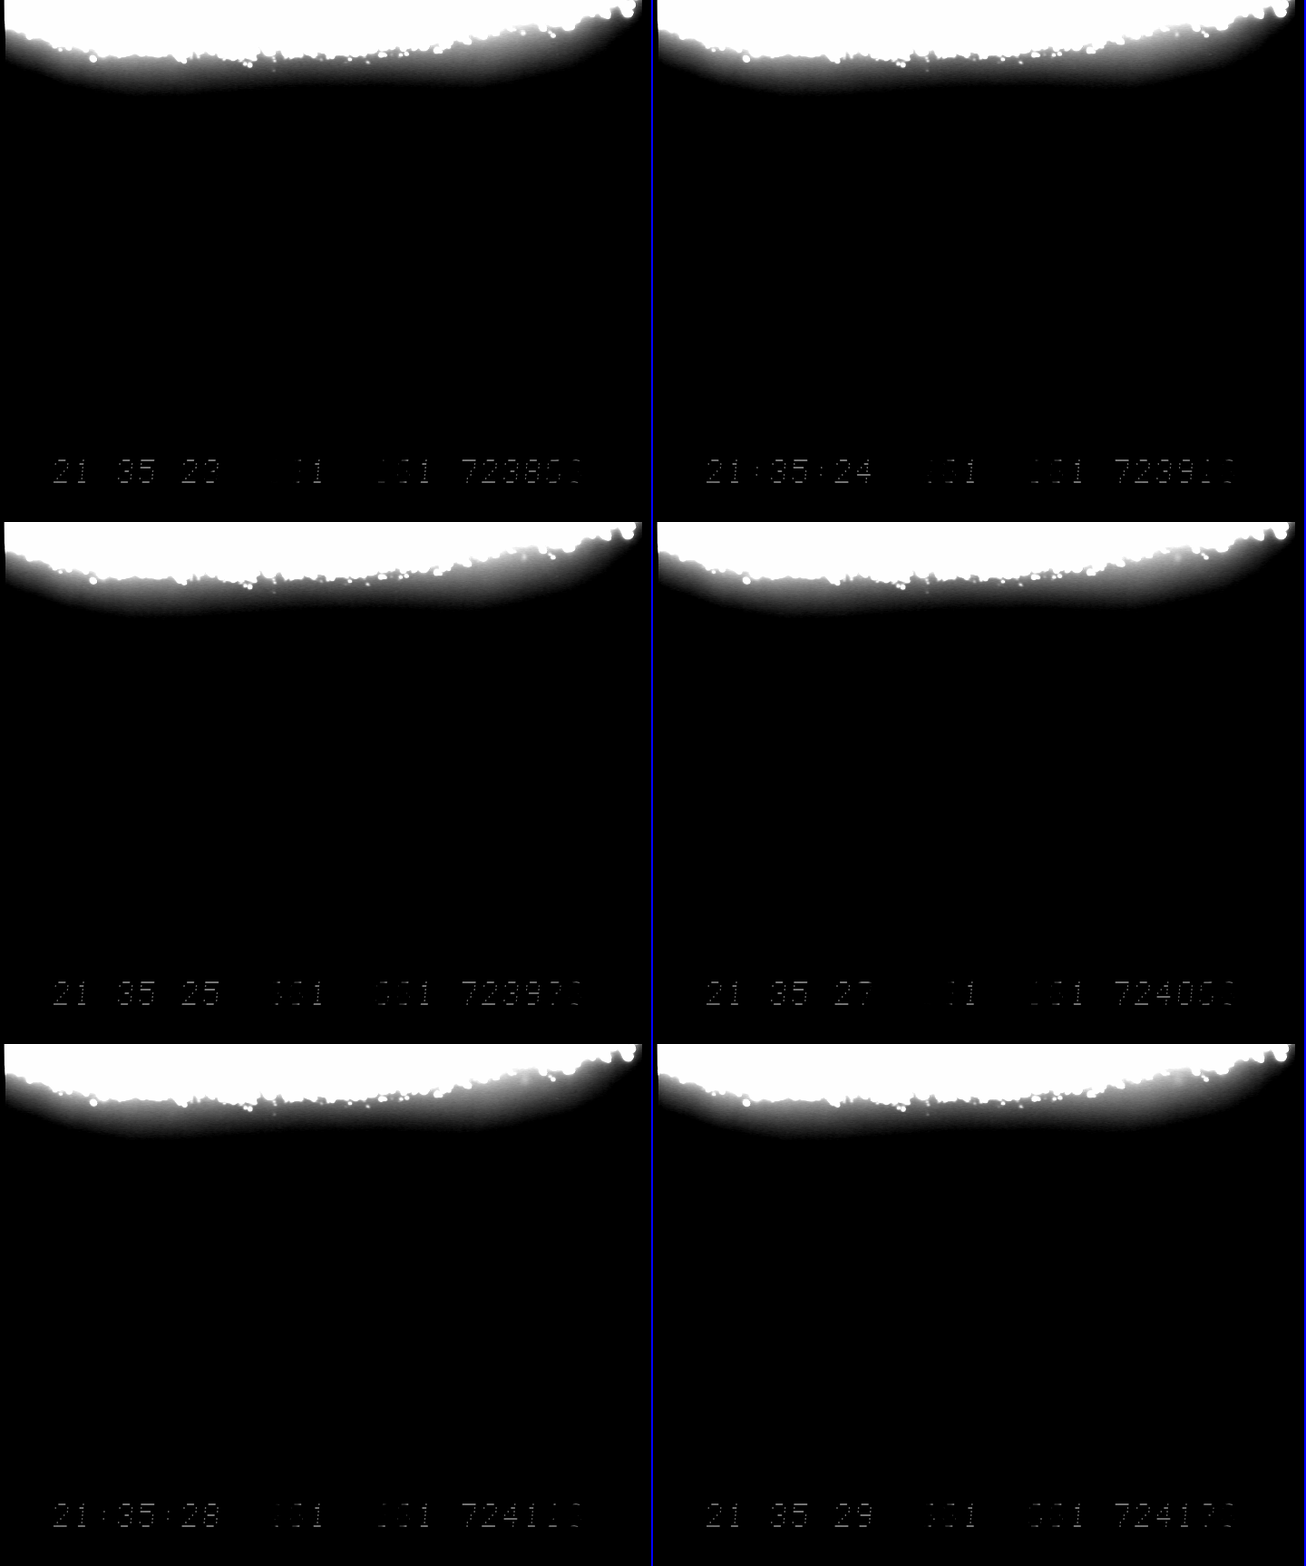
North is to the left, west below in this animation showing what is almost certainly an impact and its plume (right) on the lunar surface in Mare Nubium, on the morning side of the terminator, February 26 [Marco Iten/GLR Group].
Marco Iten
Raffaello Lena
Stefano Sposetti
Geological Lunar Research Group

Report from Selenology Today Preliminary Report 2015:

Abstract: We report the detection of an interesting luminous event most probably generated by a meteoroidal impact on the lunar surface occurred at 21h 35m 22.871s ± 0.010s UT, the 26 February 2015. The position of the flash was along the terminator at selenographic coordinates 7.9° ± 0.6° W; 26.1° ± 1.6° S. The brightness of the flash 0.16 s after the initial detection was +8.0 magV. After the main lightdrop a successive residual diffuse light lasted for several seconds.

Under the assumption of a meteoroidal impact we argue that this post luminous event and its ever growing dimensions was likely caused by the sunlight reflection on ejected materials released by the impact. Thus, future high resolution orbital data, e.g., from LRO spacecraft (NAC images) could allow the detection of this crater. Because this event was captured only by one observer, we checked for satellite glints and evaluated the likelihood of a meteor hitting head on our atmosphere.


1. Instruments observing methods, location The detection was made by Marco Iten from Gordola, Switzerland. He used a 125 mm refractor with a focal length of 800 mm. He also used an 8bit Watec 902H2 Ultimate videocamera working in CCIR mode with these settings: Gamma = OFF; BLC = OFF; AGC = LO. A GPS time inserter (KIWIOSD) printed the Universal Time with millisecond precision in the video frames. The software Virtualdub was used to record the AVI file in a hard disk, with Huffyuv video compressor.

Iten's observatory is located at:
Lat: 46d 10m 44s North
Long: 08h 52m 29s East
Alt: 215 m

Stefano Sposetti was simultaneously filming the Moon from its observatory, but the lunar region where the flash occurred was outside its field of view.

Detection: The initial flash occurred at 21:35:22.871 ± 0.010UT, 26 February 2015 (Fig. 1.). Marco Iten discovered it visually using no dedicated searching software.

Here some informations about the Moon at the detection instant, accordingly to sky simulator software TheSkySix ®.

Equatorial 2000:
RA: 05h 23m 27s
Dec: +17°44'32"

Horizon:
Azim: 250°41'00"
Alt: +41°21'54"

Phase (%): 62.19
Air mass: 1.51
Moon angular diameter: 0°30'33"
Moon distance (km): 3.910 E+05

Artificial satellites: We checked for artificial satellites in the field of view using the website http://www.calsky.com.

The satellite Molniya 340 (21196 1991022A) was at an angular distance of 32 arcmin from the Moon center at the time of the detection. We exclude that this satellite caused the detected flash in Iten's avi.

Luminosity evolution

From the very beginning of the event to +0.14 s (the first seven 20 msfieldintegrationtime) the intensity of all, or at least some, of the pixels is saturated. 

The luminosity of the flash at +0.16 s (in the eight field) is +8.0 ± 1.0 magV (Fig. 2). The intensity decreases again for about a half second. From that instant on, we notice an increase in the intensity of light and also an increase of the diameter of the source. The temporal evolution of the luminosity is showed in figure 3 and was made with the software Limovie©. 

For the photometry we used the star GSC 13002062 = TYC 130020621 with these characteristics:

B 10.97 ; V 9.54 ; R 8.88. The star was visible at 20:25:20 UT.

Information about that star were extracted from website http://cdsweb.ustrasbg.fr/

The peak brightness of the flash was between +5 and +6 magV, but this is a very rough estimation because of the saturated pixels at that instant. The solar elevation on the impact point was determined to 0.9°, computed using the LTVT software package by Mosher and Bondo (©2006) for the date February 26 2015 at 21h 35m 22.871s. Thus, the flash occurred in the dark side near the terminator.

Spatial increase of the light source

The angular sampling of the individual images composing the video file is 2.4 arcsec/pixel. We noticed a non circular increase of the light source, therefore we calculated its augmentation with respect to x and y components (Fig. 4). The apparent radius of the Moon is almost parallel to the x axis.

At the location of the event, the absolute sampling of the image (normal to the moon radius, ie. of the y axis), is 4.5 km/pixel (on the lunar surface). The absolute sampling of the image in the x direction has to be multiplied by a factor 1.24 (= 1/sin 54°) i.e. to 5.6 km/pixel.

At time +6.62 s the x and y diameter of the external border of the “lightcloud” are about 10 pixels and 12 pixels, respectively. This translates to an effective length on the lunar surface of 54 km and 56 km.

If we assume that the increase of the light source is due to the ejected materials elevated from the bottom and if this cloud has a circular shape relative to a tangent plane to the surface, then the mean speed of the augmenting radius is about 4 km/s.

The increase of the lightsource is showed in figure 5 and in some animations we posted at


A visual inspection of the “lightcloud” in the video animation confirms that the expansion lasted until +10s. This translates to a circular effective diameter of about 80 km.

Selenographic Lunar coordinates

The coordinates of the detected flash are determined to:

Long: 7.9° ± 0.6° West
Lat: 26.1° ± 1.6° South

in Mare Nubium, near the crater Lippershey P, located to the south of Birt crater.

The analyzed image displays lunar features that were of very low contrast on the dark limb of the imaged lunar surface. Thus, after alignment with the edge of the lunar disk, computation of the libration, and overlay of the rotated Moon's surface matching the image generated by a simulated image obtained with the LOLA DEM, a coordinate map was superimposed. This procedure was performed using the LTVT software package by Mosher and Bondo (2006). Generating an elevation map of a part of the lunar surface requires its three dimensional (3D) reconstruction. Recently, a global lunar digital elevation map (DEM) obtained with the Lunar Orbiter Laser Altimeter (LOLA) instrument on the Lunar Reconnaissance Orbiter (LRO) spacecraft has been released. It has a lateral resolution of 1/64 degrees or about 500 m in the equatorial regions of the Moon http://pdsgeosciences.wustl.edu/missions/lro/lola.htm

Hence, the rendered image obtained using LTVT and the LOLA DEM, assuming the same illumination conditions and librations of the observing session, was saturated allowing a close comparison with the appearance of the saturated terminator as seen in Fig. 2, and further refined considering the uncertainty comparing the map with the WAC imagery of the Lunar Reconnaissance Orbiter.

Active Meteor Showers

Figure 6 shows the active meteor showers accordingly to the predictions of the software Lunarscan©. Because of the small activity of the showers at that date, we think of a sporadic nature of the meteor shower. 

Evaluating the possibility of an headon meteor strike

We report this luminous event as an “unconfirmed lunar flash” being considered an impact candidate. In fact, considering that the event was only recorded by one video camera the possibility of a meteor "headon" producing the recorded light cannot be ruled out. Therefore we tried to evaluate the post spread of light as being emitted by the ionization of the high altitude gases of our atmosphere. Sometimes luminous meteors leave luminous trails and in this chapter we try to discard this possibility. We got the direction of the winds and their speed using the website

http://weather.uwyo.edu/upperair/europe.html published by the University of Wyoming©. Here we could download data from balloons sent from Milan (LIML) and from Payerne (LSMP), the 2 nearest stations from Iten's observatory at 12h intervals (00h and 12h). The balloons reach about 30 km of height. At that altitude and also some kilometers higher, the direction of the winds during the time interval between Feb 26.5 and Feb 27.0 is around 270 deg and their speed from 30 to 40 knots (LIML data) and from 30 to 99 knots (LSMP data). Projecting the wind speed along the normal direction of the line of sight, one gets, with a conservative wind speed of 18 m/s in the interval of 6.6 s, a drift of about 350 arcsec. This is about 12 times more than the drift in East direction of the “lightcloud” in the same interval. The western direction of the winds cannot explain the drift of the “lightcloud” in almost a circular shape. Hence we confidentially exclude that the drift of the “lightcloud” was caused by winds at 30 km height.

Size of the probable impactor and of the produced crater

In this study, and under the assumption of an impact event, the same formalism and equations as in the works by Bellot Rubio et al. (2000), Ortiz et al. (2000), Ortiz et al. (2002), and Carbognani (2000) was followed, including the kinetic energy that is translated into impactor mass assuming a typical sporadic impactor speed. According to the statistics of a large meteoroid orbit database (Steel, 1996) this speed is approximately 20.2 km s1 on Earth and 16.9 km s1 on the Moon, after correcting for the different escape velocities of the Earth and the Moon.

Moreover a short routine provided by Melosh and Beyer (1999) was used to evaluate the scaling equations to determine the diameter of a crater given details on the nature of the projectile, conditions of impact, and state of the target. The transient crater diameter is evaluated by three independent methods, yield scaling, piscaling and Gault's semiempirical relations supplemented by rules on how crater size depends on gravity and angle of impact.

The parameters used in the calculation are the projectile density, the target density (2700 kg m3), the impact velocity (16.9 km s1), the peak brightness (5.5 MagV) and the duration of 0.22 seconds. Using the luminous efficiency η = 2 x 10³ (the nominal value determined from Leonid impact flashes, e.g., Bellot Rubio et al., 2000; Ortiz et al., 2002), the mass of the impactor would be 1.1 kg. Based on the above data and assuming a spherical projectile, the diameter of the impactor was inferred to be approximately between 9 and about 20 cm considering a bulk density ranging between 0.3 g cm3 (soft cometary material) to 3.7 g cm3 (corresponding to ordinary chondrites). This impactor would strike the target with an impact energy of 1.7 x 10⁸ Joules (4.0 x 10⁸ MegaTons). If the meteoroid is associated as a sporadic source, the impact angle is unknown. We have used the most likely angle of 45° to estimate the size of the crater produced by the impact.

Using the Piscaled law for transient craters, the final crater would be a simple crater with a rim to rim diameter of about 1520 m. 

However, considering that the brightness of the detected flash was saturated and the described presence of a luminous post event, the values inferred for the mass of the probable impactor and the crater size originated by the impact could be considerably higher.

Future high resolution orbital data, e.g., from LRO spacecraft (NAC images) could allow the detection of this crater. Hence, it will be interesting to compare LRO high resolution images (NAC images with their resolution of ~1 m on the ground) taken before and after the event. Future studies will be performed to complete our analysis, including the search of the crater, and thus to estimate mass of impact produced dust cloud and the size of exospheric dust particles and to perform hydrodynamic modeling of this event.

Acknowledgements:

Data about winds are obtained in collaboration with Meteoswiss

We thank the Wyoming University for the source winds data set

References:

[1] Sposetti, S., Iten, M., Lena, R. 2011. Detection of a meteoroidal impact on the Moon. Selenology Today 23,132.

[2] Lena, R., Iten, M., Sposetti, S., 2011. Detection of three meteoroidal impact on the Moon. Selenology Today 24,1229.

[3] Lena, R., Iten, M., Sposetti, S., 2011. Detection of two probable meteoroidal impacts on the Moon. Selenology Today 25,6065.

[4] Iten, M.,Lena, R., Sposetti, S., 2013. Five probably meteoroids impact on the Moon. Selenology Today 31,1015.

[5] Lena, R., Manna, A., Sposetti, S., 2013. Detection of a probable small meteoroidal impact on the Moon. Selenology Today 33,49.

[6] Bellot Rubio, L.R., Ortiz, J.L., Sada, P.V., 2000. Observation and interpretation of meteoroid impact flashes on the Moon. Earth Moon Planets 82–83, 575–598.

[7] Carbognani, A.2000. Impatti sulla Luna

[8] Steel, D., 1996. Meteoroid orbits. Space Sci. Rev. 78, 507–553.

[9] Ortiz, J.L., Sada, P.V., Bellot Rubio, L.R. et al. (2000) Optical detection of meteoroidal impacts on the moon. Nature 405. 921923.

[10] Ortiz, J.L., Quesada, J.A., Aceituno, J., Aceituno, F.J., Bellot Rubio, L.R. 2002. Observation and interpretation of Leonid impact flashes on the Moon in 2001. Astrophys. J. 576. 567–573.

[11] Melosh, H.J., and Beyer, R. A. 1999. Computing Crater Size from Projectile Diameter.

[12] Mosher, J., & Bondo, H., 2006. Lunar Terminator Visualization Tool (LTVT). 

Tuesday, August 13, 2013

An unexpected transit

Rafaello Lena, of the GLR Group in Rome passes along this serendipitous interruption of his efforts to record Earth atmosphere-grazing Perseid meteors and perhaps another lunar impact, captured at 1945 UT, Monday, August 12 . An aircraft, and easily "identified flying object," transits the evening Moon. Still 40 hours shy of its Quarter phase, the Moon was 377,200 km away as the terminator swung over central Mare Serenitatis and the Southern Highlands, sunrise over the 1972 landing site of Apollo 16.

Friday, August 9, 2013

Small impact on the Moon observed from three locations

lena-manna-sposetti-20130801-580x1200
Simultaneous observation of the impact of a "small meteoroid" on the Moon, north of Mare Crisium, 0221:55.7 GMT, 1 August 2013, captured at the same moment by three observers using three telescopes in Switzerland, 10 km apart, and a fourth telescope in Rome 558 km away.  Observations by Raffaello Lena (GLR Group, Rome), using a 130 mm refracting telescope equipped with a Mintron video camera,  Andrea Manna (Cugnasco, Switzerland), with a 200 mm Schmidt Cassegrain equipped with a Watec 120N+ - and by Stefano Sposetti  (Gnosca, Switzerland) using two telescopes, a 150 mm refractor and an 11" Schmidt Cassegrain, each equipped with Watec 902H2  cameras.
Raffaello Lena, of the GLR Group in Rome, has documented the simultaneous observation of the exceedingly transitory flash of an impact on the Moon by three observers, using four telescopes equipped with CCD cameras, from three separate locations.

"On  August 1, 2013 at 02:21:55.7 UT, we observed a small meteoroid impact on the Moon's surface. The kinetic energy transformed into heat caused a brief and intense flash detected simultaniously in telescopes operated by R. Lena, A. Manna and S. Sposetti.

"The simultaneity of the flash observations, at the same position on the lunar surface strongly indicate the flash is unlikely to be mistaken for anything other than an impact."

The event was recorded by Raffaello Lena in Rome Italy, Andrea Manna in Cugnasco, Switzerland, and by Stefano Sposetti in Gnosca, Switzerland. The two observatories in Switzerland were separated by 10 km while Lena in Rome was 558 km from Gnosca.

The meteoroidal lunar impact detected on August, 1, 2013 at 02:21:55.7 UT was simultaneously recorded by  four independent video recordings. The duration of the flash corresponds with 0.08 seconds peaked in a brightness of 8.3 ± 0.7 magnitude. Synchronicity of the documenting images and related files was verified using GPS time inserters (KIWI-OSD) and an Atomic Clock Synchronization protocol.

The coordinates of the flash were determined to 73° (± 4°) East, 27° (± 3°) North, near the crater Seneca C.

"The flash probably corresponds to an α-Capricornids meteor stream, exhibiting favorable geometry at time of impact."

A report of the coordinated observing session is published in Selenology Today, HERE, and an Adobe pdf file with the particular of the event and observing session can be also downloaded HERE.

In addition, Lena reports, "some animations and data, are also presented on my website: http://lunarimpact2.blogspot.it/ ."

Small impact near Seneca C, 1 August 2013
The phase of the Moon at the time the impact was observed at three locations on Earth, 0221.55 UT, August 1, still a considerably bright 29.7 percent illumination from a Moon, 23.63 Earth-days old in the early predawn. At time of impact, still late July 31 in North America, the Moon was 405,528 km distant [Virtual Moon Atlas v.6].
Related Posts:
Earth's Nightlight (June 26, 2013)
March of Time Paces Changes on the Lunar Surface (May 21, 2013)
Brightest impact recorded by NASA lunar monitoring program, March 17 (May 17, 2013)
LROC team identifies a new lunar crater (July 28, 2010)
Lunar meteor impact observations and the flux of kilogram-sized meteoroids (July 25, 2010)
The Lunar Geminids (December 10, 2009)
Impact Gap in the Moon's Southern Highlands? (May 22, 2008)

Thursday, August 8, 2013

Another look at the effusive dome west of Rima Yangel

M1111791664RL-NSJ-0502-9626x18010
Effusive dome on the southern rim of a  ghost crater situated on the northern shore of Mare Vaporum, in a 11.48 km-wide field of view west of Rima Yangel. LROC NAC mosaic M1111791664LR, LRO orbit 16100, January 2, 2013; 71.03° angle of incidence, 1.19 meters per pixel resolution from 118.91 km [NASA/GSFC/Arizona State University].
Follow-up LROC Narrow Angle Camera (NAC) observation swept up by the orbiter in January and released to the Planetary Data System (PDS) in June. This effusive dome on the north bank of Mare Vaporum was the subject of two extensive posts in February and March.


The mosaic above can be viewed at full and at a variety of medium resolutions, HERE. The dome has bow been imaged from LRO from high and low altitudes, under a range of illumination angles, and many of those observations are referenced in the posts from earlier in the year, linked above.

Tuesday, March 26, 2013

Follow-up research on the effusive dome near Yangel

Under an early afternoon Sun subtle albedo contrasts stand out more than the 600 meters high effusive dome in Mare Vaporum, first discussed HERE, February 19. LROC Narrow Angle Camera (NAC) mosaic M1098830275LR, LRO orbit 14284, August 5, 2012; 1.28 meters resolution from 126.74 km [NASA/GSFC/Arizona State University].
Raffaello Lena and Barry Fitz-Gerald
GLR group

In a previous communication we reported a volcanic structure located some 40 km west-southwest of the crater Yangel in Mare Vaporum (16.44°N, 3.27°E), southeast of Sinus Fidei.

It is characterized by the presence of dark pyroclastic material, also distributed on the inner slope of the ruined crater immediately north of the elevated non-monogenetic volcanic dome, suggesting an ash type deposit.

The morphometric properties we reported (620 meters high, slope 13.4°) indicate the dome presumably formed during several stages of effusion, a process that may build up steep edifices  followed by a subsequent explosive phase of volcanism producing the dark pyroclastic deposit. In this follow-up we include further analysis and spectral data of the unusual volcanic construct.

Our closest available look at the 620 meter high effusive dome on the northern edge of Mare Vaporum, and its apparent dark mantle intrusion, disrupting the rim of an ancient ghost crater; a roughly 1600 by 3800 meter field of view, two contiguous strips from the full range captured in LROC NAC mosaic M168183822LR, orbit 9919, August 17, 2011; incidence angle 42.22° at 40 cm per pixel resolution from 24.42 km [NASA/GSFC/Arizona State University].

The northern flank of the dome partially covers the southern rim of a partially submerged pre-mare, impact crater (approx. 7 kms in diameter), which appears to have undergone subsidence to the east, where the craters wall is only visible as a feint 'ghost ring.' The height of the western rim is approximately 200 m above the mare surface, giving an indication of the vertical displacement affecting the eastern rim. This subsidence could be the consequence of crustal downwarp, but may also be a result of faulting, with the eastern wall being on the downthrow side of a north-south orientated fault. It is worth noting that a continuation of Rima Yangel to the west would intercept the crater rim at the position of the breach, though if this tectonic feature is related to the breach, it does not extend to the craters western rim. Evidence for subsidence or faulting is provided by the overall morphology of the dome and the rather 'off-center' appearance of the upper slopes relative to the apron as seen in Fig.1B with the apron to the west of an apparently greater extent than to the east. It is possible that if this apron was previously symmetrical, tilting would have lowered its level in the east with subsequent obscuration during the emplacement of the mare lavas, as is the case with the eastern crater rim.

Figure 1A and 1B - LROC (Arizona State University) Quickmap and NAC images show the effusive dome on the north edge of Mare Vaporum (A) and detail (B) showing possible vent complex (circled:B) and dark mantling (DM) on the ghost crater's southern wall. B: LROC NAC M181144987LR, LRO orbit 11810, January 14, 2012, scaled down from 1.3 meters per pixel resolution, from 128 km [NASA/GSFC/Arizona State University].
The dome itself appears to be divided into two distinct zones in elevation, the lower slopes comprising a relatively smooth textured debris apron of even albedo, and more rugged the upper slopes which appear to have a lower albedo surface layer overlying a subsurface of a higher albedo.

This may reflect mass wastage of the darker surface layers on steeper slopes to reveal either a fresh, low maturity soil beneath or soils of differing composition. The surface albedo of the northern flank appears lower than elsewhere on the dome, which may indicate the presence dark pyroclastic mantling deposit.

The summit of the dome is occupied by a number of rimless depressions, with the most conspicuous being roughly square in outline (approx. 400 m across) within which is a large smooth rimmed crater (approx. 150m diam). This square feature (Fig.2A) appears to be displaced slightly to the east of the dome summit, possibly as a result of subsidence which is discussed above. The square depression appears to be bounded by a fault scarp, whilst the smooth rimmed central crater within lacks a sharp rim, and may be of volcanic rather than an impact origin. This square depression and central crater may represent some form of vent complex.

The eastern side of the dome shows evidence of slope failure, with an arcuate scar cutting the upper eastern flank, beneath which the slope is modified by radial and sub radial grooves, possibly representing erosion gullies. This asymmetric slope failure affecting the eastern flanks may be related to the subsidence postulated above. This presumes that the dome was emplaced prior to any episodes of subsidence and therefore prone to de-stabilising slope modification occurring as a result.

To the north of the dome and lying on the inner slope of the ruined crater wall is an area covered by a low albedo mantle. These low albedo deposits are patchy, with a darker surface layer overlying a lighter subsurface, again possibly as a result of exposure of fresh, immature material or material of a differing composition.

Figure 2A - Full resolution (40 cm) resolution detail of depression and crater within - LROC NAC M168183822LR [NASA/GSFC/Arizona State University].
Figure 2B - Under high Sun, dark mantle deposits on ruined ghost crater rim and wall with adjacent lighter boulder field. LROC NAC observation M1103545264LR, spacecraft orbit 14944, September 29, 2012, angle of incidence 20.62° at 1.02 meters resolution from 126.06 km [NASA/GSFC/Arizona State University].
This low albedo area is flanked to the west by a zone where the albedo of the inner crater wall is considerably higher. A detailed view reveals that it is composed of multiple, often superimposed boulder trails that appear to have originated from exposures along the upper margins of the inner crater wall (Fig. 2B). These trails form a boulder trail field with the boulders responsible visible in considerable numbers lying on the crater floor. It is possible that the low albedo dark mantled area was previously more extensive, but that a large area of it was disrupted during the formation of the boulder trail field. Evidence for this can be seen in the form of isolated patches of darker materiel within the boulder trail field, which may represent surviving remnants of the original mantling. The upper slopes of the dark mantled areas are largely clear of trails but isolated boulders are visible. In contrast the lower slopes do contain both trails and boulders. This may indicate that the lack of trails on the upper slopes reflect a later phase of localised dark mantling that obscured any trails that were present, but left the boulders responsible still visible. The existence  of these multiple boulder tracks indicate a significant ground disturbance that dislodged large numbers of boulders from the crater wall. This may be related to the subsidence or down-faulting discussed above, or to volcanically induced seismic disturbance during the active phase of the domes growth.

The Clementine UVVIS ratio enhances color differences related to soil mineralogy and maturity. The color ratio image is obtained assigning the R750/R415, R750/R950 and R415/R750 into the red, green, and blue channels of a color image, respectively.

Figure 3 - Inset: Clementine 750nm imagery with pyroclastic deposit. Surrounding context: Clementine false color of the region obtained assigning the R750/R415, R750/R950 and R415/R750 into the red, green and blue channels, respectively. The volcanic construct with pyroclastic deposits is marked with an arrow and renders as blue [NASA/USGS/DOD].
The lunar highlands are depicted in red (old) and blue (younger) and the maria are depicted in yellow/orange (iron-rich, lower titanium) or blue (iron-rich, higher titanium). The pyroclastic deposit is characterized by a different color respect to the nearby soil and appears blue indicating an increased TiO2 content (Fig. 3). The LPD has a lower 750 nm albedo of about 0. 092, while the examined mare unit is similar to that of the undisturbed crater unit with a 750 nm albedo of about 0. 011, but the LPD has a higher R415/R750 ratio, and is spectrally bluer than the other examined units with lower R415/R750 ratios of ~0.60.

For the spectral study the Multiband Imager (MI) on the Selenological and Engineering Explorer (Selene) with both visible and near infrared coverage in the spectral bands at 415, 750, 900, 950, 1000, 1050, 1250, and 1550 nm have been used. The spectral data were normalized using the region of Sinus Aestuum 2 site and calibrated using bidirectional reflectance corrected Keck 120 color spectral data for Sinus Aestuum 2. The color ratio image obtained with Selene-1 MI and assigning the R750/R415, R750/R950 and R415/R750 into the red, green, and blue channels of a color image, confirms the results found with the Clementine imagery but with higher spatial resolution. According to preceding findings the dark material extends beyond the dome itself into the flooded crater to the north, suggesting an ash type deposit and displays a blue color with a compositional contrast between the whole dome and the mare based on the UVVIS ratios imagery (Fig. 4).

Figure 4 - Ratio color image from SELENE-1 (Kaguya) dataset in which the R750/R415, R750/R950 and R415/R750 are assigned to red, green and blue channels, respectively. A slight contrast enhancement was applied to the RGB image [JAXA/SELENE].
We have applied the TiO2 and FeO estimation equations by Lucey et al. (2000)*. The derived values for FeO and TiO2 are then converted to Fe and Ti elemental abundance by multiplication for the factor (56/72) and (48/80) respectively, according to the atomic weights of the constituent elements. According to the Clementine and Selene-1 color ratio images, the Ti map indicates that the pyroclastic deposit has a Ti contents between 5.0 and 6.2 wt% corresponding to a high TiO2 content of 8.4-10.2 wt%. The elemental abundances of the mare units correspond to a lower Titanium content of 2.7-2.9 wt% (4.5 - 4.8 wt % as TiO2). The Fe map, obtained with the method described by Lucey et al. (2000), shows that the LPD has a Fe contents between 13.4 wt% and 14.0 wt% (17.7 wt% - 18.0 wt% as FeO), with a slightly lower Fe content in the nearby mare soil.

We also used the Chandrayaan-1’s Moon Mineralogy Mapper (M3) data between 460 to 3000 nm. For this work M3 data at a resolution of 140 mpp were calibrated and photometrically corrected and converted to apparent reflectance. These spectra are not thermally corrected, so they are not analyzed for wavelengths longer than 2300 nm as these have a significant thermal emission component. In order to characterize the 1000 nm band a continuum removal method that enhances the characteristic of the 1000 nm absorption band was used. We fit a straight line between 750 and 1500 nm to remove the continuum.

Figure 5 - Image of study area from M3 (Chandrayaan-1) dataset (Left). The LPD, the northern crater and mare unit east of the crater are marked. At right, M3 spectra of the examined units [NASA/ISRO].
Figure 6 - M3 spectra of the pyroclastic deposit located on the surface of the volcanic dome, previous described by the authors, HERE.
In the mare unit and in the pyroclastic deposit spectra weak inflections over 1000 nm are detectable, but we wouldn't regard this as an unambiguous identification of olivine, because M3 spectra of high-olivine soils show a much broader absorption.

The spectral signature of olivine has a wide band centered beyond 1000 nm, while the pyroxenes displays a narrow trough around 1000 nm, with a minimum wavelength below 1000 nm, and a wide absorption band around 2000 nm. Interestingly, the dark pyroclastic deposit has a narrower absorption (centered at 970 nm) than the mare unit, such that it cannot be enriched in olivine when compared to the mare. Probably the previously detected Clementine-specific olivine signatures are only partially due to olivine but also due to mis-calibration. Although the continuum-removed M3 spectrum of the crater seems to be noisy, it displays three absorption bands centered at 920, 970 and 1029 nm, likely due to admixed quantity of pyroxenes and olivine.

The effusive dome (center) lords over the northern extremes of Mare Vaporum in this view of the north central nearside captured on Earth (stacked CCD image) and processed by Astronominsk, May 31, 2009. Twenty-one kilometer wide Conon crater adds some scale to the area, scoured out by the Imbrium basin-forming-impact 3.8 billion years ago. Under sunrise illumination, the dome's true height can be seen clearly [Astronominsk].
The Christiansen Feature (CF) from Gridded data record (GDR) level 3 data product of Diviner Lunar Radiometer Experiment/Lunar Reconnaissance Orbiter (Diviner) data were used for further analysis. The Lunar Reconnaissance Orbiter’s (LRO) Diviner Lunar Radiometer Experiment has a spatial resolution of 950 m per pixel. Diviner produces thermal emissivity data, and can provide compositional information from three wavelengths centered around 8 µm that are used to characterize the Christiansen Feature (CF), which is directly sensitive to silicate mineralogy and the bulk SiO2 content. Silicic minerals and lithologies exhibit shorter wavelength positions at 8 µm channel. For the study area, CF values of 8 µm are towards longer wavelength (CF ~ 8.3 µm) indicating less silicic composition.

Email: Raffaello Lena <gibbidomine@libero.it>  Barry Fitz-Gerald <barryfitz_gerald@hotmail.com>

REFERENCE: Lucey, P. G., Blewett, D. T., Jolliff, B.L.  Lunar iron and titanium abundance algorithms based on final processing of Clementine ultraviolet-visible images, J. Geophys. Res., 105(E8), 20,297–20,305 (2000)

(*) Mapping FeO and TiO2 content

Classic approaches to the estimation of  FeO and TiO2 are based on the evaluation of Clementine UVVIS reflectance. Lucey et al (2000) derive the equation:

Wt % FeO = 17.427θFe – 7.565

where θFe is calculated according to: θFe = - arctan [(R950 / R750) – yFe / R750 – xFe] as the polar angle in the R950 /R750  vs. R750 diagram with respect to the reference point (xFe, yFe ) = (0.08, 1.19).

Similarly for the abundance of TiO2 Lucey et al. (2000) obtain the relation:

Wt % TiO2 = 3.708 (θTi )5.979 with θTi =  arctan [(R415 / R750) – yTi / R750 – xTi] as the polar angle in the R415 /R750  vs. R750 diagram with respect to the reference point (xTi, yTi ) = (0.0, 0.42)

Tuesday, February 19, 2013

A fascinating effusive dome in Mare Vaporum

An effusive non-monogenetic volcanic dome super-positioned on a ghost crater near the north boundary of Mare Vaporum. LROC Narrow Angle Camera (NAC) mosaic M18144897LR, LRO orbit 11810, January 14, 2012; 1.29 meters resolution, mid-afternoon illumination incidence angle 66.7° imaged from 128.62 km [NASA/GSFC/Arizona State University].
Raffaello Lena and Barry Fitz-Gerald

We report a volcanic structure located some 40 kilometers west-southwest of the Yangel crater (9 km, 16.957°N, 4.688°E) in Mare Vaporum.

This dome (16.4°N, 3.3°E) lies immediately south of a mare inundated "ghost crater" approximately 7.5 km in diameter and appears to have partially affected part of that craters southern rim.

SELENE-1 (Kaguya), Chang'E-2 and Clementine albedo imagery clearly display dark pyroclastic material distributed upon the inner slope of the ruined ghost crater and adjacent to the north of the prominent dome, suggesting an ash type deposit. On the summit, a shallow depression is located, which likely corresponds to the vent or a collapse feature.

A presumably non-monogenetic mode of formation may be responsible for the peculiar shape of the dome, consisting of two layers, as shown in the derived data.

With a diameter of 5.2 kilometers and a height of 620 meters the dome appears to show evidence of mulch-phased activity modification from regional tectonic movements. Spectral analysis released on the calibrated and normalized Clementine UV/VIS and NIR reflectance data shows a LPD (Lighting Power Density) characteristic of pyroxenes and olivine.

LROC NAC view of the study area showing the 620 meter-high dome (1) with a possible debris apron (1a), partially submerged ghost crater (2) and its rim (3), area of uplift (4), merger of the debris apron of dome with the ghost crater wall (5), possibly an avalanche scar (6) and dark mantle deposits on the inner crater wall (7). (The yellow rectangle encompasses a field of view at considerably higher resolution in the next image.) LROC NAC mosaic M181144987LR [NASA/GSFC/Arizona State University].
Much closer look at the contact zone at the north side of the dome and the presumably older ghost crater, over its rim and wall. A 1.6 km meter field of view from LROC NAC mosaic M168183822LR, spacecraft orbit 9919, August 17, 2011; incidence angle 42.22° at 40 cm per pixel resolution (visible in next image - field of view in yellow rectangle above) from 24.42 km [NASA/GSFC/Arizona State University].
Dark mantle material at area of contact between the dome of interest and the ghost crater rim and wall, possibly affected by an avalanche, visible in this 233 meter-wide field of view at full resolution from LROC NAC mosaic M168183822LR [NASA/GSFC/Arizona State University].
According to its irregular shape, with the presence of two layers, the dome presumably formed during several stages of effusion, a process that may build up steep edifices, like in the Marius hills.

In this scenario we argue that the examined region has undergone an effusive process (in several eruption phases), before forming a steeper construct (average slope around 13°) and a subsequent explosive phase of volcanism forming the dark pyroclastic deposit. 

Representing this thinking the dome resembles some of the steeper domes among the Marius Hills, raising questions about sources of magma on the Moon's surface. A complete work is ongoing reporting our results collected by making use of LRO WAC images, SELENE-1 and Clementine multispectral data, the LOLA digital elevation model and the LROC WAC-based GLD100 DTM.

LROC QuickMap 3D relative elevation demonstration of the roughly 150 sq. km study area (top) Chang'E-3 global 40 meter low incidence albedo photography (center left) LRO WAC-derived surface elevation plot of a west to east cross-section dome (center right) and imagery from SELENE-1 (Kaguya) at bottom center.
The albedo contrast becomes more apparent under a higher Sun. LROC (NAC) mosaic M1098830275LR, LRO orbit 14284, August 5, 2012; 1.28 meters resolution from 126.74 km [NASA/GSFC/Arizona State University].
Results from this study were featured by Charles Wood as Lunar Picture of the Day, February 15, 2012 and discussed in a forum post at Cloudy Nights Telescope Reviews.