Showing posts with label LPSC XLII. Show all posts

Wednesday, August 17, 2011

Sample redated, study reports a "younger Moon"


Photograph of 60025 sample used in the Borg study, "Note large proportion of pyroxene (green)" [LPSC 2011, #1127].

Redating a lunar sample after a weak acid bath has led workers to speculate the Moon may be 200 million years younger then generally thought. The report on a study appearing in Nature, by David Shiga at New Scientist, was previously presented to the 42nd Lunar and Plantary Science Conference in March 2011.

Lars Borg and colleagues at Lawrence Livermore based their conclusions following redating lunar sample FAN 60025, collected by Young & Duke during the Apollo 16 expedition to the lunar highlands north of the Descartes Formation in December 1972.

"But Clive Neal of the University of Notre Dame," Shiga wrote, "says some of the plagioclase - including this sample - might simply have melted again after the moon formed. Different minerals solidify at different temperatures, so if a heavy mineral solidified before a lighter one beneath it, it would sink, pushing magma upwards. This could melt the plagioclase and reset its age. "I remain to be convinced that the moon is as young as suggested by this paper," he says.

The report in New Scientist.
Citation appearing online by Nature

42nd Lunar and Planetary Science Conference, #1127

Monday, March 21, 2011

Volcanic Shields of the Moon


Shield Volcanoes of the Solar System: Marius Hills on the Moon (above) and Marion Island, Indian Ocean, Earth (below) -- Twins?

Paul D. Spudis
The Once & Future Moon
Smithsonian Air & Space


Come home with your shield, or on it – Spartan women to their husbands, marching off to war.

From the giant Olympus Mons shield on Mars (600 kilometers across and 27 km high) to the large volcanoes of Venus, shield-building was thought to be a common expression of volcanism on all rocky Solar System bodies; the Moon appeared to be a conspicuous exception. In geology, a shield volcano is a volcanic construct with a broad, low profile made up primarily of thin lava flows with little ash deposits. Earth’s shield volcanoes range in size from a few to more than 200 km for the Big Island of Hawaii, the extent of its base on the sea floor beneath the surface of the Pacific Ocean.

Our understanding of lunar volcanism has been informed and shaped both by images and samples. The large-scale shield volcanoes so prominent on Mars, Venus and Earth were believed to be absent on the Moon. Before the Apollo 11 astronauts visited Mare Tranquillitatis in 1969, we understood that the dark maria of the Moon were volcanic lava plains. Orbital images showed us a landscape of domes, small cones, sinuous lava channels (rilles) and collapse pits – surface features created by volcanic activity. Many of these small volcanic features tend to be clustered in provinces concentrated on the western near side.

Rocks from the maria are basalts, the most common type of igneous rock in the Solar System. They are rich in iron and magnesium and poor in silica. On Earth, when such rocks are molten, the resulting magma has a very low viscosity (i.e., they are very fluid, spreading onto flat surfaces in thin sheets). We understand lunar lavas to be similarly fluid, having erupted in thin sheet-like flows onto the airless surface of the Moon. The maria formed as this geologic process of massive high-volume eruptions built up stacks from the thin, fluid flows which extend for hundreds of kilometers. Scattered within the ancient maria are numerous small volcanic constructs, previously believed to be the only manifestation of central-vent volcanism on the Moon.

When the Moon’s topography was mapped with laser altimetry (first by Clementine in 1994, then at greater resolution by the Japanese Kaguya spacecraft and NASA’s Lunar Reconnaissance Orbiter mission), it showed clusters of many small volcanoes occurring on topographic highs that are quasi-circular, with low relief and shield-shaped. Pat McGovern, Walter Kiefer (colleagues at the Lunar and Planetary Institute) and I were intrigued by this correspondence. We studied these areas by mapping volcanic features, integrating the new topographic data, and examining their gravity signatures (the amount the local gravitational attraction is enhanced or depleted from normal).

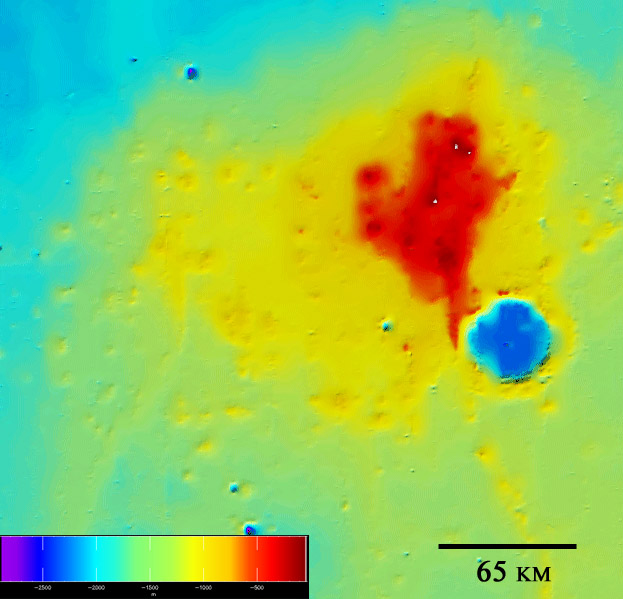
We found that these large shield-shaped topographic swells are made of basaltic lava and display concentrations of volcanic features. Such a structure found on Venus or Mars would be classified as a shield volcano; therefore, we interpret these features on the Moon as shield volcanoes. We have found seven of these large structures on the Moon, ranging in size from 66 to almost 400 kilometers in diameter and from 600 to over 3200 meters in height. Such sizes and shapes are very similar to large shields on Earth, Venus and Mars. The average slopes on these volcanoes are very low, typically less than a few degrees, as would be expected for structures made from very fluid lava. These lunar shields display abundant volcanic features, including domes and cones, sinuous rilles (lava channels and tubes) and collapse features – all common morphologies in terrestrial shield volcanoes.


Topographic map of the Marius Hills shield on the Moon from LOLA laser altimetry. A broad topographic swell with many small cones and domes on it [NASA/GSFC].

Although we believe these features are shield volcanoes, this new interpretation is not without some difficulties. Unlike most shield volcanoes on the other planets, none of the lunar shields has a central collapse pit (caldera). However, many shields – especially those on Venus – likewise do not show central calderas. Additionally, while evidence for some lunar shields such as the Marius Hills is pretty convincing (e.g., shield shape, high gravity signature indicating dense stacks of lava), the evidence for others is not as clear. The largest feature we identified, the Cauchy shield, possesses the correct topographic shape and has numerous small cones, rilles, and vents on it, but remote sensing data suggest that the lava thickness in eastern Mare Tranquillitatis is relatively thin, which might mean that Cauchy is not a thick stack of lava as Marius appears to be. We still think that Cauchy is a shield volcano, but acknowledge that our interpretation is tentative and we will continue studying these enigmatic features to better understand their history.

But the real story here is not whether these features are true shield volcanoes or not, but rather, how the advent of new, high-precision data (high resolution topography) can cause scientists to reexamine areas and processes long thought understood and perhaps come to surprisingly different interpretations. We are currently in the midst of a revolution in lunar science. The 42nd Lunar and Planetary Science Conference held this month in Houston highlighted new scientific findings about the history and processes of the Moon. New, high-quality data coming from an international flotilla of lunar orbital mappers – Chandrayaan, Kaguya, Chang’E and LRO – has scientists seriously reconsidering our current understanding of the processes, history, resources and potential of the Moon.

Related Reading:
LROC: Morphometry of lunar volcanic domes
February 22, 2011

The largest volcano on the Moon
October 19, 2010

LROC: Marius Hills ROI
June 2, 1010

Hearts of Marius, Shadows of Yutu
May 29, 1010

Local Topography and Reiner Gamma
May 22, 2010

LRO/LROC/LOLA: Marius Hills

March 20, 2010

LROC: Haruyama Cavern in the Marius Hills
March 2, 2010

Thursday, March 17, 2011

North Pole Mosaics & Video: Spectacular!


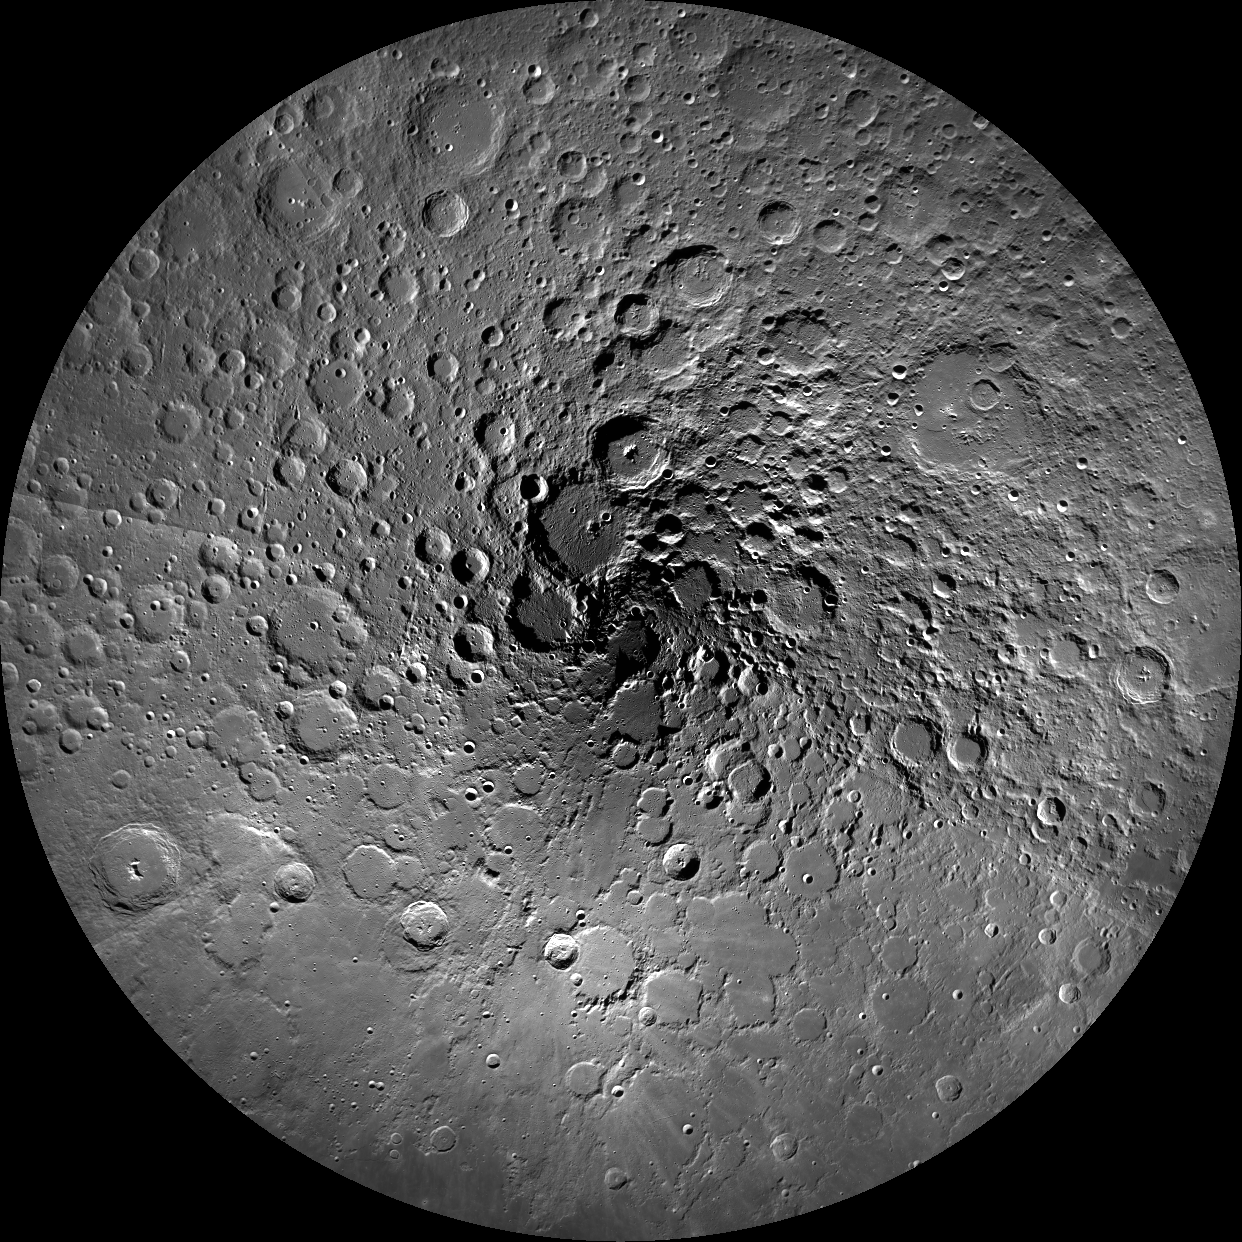
LROC Wide Angle Camera (WAC) mosaic of the Moon's north pole; polar stereographic projection, 60°N to 90°N. Full-sized release HERE [NASA/GSFC/Arizona State University].

Mark Robinson
Principal Investigator
Lunar Reconnaissance Orbiter Camera (LROC)
Arizona State University


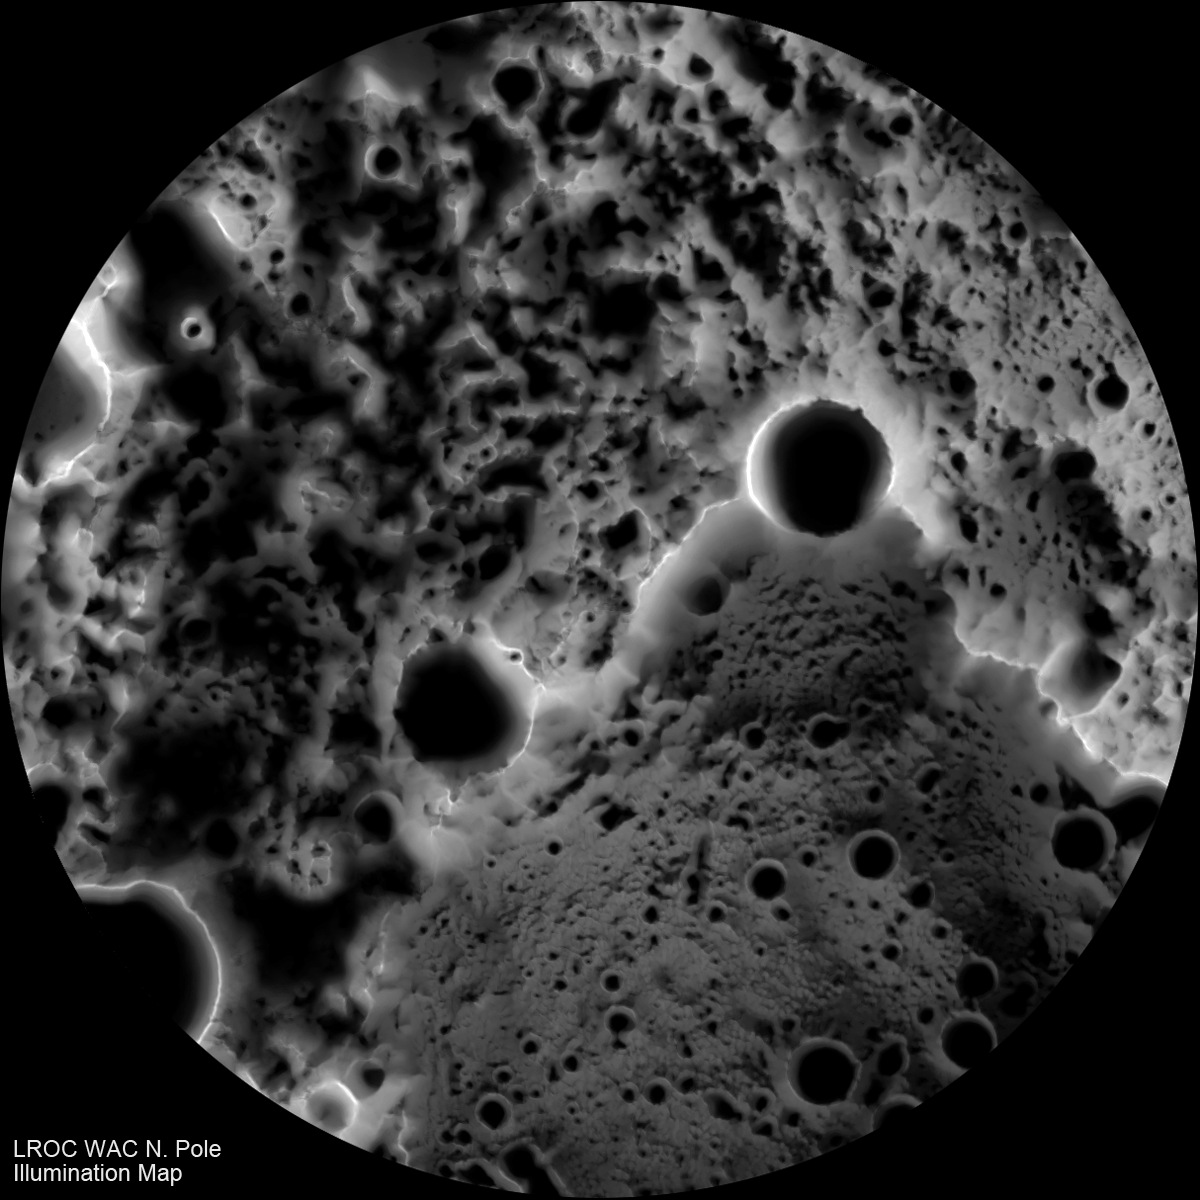
One of the primary scientific objectives of the Lunar Reconnaissance Orbiter Camera (LROC) is to identify regions of permanent shadow and near-permanent illumination. Since the start of the nominal mission, LROC has acquired thousands of Wide Angle Camera (WAC) images approaching the north pole. From these images we produced two very different types of mosaics. The more conventional mosaic is shown above and is composed of 983 images taken over a one month period during northern summer. This mosaic shows the pole when it is best illuminated, regions that are in shadow are candidates for permanent shadow. The best way to determine lighting conditions with image data is to take many pictures over a year and stack them up. From orbit-to-orbit, the WAC frames overlap from about 88°N to the pole. At each point you count how often that pixel is illuminated and create a percentage illumination map. You can also think of this mosaic as a multi-temporal mosaic.


WAC illumination map, brighter tones represent areas with more illumination during a year, the area shown is from 88°N to 90°N. Full-size release HERE [NASA/GSFC/Arizona State University].

A more dramatic way of displaying this multi-temporal dataset is the movie (600 m/p). below, posted on YouTube. Download the full-resolution Movie, HERE. Watch closely - can you spot any regions that are nearly always illuminated?


Navigate your way to the north pole with the full resolution (100 m/p) WAC mosaic!

Check out the full size co-registered north and south polar frames in the LROC archive.

More information on the WAC global mosaic and WAC polar illumination studies was presented at the 42nd Lunar and Planetary Science Conference, earlier this month.


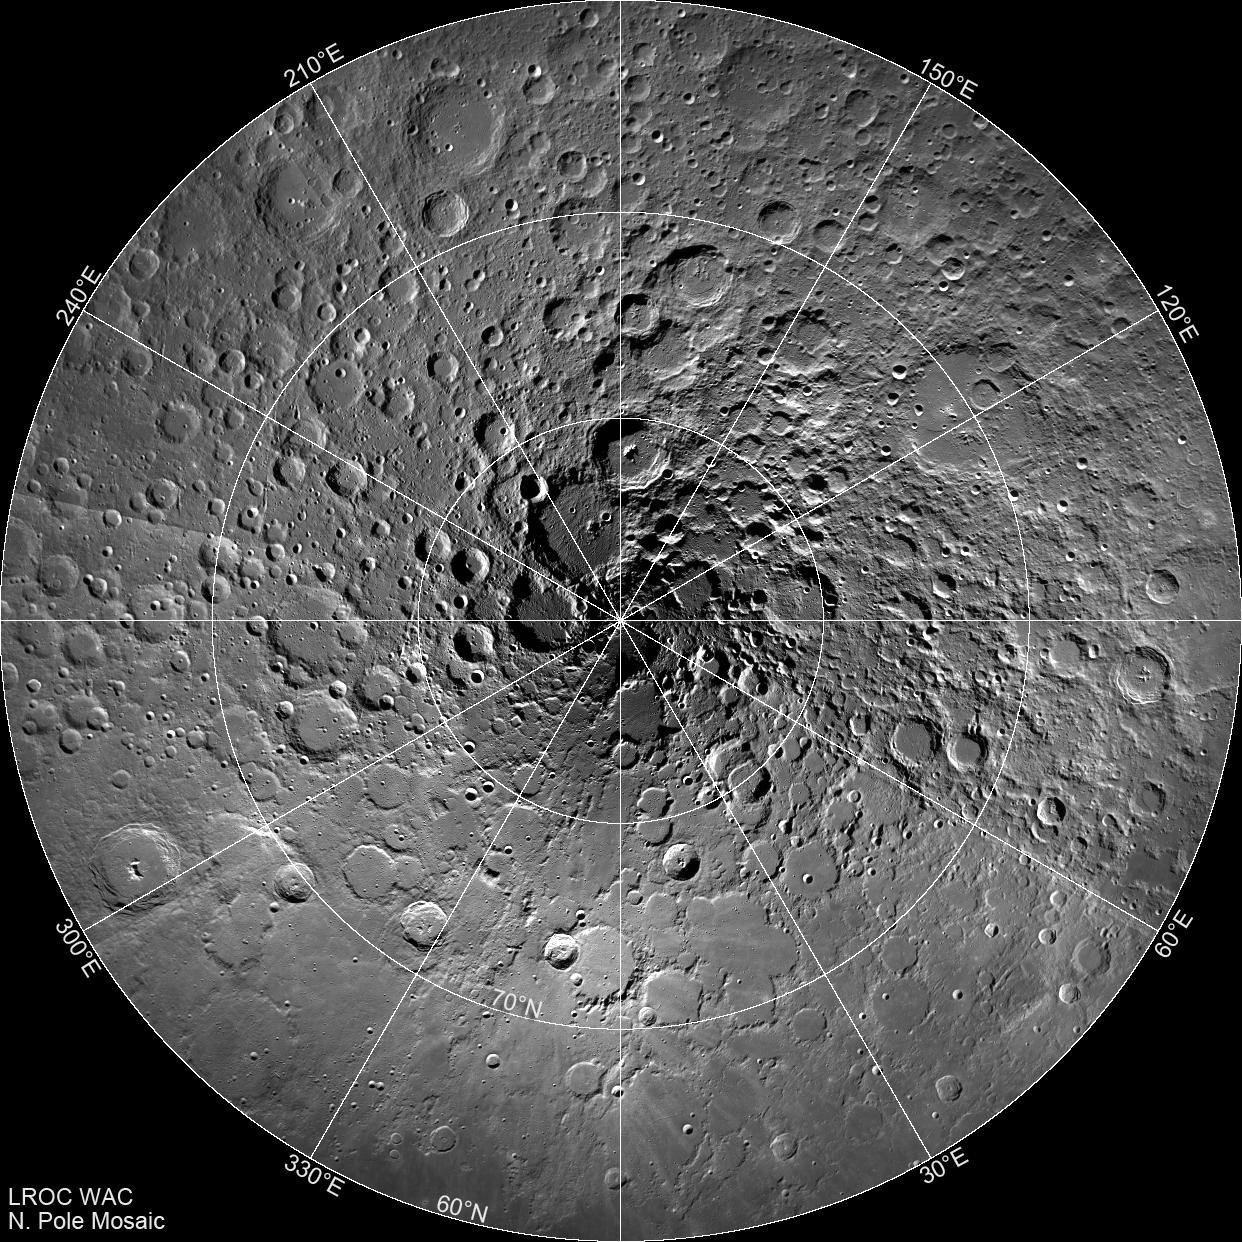
LROC WAC north pole mosaic with latitude, longitude grid. View the full-sized LROC release image HERE [NASA/GSFC/Arizona State University].

Looking for even higher resolution? Check out the LROC Narrow Angle Camera (NAC) north pole mosaic. It's resolution is 2 meters/pixel, covering from 85.5°N to the pole.

Spectacular!

Tuesday, February 22, 2011

LROC: Morphometry of lunar volcanic domes


Tran, Robinson & Lawrence
Braden, Plescia, Hawke, Jolliff, Stopar &
the LROC Team
Arizona State University
Applied Physics Laboratory
Hawaii Institute of Geophysics and Planetology
Washington University


Introduction: Lunar domes have long held the interest of the lunar science community, but their origin and composition are still not well understood. Previous studies, using Lunar Orbiter, Apollo, Clementine, and LRO data, have proposed several formation mechanisms, and all agree that most lunar domes are volcanic features [1-9].

In anticipation of the 42nd Lunar & Planetary Science Conference, we continue highlighting some of the announced presentations related to lunar science:
We investigated the morphometry and morphology of Gruithuisen, Mairan, Compton-Belkovich, Hortensius, Rümker Hills, and Marius Hills domes using Lunar Reconnaissance Orbiter Camera (LROC) Narrow Angle Camera (NAC) derived digital terrain models (DTMs). These six regions cover two distinct classes of domes, mare and nonmare. The nonmare Gruithuisen, Mairan, and Compton-Belkovich domes have a higher albedo and a strong ultraviolet absorption.

These domes generally have steeper slopes, are high in silica and thorium [3,10,11], and low in iron and titanium [6]. In comparison, mare domes have shallow slopes, lower albedo, and generally weaker UV absorption, presumably due to lower-viscosity mare basalt [1].

Data Sources: NAC stereo pairs were reduced to DTMs with a posting of 2.0-5.0 m using standard photogrammetric techniques and were controlled to the LOLA reference frame [12]. The vertical precision error for the 2.0 m/post DTMs is less than 11 m, and the vertical precision error for the 5.0 m/post DTMs is typically less than 5 meters. The absolute accuracy of the DTM largely depends on the accuracy of the LOLA data, currently within 1 m radial [13] and 50 meters horizontal [14].

Figure 1 illustrates the topography and slopes of a dome in Compton-Belkovich as an example of the results. Figure 2 illustrates examples of the topographic profiles that can be extracted from the DTMs, in this case for Gruithuisen NW and Hortensius. Data for each of the domes examined are presented in Table 1.

Results: Mairan T dome is located west of Mairan crater, is symmetrical in planform, and is interpreted to have originally formed on highland material and subsequently embayed by mare basalt [2]. Slopes on the flank range from 22° to 27° and have a well-defined contact with the mare. At the summit is a depression, ~3.8 km wide and up to 450 m deep, likely formed from collapse associated with magma withdrawal. The slope of the walls of the depression are 13° to 25° and the depression has a flat floor.


Highly reduced 10000 samples and 15000 lines of LROC Narrow Angle Camera observation M127247376LR (down to 400x800 resolution above) shows half of the Marian T dome and the eastern half of its steep slopes, rising ~770 meters from its contact with the Oceanus Procellarum floor. LRO orbit 3886, April 30, 2010 [NASA/GSFC/Arizona State University].

Gruithuisen NW dome is a small dome relative to Gruithuisen δ and Gruithuisen γ. The smaller dome is situated on highland material and is similar to Mairan T with slopes of 22° to 27°. The dome exhibits a summit plateau ~2.5 km in diameter.


Gruithuisen NW, crowded by the larger (20 km-wide) of the two domes (AKA Mons Gruithuisen Gamma - 36.0°N, 319.5E°), at below right of center. LROC WAC observation M117759764ME, LRO orbit 2428. January 10, 2010 [NASA/GSFC/Arizona State University].


Another highly reduced (down to 400 x 800 from the 15000 x 10000 pixel original) close-up of the northwestern of the two domes in the WAC observation immediately above, this time a center slice of both the left and right frames of LROC NAC observation M114226267, LRO orbit 1967, November 30, 2009 [NASA/GSFC/Arizona State University].

The Compton-Belkovich region is a localized thorium anomaly located on a topographic rise between Compton and Belkovich craters [15]. The largest of several domes is located on the northern edge of the region. Its diameter is ~6.8 km, with a height of ~575 m from the southern base and ~950 m from the northern base. Flank slopes are generally 20° to 26° except on the northwest flank where slope gradually decreases from ~16° to 12-13°. Unlike the Gruithuisen NW and the Mairan T domes, where the dome has an abrupt change in slope near the base, this dome has a gradual change in slope, merging with the surrounding surface.


Figure 1. Color-shaded relief map (top) and slope map (bottom) of Compton-Belkovich Dome 1.

The Hortensius Domes are mare domes located north of Hortensius crater in Mare Insularum. The four domes that were analyzed are numbered Hortensius 1, Hortensius 2, Hortensius 3, and Hortensius 4. These domes are broad low-relief features having a gradational contact to the mare. Hortensius 2 and 3 each have one summit crater, Hortensius 1 has two summit craters, and Hortensius 4 has no summit crater. All of the summit craters are slightly offset from the dome peaks, and the depth of the craters are the same or slightly smaller than the height of the domes. The d/D ratio for all four craters is between 0.14 and 0.17. All of the summit craters but one are rimless, implying a non-impact origin. The crater on Hortensius 1 has a rim up to 35 m high, which may indicate an impact origin or late stage viscous materials.


Hortensius (6.5°N, 332.0E°) and four of the 15km-wide crater's nearby namesake volcanic domes, referenced in MORPHOMETRY OF LUNAR VOLCANIC DOMES FROM LROC, 42nd Lunar and Planetary Science Conference (#2228), Tran, Robinson, Lawrence, et al. LROC Wide Angle Camera (WAC) monochrome (643nm) observation M120039376, LRO orbit 2824, February 5, 2010 [NASA/GSFC/Arizona State University].

The Rümker Hills are situated on an elevated mare region in Oceanus Procellarum [16]. Flanks of the domes show a distinct ridged texture, and the majority of summit craters are degraded with low d/D ratio. The three domes that were analyzed are the western flank of Rümker Hill 1, the eastern flank and summit crater of Rümker Hill 2, and the western flank of Rümker Hill 3. The NAC DTM overlaps with the summit crater in Rümker Hill 2, and its d/D ratio is ~0.08.


Necessarily foreshortened view of the Rümker Hills, in an idealized line-of-sight view from Earth, from the LROC WAC mosaic of the lunar nearside released February 21, 2011 [NASA/GSFC/Arizona State University].


Mons Rümker (41.0°N, 301.1E°), itself a 71-km-wide dome plateau in north Oceanus Procellarum, along with three of its hosted volcanic domes as referenced in MORPHOMETRY OF LUNAR VOLCANIC DOMES FROM LROC, 42nd Lunar and Planetary Science Conference (#2228), Tran, Robinson, Lawrence, et al. LROC Web Map Server (WMS) image search engine map [NASA/GSFC/Arizona State University].

The Marius Hills complex, located in Oceanus Procellarum, has the largest concentration of volcanic features on the Moon [5,7,8]. The majority of domes are irregularly shaped, suggesting changes in lava composition or eruption rates (or both). Two domes were examined: Marius Hill 1 and 2. Both have irregular slopes varying between 5-23°. Both of the analyzed domes have a rough summit plateau; Marius Hills 1 has a smaller cone-like feature superimposed, possibly representing multiple vents, compositional changes, or variability in eruption rate.


The heart of the Marius Hills (12.0°N, 306.0E°), the most extensive dome field on the Moon, identified by China's researchers as one enormous volcano dominating central Oceanus Procellarum. The largest two domes, are seen here south of the familiar sinuous rilles at local sunrise, LROC WAC monochrome (689nm) observation M116683214ME, LRO orbit 2329, December 29, 2009 [NASA/GSFC/Arizona State University].

Discussion: Flank slopes on the domes fall into two categories: steep (greater than 20°) and shallow (less than 10°). For terrestrial volcanic constructs [17], steep slopes are typically associated with relatively silicic (e.g., rhyolitic) domes such as those of the Owens Valley [18-20]. Shallow slopes are typically associated with low viscosity, basaltic-style eruptions. In fact, the mare domes may be more accurately referred to as low shields rather than as domes. The composition of all the lunar domes currently is not well understood.


Table 1. Height is relief with respect to the surrounding terrain. D is average basal diameter. Slope is average flank slope measured across the width of the entire flank.


Profiles: 5x vertical exaggeration

Friday, February 18, 2011

New pyroclasts identified using LROC data

From LROC WAC Album -
LROC WAC monochrome (689nm) observation M117691527ME, LRO orbit 2478, January 9, 2010. The inundated crater at top center left is 13km-wide Tobias Mayer B (15.3°N, 329.0°E) Potential newly identified pyroclastic formations often reside in plain sight in an area well-known for ancient pyroclastic activity. The on-going wide and narrow angle camera survey by the Lunar Reconnaissance Orbiter Camera aboard LRO is making such identification look easy [NASA/GSFC/Arizona State University].

A SEARCH FOR POTENTIAL NEWLY IDENTIFIED LUNAR PYROCLASTIC DEPOSITS WITH LROC DATA, #2434

Gustafson, Bell, Gaddis, Hawke, Giguere
& the LROC Science Team
Cornell University
Arizona State University
Astrogeology Program, USGS
University of Hawaii at Honolulu
Intergraph Corporation, Kapolei, HI

Introduction and Background: Pyroclastic deposits have been recognized all across the Moon, identified by their low albedo, smooth texture, and mantling relationship to underlying features [1-3]. New LRO camera (LROC) data permit additional locations of potential pyroclastic deposits to be examined in greater detail than previously possible. Lunar Reconnaissance Orbiter (LRO) Wide Angle (WAC) and Narrow Angle (NAC) camera data [4] are being used to search for lunar dark mantle deposits of potential pyroclastic origin that have not been previously cataloged. Most of the potential pyroclastic deposits previously identified in the literature were summarized by Gaddis et al. [5]. Our goal is to compile a more complete listing of potential pyroclastic deposits to facilitate efforts to characterize and interpret the distribution, properties, and possible origins of these features.

Over the coming weeks, in anticipation of the 42nd Lunar & Planetary Science Conference, we continue highlighting some of the announced presentations related to lunar science:
Methods: The LRO WAC acquires monochrome images using the 605 nm filter at a resolution of ~75 m/pix, and multi-spectral images at two ultraviolet (UV) and five visible (VIS) wavelengths (320, 360, 415, 565, 605, 645, and 690 nm) at a resolution of ~400 m/pix in the UV and ~75 m/pix in the visible [4]. The LRO NAC produces monochrome images at resolutions of ~0.5 m/pix [4]. We examined a preliminary 100 m/pix global monochrome WAC mosaic for dark deposits with morphologic indicators of pyroclastic origin, such as: mantle and subdue subjacent terrain exhibit diffuse margins do not embay adjacent topographic lows associated with rilles or possible vents

Our search has focused on locations in the LROC targeting database where the presence of pyroclastic materials was suspected, often because of their association with other volcanic deposits and/or fractures or rilles. These deposits were not well enough resolved in previous data sets to assess their mode of emplacement. For some locations, we processed and examined WAC color mosaics and/or high-resolution NAC images (if available for the target area) to look at additional details of mantling relationships, deposit textures, and possible volcanic vents. The NAC images are especially valuable for examining potential vents and assessing physical characteristics of the DMDs such as thickness, roughness, and rock abundance.


LPSC XLII (2434) Figure 1. Examples of potential newly identified pyroclastics [NASA/GSFC/Arizona State University]..

Results and Discussion: We have examined over 125 low-albedo deposits as part of this effort. Approximately half of these do not exhibit significant evidence of pyroclastic emplacement. For the remaining 64 deposits, in many instances it was not possible during our preliminary screening to make a definitive judgment as to whether the deposit has a pyroclastic component. Therefore, after eliminating locations for which a pyroclastic origin appears unlikely, we are classifying the remaining locations as either “possible” (44 deposits) or “probable” (20 deposits). “Possible” deposits generally have low albedo, lack sharp margins, and exhibit some evidence of mantling the local topography. In addition to these features, “probable” deposits typically either exhibit strong evidence of mantling or are associated with possible vents.

These potential newly identified pyroclastic depos-its are located primarily on the near side, in both the highlands and the maria. The most common setting is either highlands adjacent to maria or within basalt-flooded highlands craters. Three example locations are shown below; their locations are marked on Fig. 1.

1. Schluter crater (Fig. 2) – probable pyroclastic in basalt-flooded highlands crater
2. Montes Carpatus (Fig. 3) – possible pyroclastic in highlands adjacent to maria
3. NE Mare Vaporum (Fig. 4) – possible pyroclastic in maria

The deposits are usually found in areas exhibiting other evidence of volcanic activity (e.g. effusive deposits, rilles, domes, or possible vent structures). Suspected vents often appear as irregular depressions 1-2 km wide and 2-5 km long, although in some cases individual vents may be contained within larger depressions of possible tectonic origin.


LPSC XLII (2434) Figure 2. Schluter crater (5.9°S, 276.7°E) from LROC WAC monochrome (643nm) observation M118037225ME, LRO orbit 2528, January 13, 2010 [NASA/GSFC/Arizona State University].

Conclusions and Future Work: Preliminary re-view of the LROC global monochrome WAC mosaic has indicated that there are numerous potential localized lunar pyroclastic deposits that have not been cataloged in previous surveys, most likely due to their small size or subtle features. LROC color WAC and high-resolution NAC images provide the means to study these deposits in greater detail, revealing small deposits, thin mantling layers, and potential vents [6]. Potential newly identified pyroclastic deposits identified so far are concentrated on the near side, in both highlands and maria. Consistent with previous studies, they are typically found near the margins of basins and in floor-fractured craters. These deposits are usually found in areas exhibiting other evidence of volcanic activity.


LPSC XLII (#2434) Figure 3. Closing in on the target from the context of the image at the beginning of this post (LROC WAC monochrome (689nm) observation M117691527ME) and well into the LROC Narrow Angle Camera observation M120053157, LROC orbit 2826, Feb. 5, 2010 [NASA/GSFC/Arizona State University].

We plan to continue our search for potential pyroclastic deposits using the monochrome WAC mosaic, focusing on regions for which there were gores in coverage in the initial products. Promising locations will be further evaluated using color WAC and NAC data to confirm the pyroclastic nature and study physical characteristics of these deposits. For selected deposits, we intend to apply methods used in earlier studies of lunar pyroclastic deposits with Clementine spectral reflectance (CSR) data (e.g., [5]), and to explore the potential of LRO WAC data to complement the CSR data for compositional analyses. We will apply these combined data to characterize inter-deposit and intra-deposit variations in order to test hypotheses regarding the formation of localized lunar pyroclastic deposits, including 1) that localized pyroclastic deposit characteristics (e.g. areal extent, volume, composition, and vent configuration) are primarily related to the geologic setting, and 2) that adjacent pyroclastic and effusive deposits are likely related to a common source.

References: [1] Head J.W. III (1974) PLSC 5th, 207-222. [2] Gaddis L.R. et al. (1985) Icarus 61, 461-488. [3] Hawke B.R. et al. (1989) PLPSC 19th, 255-268. [4] Robinson M.S. et al. (2010) Space Sci. Rev. 150 (1-4), 81-124. [5] Gaddis L.R. et al. (2003) Icarus 161, 262-280. [6] Gaddis L.R. et al. (2011), this volume.


LPSC XLII (#2434) Figure 4. Context of the vicinity within Mare Vaporum (13.0°S, 3.0°E) from LROC WAC monochrome (643nm) observation M119842755ME [NASA/GSFC/Arizona State University].

Tuesday, February 8, 2011

Sublunarean Void


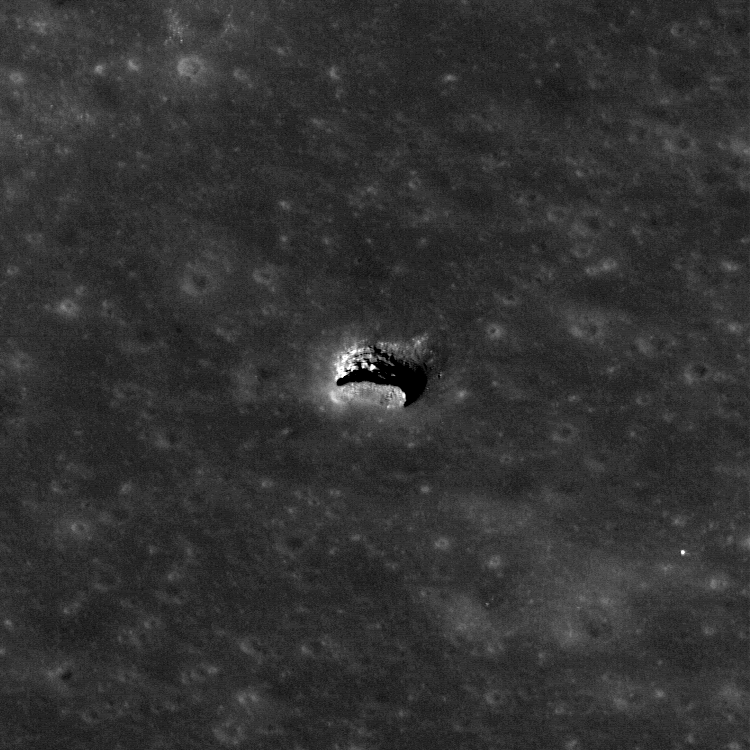
The LROC Narrow Angle Camera acquired an oblique view of the Marius Hills "Haruyama Skylight" pit at just the right angle to reveal an overhang. The pit is about 65 meters in diameter (LROC NAC observation M137929856R, LRO orbit 5460, August 31, 2010) [NASA/GSFC/Arizona State University].

Marc Robinson
Principal Investigator
Lunar Reconnaissance Orbiter Camera
Arizona State University


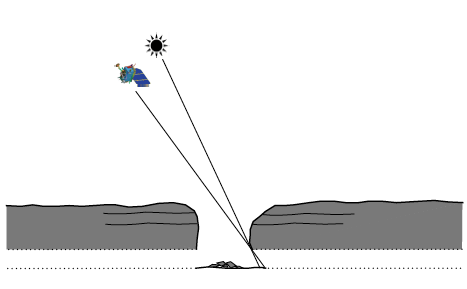
Since LRO completes a full cycle of lunar imaging each month, it is possible to follow up previous discoveries and re-image targets under different lighting conditions. The LROC team waited patiently until the Sun and orbit position in the Marius Hills region was such that the bottom of the previously imaged pit wall was illuminated at just the right angle so that if there was an open lava tube extending horizontally its floor would be illuminated. The spacecraft slewed 43° to the east and the solar incidence angle was 34° from vertical.


Schematic of the imaging geometry in cross section, allowing a view of the lava tube floor [Arizona State University].

In this geometry, the NAC was able to image a few meters under the overhang discovering a sublunarean void! Will astronauts someday explore under the mare? What scientific riches wait to be discovered within the unseen reaches of sublunarean voids?


LPSC XLII (2011) #2771, Figure 2b. "The Mare Tranquilitatis pit, imaged at LRO nadir (0.00°) (2a) and -51° (2b) slew angles; images; M126710873R and M144395745L, respectively. Note layering complexity, differentially modified pit wall profile, and funnel-shaped rim in 2b (red scale bars are ~ 100 meters along each length" [NASA/GSFC/Arizona State University].

Also note how the oblique angle really brings out the layered nature of the mare bedrock in the pit walls. These exposed layers give scientists important clues as to how the vast mare were deposited.

Explore the entire oblique image! Read the 2011 Lunar and Planetary Science Conference abstract describing details of this fascinating discovery.

Also check out previous Featured Images of the Mare Tranquillitatis and Mare Ingenii pits.

Monday, February 7, 2011

The Spectral Properties of Ina

Ahead of the 42nd Lunar & Planetary Science Conference, we highlighted selected presentations related to lunar science:

Ina, a unique 2.8 km-wide feature with a distinctly blue optical component originally spotted by Apollo astronauts from orbit. LROC Narrow Angle Camera observation M119815703, from 41.15 kilometers, orbit 2791, February 3, 2010; resolution 0.48 meters per pixel, incidence angle 56° [NASA/GSFC/Arizona State University].

THE SPECTRAL PROPERTIES OF INA: NEW OBSERVATIONS FROM THE MOON MINERALOGY MAPPER #2499.

Isaacson, Petro & Boardman et al
Planetary Science Institute, Brown University; NASA Goddard; AIG, LLC; U. Maryland; U. Tennessee

Introduction: The unusual morphology and appearance of Ina, originally referred to as ‘D-Caldera’ because of it’s unique shape (Figure 1), have been of interest to lunar scientists since it was first identified in Apollo images [1, 2]. Early studies of this 2.8 km wide depression interpreted it to be a lunar caldera or collapse pit, based in part on its location near the summit of a broad, low-relief dome [1-4]. The interior of Ina contains smooth mounds and small plateaus of positive relief surrounded by brighter and rougher, lower-lying floor materials [1-4]. Several lines of evidence suggest the presence of relatively fresh surfaces within the floor of the Ina depression [5,6]. These factors include the preservation state of small-scale relief, the small number of superposed craters and an apparent lack of significant space weathering associated with the bright interior regions. Based on these properties, portions of Ina’s interior have been interpreted as being less than 10 Myr old and perhaps still forming as the result of episodic outgassing from the deep interior of the Moon [6].

LPSC XLII (2011) Figure 1. Kaguya Terrain Camera morning image of Ina (light is from the east, mound features have positive relief).

Recent Narrow Angle Camera (NAC) images returned by the Lunar Reconnaissance Orbiter (LRO) are revealing the morphology of Ina at resolutions of up to 0.5 m/pixel [7]. While crater densities observed in this new data indicate an average age > 10 MY for the lower floor unit as a whole [7], the new data also show steep slopes and boulder fields down to the limit of resolution that may represent smaller areas of more recent disturbance. Reflectance data recently acquired by the Moon Mineralogy Mapper (M3) are assessed here to investigate the spectral properties and origin of these bright floor materials within Ina. M3 Data: The M3 imaging spectrometer was a guest instrument on India’s Chandrayaan-1 mission which launched on October 22, 2008 and mapped the lunar surface through August of 2009. M3 data of Ina and surrounding deposits were acquired twice in global mapping mode, which covered the wavelength range of ~430 to 3000 nm in 85 spectral bands. The first acquisition occurred in Optical Period 1b (OP 1b) at a spatial resolution of 140 m/ pixel and a phase angle of ~52 degrees. Preliminary M3 observations of Ina from this data acquisition are presented here. To provide an improved context for interpretation, M3 data have been co-aligned with Terrain Camera data from the Kaguya satellite (Figure 1) and topographic data acquired by the Lunar Orbiter Laser Altimeter (LOLA) aboard LRO.

LPSC XLII (2011) Figure 2. M3 mapper color composite (blue=460nm, green=1580nm, red=2780nm) overlaid on a Kaguya Terrain Camera image. Ina stands out from surrounding deposits due to its bright reflectance at blue wavelengths.

M3 Observations of Ina: Apollo 17 astronauts first observed the relatively blue color of the ‘rough, blocky’ floor materials in Ina that were described as having a ‘very light bluish-gray’ tint relative to surrounding materials, with raised bumps that were similar in color to surrounding terrain [8]. Figure 2 shows an M3 image of Ina in which these floor materials stand out relative to surrounding materials and the elevated interior mounds due to their bright reflectance in blue wavelengths of light (M3 460 nm band).

LPSC XLII (2011) Figure 3. Perspective view of Ina looking northwest, based on co-aligned 3M (Chandrayaan), Kaguya & LOLA (LRO) topographic data. Bright optically immature deposits on the floor of Ina appear green in this M3 color ratio composite due to a strong 1 micro-meter ferrous band relative to surrounding deposits (b=460/750nm, g=750/990, R=750/460nm) [NASA/JAXA/ISRO].

Figure 3 shows an example of a M3 ratio composite as a perspective view using LOLA topographic information. As in Figure 2, this image has been overlaid on Kaguya data to provide greater morphologic context for interpretation of the M3 reflectance data. This M3 data demonstrates that the strong ferrous absorption associated with relatively unweathered materials identified in previous studies [6] are related to bright floor materials within Ina, rather than broad topographic slopes. In contrast, the raised mounds within Ina lack a spectral signature associated with freshly exposed surfaces. Figure 4 compares floor materials within Ina displaying the strongest mafic bands to optically immature (‘fresh’) mare craters in Mare Serenitatis and Mare Tranquillitatis (low and high-titanium mare basalts, respectively). For these comparisons, the least weathered 1% of mare materials by surface area were sampled from each basalt type based models of mare maturity [9, 10]. The least-weathered floor materials within the Ina depression (average of eight 140m x140m pixels) are found to resemble very fresh materials within recent craters in Mare Tranquillitatis.

LPSC XLII (2011) Figure 4. A 3M reflectance spectrum of the brightest interior regions are compared to surrounding soils, as well as fresh mare craters in high and low titanium mare basalts.

Summary and Future Work: Preliminary examination of M3 data for the Ina structure is consistent with previous studies [6] that have identified relatively unweathered high-titanium basalts within the blocky floor materials. These results support the interpretation that floor materials within Ina have been disturbed recently enough to be spectrally similar to small, fresh mare craters within Tranquillitatis. Calibrations and analysis of the M3 Ina data are on-going and have yet to be fully corrected for thermal emission and scattered light. Future investigations will more fully explore these new data and associated lunar features for maturity and mineralogical information as well as the possible presence of volatile components. No significant signs of volatile components have been observed in preliminary analysis of these data.

References: [1] Whitaker, E. A. (1972), NASA SP-289, 25, 84-85, , [2] El-Baz, F and A. W. Warden (1972) NASA SP-289, 25, 1-25 [3] El-Baz, F. (1973) NASA SP-330, 30, 13-17. [4] Strain, P. and F. El-Baz (1980), PLPSC, 2437-2446. [5] Schultz, P.H. (1991), LPI Techn. Rept. 91-03, 37-38, [6] Schultz, P.H. et al. (2006), Nature, 444, 184-186. [7] Robinson, M. et al. (2010), LPSC 41, 2592 [8] Evans, R. E. and F. El-Baz (1972) NASA SP-289, 28,1-32. [9] Staid, M. and C. M. Pieters (2000), Icarus, 145, 122-139 [10] Wilcox et al. (2005), JGR, 110, E11001.
- 42nd Lunar and Planetary Science Conference (2011)

The LROC NAC frame at the beginning of this post superimposed on an LROC WAC monochrome mosaic that is, in turn, overlaid upon the lunar digital elevation model available to users of the Google Earth application (>v.5), looking northwest toward the eastern range of the Montes Apenninus more than 100 km away. This perspective is similar to that seen in Figure 3 -LPSC XLII (2003) #2499.

New dark-halo craters in Alphonsus

Over the coming weeks, in anticipation of the 42nd Lunar & Planetary Science Conference, we are again this year highlighting some of the announced presentations related to lunar science:


Familiar nearside landmark 121km Alphonsus, near 13.4°S, 357.2°E. LROC Wide Angle monochrome (643nm) mosaic composed from images swept up by the LROC Wide Angle Camera in four successive orbital flyovers on February 4, 2010. Most of what is known of small pyroclastic vents and their association with the dark mantling material surrounding them comes from study of this crater, well-placed for study from Earth on the Moon's central meridian. Recently analysis of recent high-resolution data has uncovered at least two previously unrecognized vents in the floor of Alphonsus [NASA/GSFC/Arizona State University].

ALPHONSUS DARK-HALO CRATERS: IDENTIFICATION OF ADDITIONAL VOLCANIC VENTS, #2691.

Gaddis, et al. Astrogeology Science Center, U. S. Geological Survey; Northern Arizona University; Cornell University; University of Hawaii;
Intergraph Corporation

Overview: Dark-halo craters located along fractures in the floor of Alphonsus crater (108 km dia.; ~13ºS/357ºE) are considered type localities of small lunar pyroclastic deposits based on association of dark mantling material with likely cone-shaped source vents. Much of our understanding of the physical processes involved in smaller pyroclastic eruptions on the Moon comes from morphometric analyses of deposit volumes in Alphonsus crater performed by Head and Wilson [1]. These authors used high-resolution photographs and topographic maps to map the distribution and measure volumes of materials in the pyroclastic cones. They identified juvenile materials in all but one of the “dark halo” crater deposits. This study presents evidence for at least two previously unrecognized vents in the floor of Alphonsus crater. Results suggest that many such features and associated pyroclastic deposits are likely to be identified with the wealth of new lunar remote sensing data [e.g., 2, 3, 4].

Geologic Setting: Alphonsus is a Lower Imbrian-age crater located in the highlands east of the Upper Imbrian-age Mare Nubium [5]. The crater has a ~flat, cratered floor, a central peak, and a broad rim (Figure 1). Numerous linear rilles dissect the crater floor and dark-halo craters are located along and adjacent to the rilles, suggesting that the fractures provided preferential pathways for dike emplacement, volatile accumulation and subsequent pyroclastic eruption. Eleven dark-halo craters were mapped previously within Alphonsus [1]; ten of these are located within 25 km of the basin rim. These dark halo craters are characterized by non-circular rims.


LPSC XLII (2011) 2691 Figure 1. Alphonsus crater and the locations of major floor fractures (green), Eleven dark-halo craters identified previously by Hawk & Wilson (1979) and two newly identified vents. Kaguya Terrain Camera evening mosaic [JAXA/SELENE].

Analysis: Because of their iron-rich compositions, the volcanic deposits within the floor of Alphonsus crater are highlighted as bright in FeO maps derived from Clementine UVVIS data [10]. Examination of these data (Figure 2) reveals obvious iron-rich materials in association with the 11 previously recognized vents, but at least two additional sites are also highlighted (arrows). To examine these sites in more detail, we used data from the Lunar Reconnaissance Orbiter (LROC) Narrow Angle Cameras (NAC) [2; ~0.5 m/p] and the JAXA SELENE/Kaguya Terrain Camera [3; ~10 m/p].


LPSC XLII (2011) 2691 Figure 2. Alphonsus crater viewed by Kaguya Terrain Camera evening mosaic with superimposed false-color Clementine derived iron-oxide (Lucey, et al., 2000). Yellow tones show enhanced iron content, arrows mark the sites of two possible newly identified pyroclastic deposits [JAXA/SELENE/NASA/DOD/USGS].

The northeastern feature is centered on a group of irregular depressions (Figure 3a) located along a rille NW of Ravi cone [1], a previously recognized pyroclastic deposit. The northeastern deposit has a moderate albedo, extends ~4 km across, and has occasional darker portions that drape and mantle the margins of the host depressions (Figure 4). The east-central deposit (Figure 3b) is centered on a small depression west of deposit 6 of [1], has an even higher albedo, and extends ~2 km across. Both possible vent depressions straddle linear rilles. These characteristics resemble those of other nearby deposits and support a pyroclastic origin for these features.

Summary: Two possible newly identified pyroclastic deposits have been recognized in the floor of Alphonsus crater. The moderate albedo of these deposits and their small size likely precluded earlier identification. New high-resolution image data [2, 3] allow more detailed analysis of the lunar surface and will likely support identification of many such features [e.g., 4]. These results suggest that pyroclastic deposits are likely to be even more widespread than previously recognized [e.g., 8, 9].


LPSC XVII (2011) 2691 Figure 3. Possible newly identified "dark halo" deposits (blue) in (a.) northeastern and (b.) eastern floor of Alphonsus crater. Both are near previously recognized deposits (yellow). Box in (a.) marks location of Figure 4 view. Views from the Kaguya Terrain Camera evening mosaic at same scale; north is up [JAXA/SELENE].


LPSC XLII (2011) Figure 4. From LROC NAC frame M111613281L, 0.54 m/p, 30 degree inc., showing dark, drapey deposits along the margin of an irregular depression associated with the possible newly identified "dark halo" deposits in the northeastern floor of Alphonsus crater. North is up, view is ~20 meters across [NASA/GSFC/Arizona State University].

References: [1] Head and Wilson (1979) PLPSC 10th, 2861. [2] Robinson et al., 2010, Space Sci. Rev, 150, 81-124. [3] Haruyama et al., 2008, Adv. Sp. Res. 42, 310-316. [4] Gustafson et al., 2011, this volume. [5] Hawke et al., 1989, PLPSC 19th, 255. [6] Head and Wilson, 1989, JVGR 37, 261-271. [7] Coombs et al., 1990. PLPSC. 20th, 339. [8] Gaddis et al., 2000, JGR, 105, 4245. [9] Gaddis et al., 2003, Icarus 161, 262. [10] Lucey et al., 2000, JGR 105, 20,297.
- 42nd Lunar and Planetary Science Conference (2011)